
12 KiB
Name
基于趋势跟踪止损的动量交易策略Momentum-Trading-Strategy-Based-on-Trend-Tracking-Stop-Loss
Author
ChaoZhang
Strategy Description
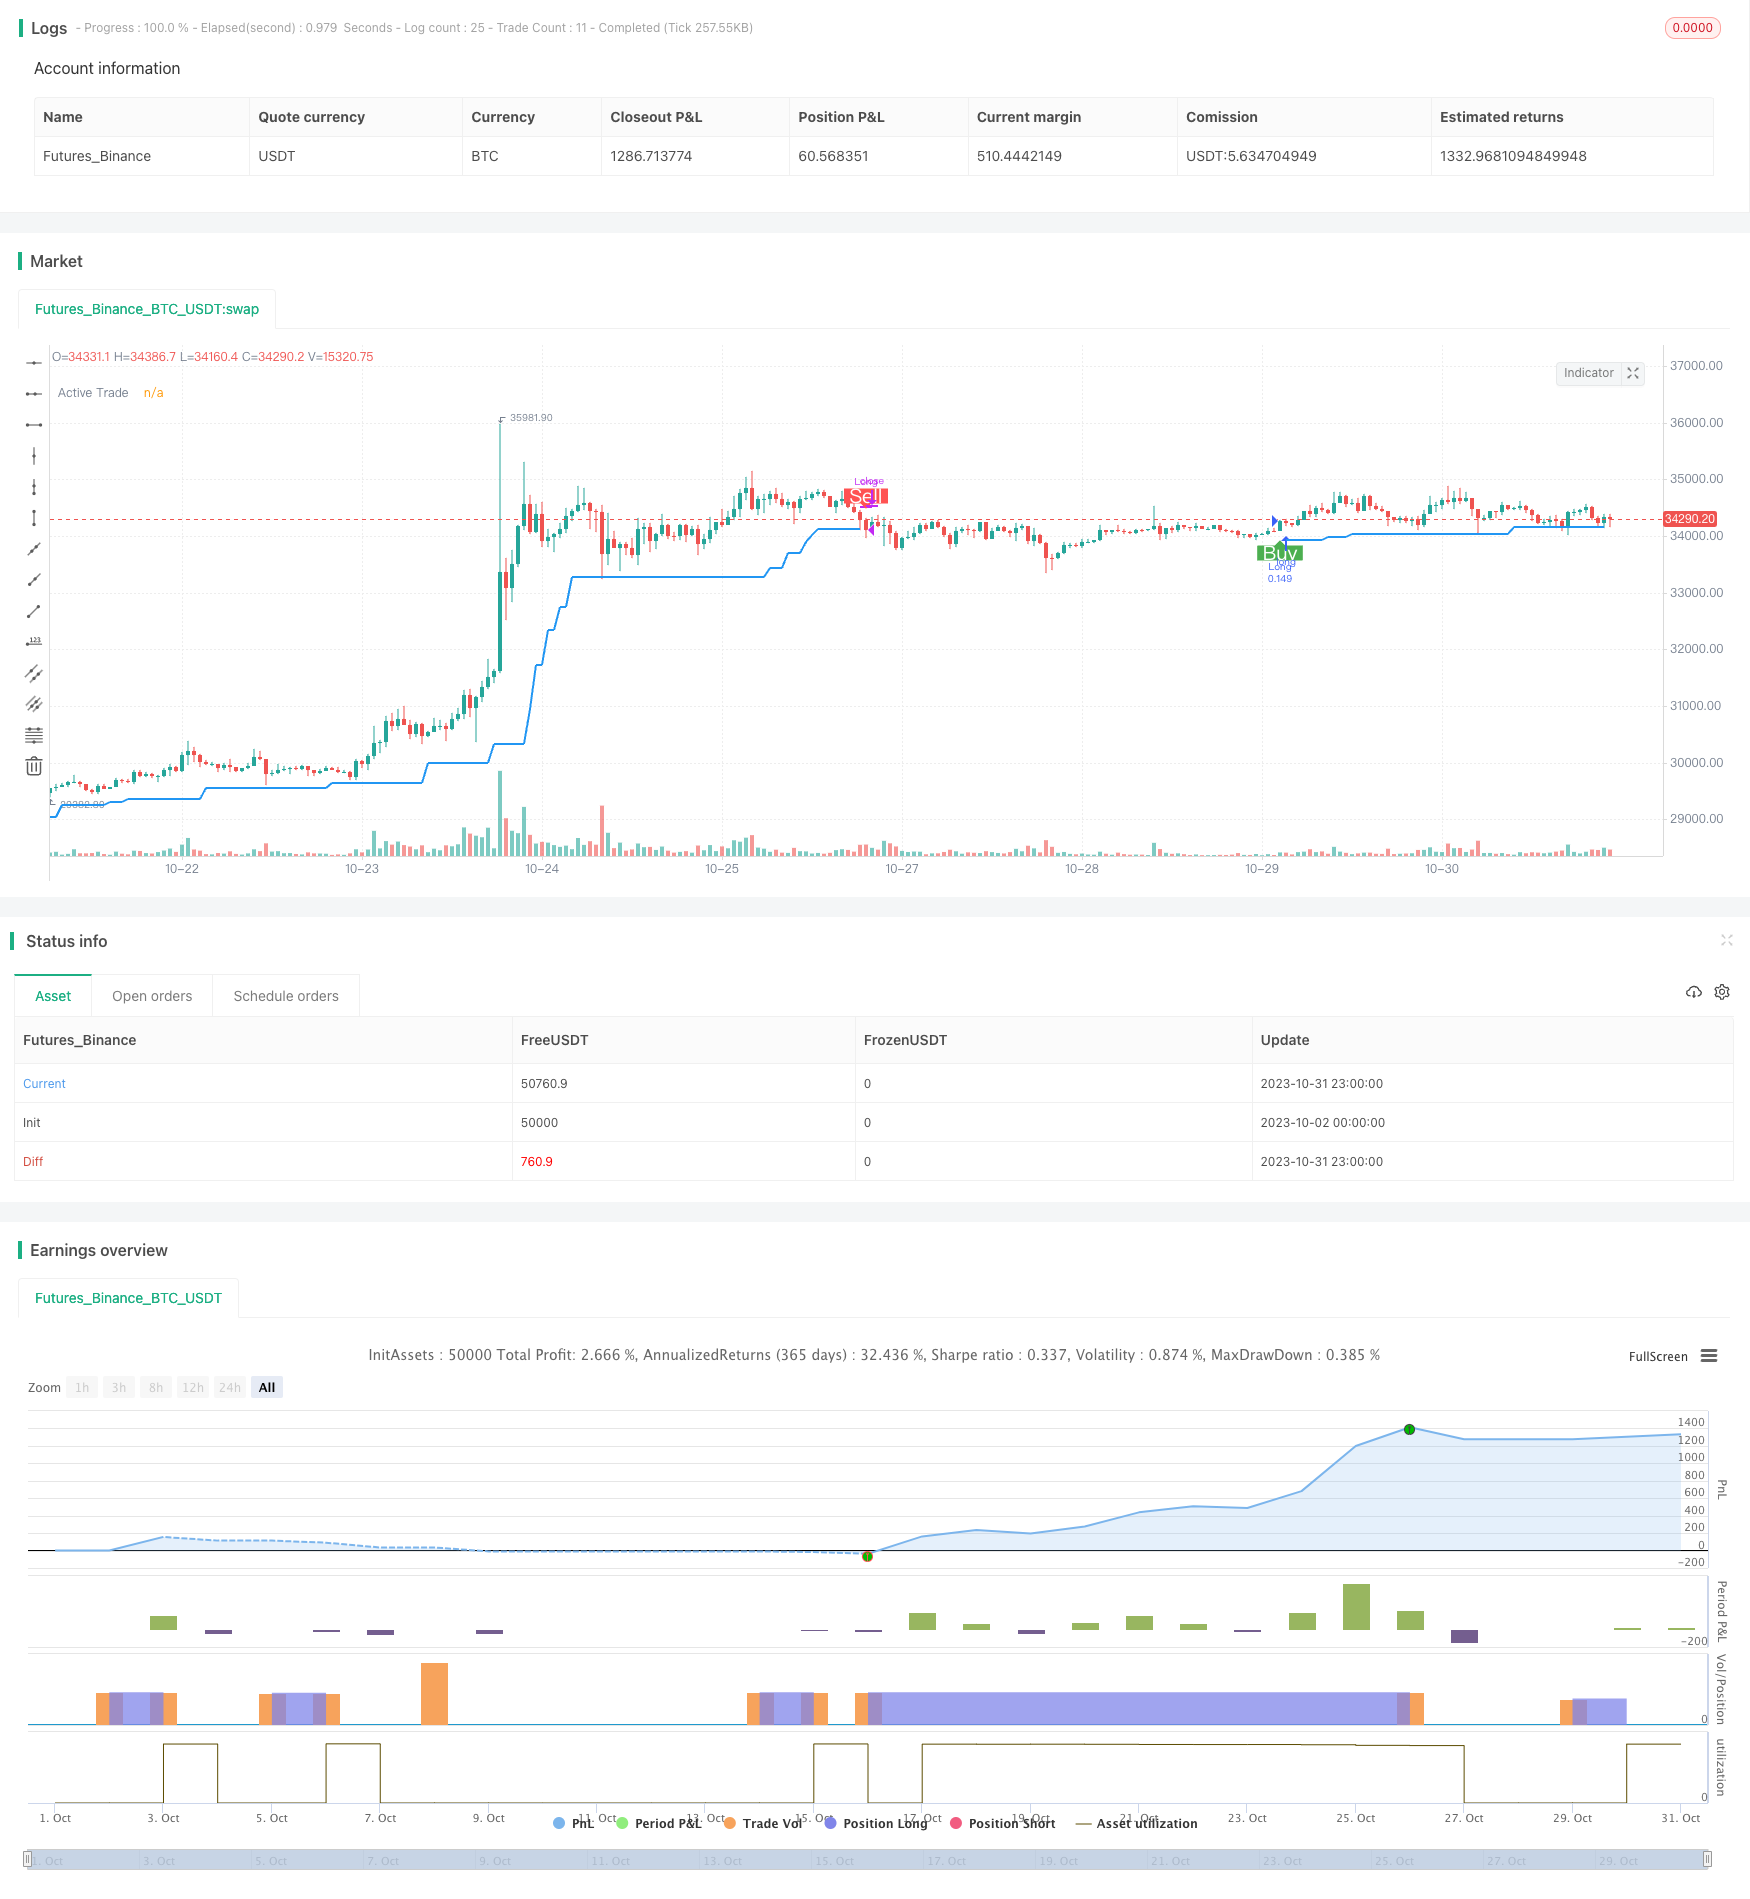 [trans]
概述
本策略基于动量指标RSI和趋势跟踪止损指标SuperTrend,设计了一个中长线的动量交易策略。该策略主要用于识别股票价格中存在的趋势性动量,并配合止损来锁定盈利,降低大幅回撤的概率。
原理
-
使用RSI识别股票中的趋势性动量
RSI指标可以有效识别股票价格中的趋势,RSI高于60时为超买区,表示当前股票处于强势上涨趋势中;RSI低于40时为超卖区,表示当前股票处于下跌趋势中。
本策略在RSI大于60时产生买入信号,表示识别到股票价格中的上涨动量,可以买入做多。
-
使用SuperTrend进行趋势跟踪止损
SuperTrend是一个趋势跟踪止损指标,它基于ATR和价格本身计算出一个动态止损线。当价格突破此止损线时,表示趋势发生反转,应当止损了结当前头寸。
本策略使用SuperTrend指标计算出的止损线作为策略的停损位,在价格突破该止损线时立即平仓止损。
优势
-
识别趋势性动量,profit from momentum
使用RSI指标可以有效识别出股票价格中存在的趋势性动量,这样可以在价格形成趋势的早期就进场,潜在获利空间更大。
-
止损控制风险,锁定盈利
通过SuperTrend指标的止损线,可以及时止损离场,避免回撤过大。同时也可以随着趋势的推进逐步抬高止损线锁定盈利。
-
策略逻辑清晰简单
本策略使用了两个指标的组合,每一个指标都具有明确的意义,策略逻辑简单清晰,容易理解和验证。
风险
-
虚假突破导致的止损被触发
在盘整时期,价格可能出现一些短期的突破又快速回调的虚假突破情况。这可能会导致止损线被触发,产生一些不必要的损失。
-
表现跟随大盘,具有一定相关性
本策略识别的是股票中的趋势性动量,所以它的表现会一定程度上跟随大盘 market 的走势。在大盘出现调整时,策略可能会产生额外的损失。
-
无法识别趋势反转
本策略专注于识别并跟踪趋势,无法有效识别趋势反转情况。一旦出现突然的趋势反转,策略可能难以及时止损,导致较大的损失。
优化方向
-
优化RSI参数,提高识别准确率
可以测试不同的RSI参数,找到最佳的参数组合,以提高RSI对趋势的识别准确率。
-
优化止损策略,降低止损率
可以尝试不同类型的止损方式,如离场前等待一定周期等,避免被高频的虚假突破止损出局。
-
增加趋势反转信号
可以考虑加入像MACD等指标,提前识别趋势反转情况,避免强势趋势反转后的大幅损失。
-
考虑适当的对冲手段
在大盘面临较大调整时,可以考虑加入一定的对冲组合,降低策略的市场相关性。
总结
本策略通过RSI识别趋势性动量以及SuperTrend的趋势跟踪止损这两个关键要素,构建了一个简单实用的中长线动量策略。该策略能够有效跟踪趋势,同时止损控制风险。通过优化参数以及增加反转信号等手段,可以进一步增强策略的表现。总体来说,本策略具有较强的实用性。
||
Overview
This strategy is based on the momentum indicator RSI and the trend tracking stop loss indicator SuperTrend, and designs a medium-to-long term momentum trading strategy. The strategy is mainly used to identify the trend momentum in stock prices and lock in profits with stop loss to reduce the probability of major retracements.
Principles
-
Identify trend momentum in stock prices using RSI
The RSI indicator can effectively identify trends in stock prices. RSI above 60 is overbought zone, indicating that the stock is in a strong uptrend; RSI below 40 is oversold zone, indicating that the stock is in a downtrend.
This strategy generates a buy signal when RSI is greater than 60, indicating that upward momentum is identified in stock prices, so we can buy.
-
Use SuperTrend for trend tracking stop loss
SuperTrend is a trend tracking stop loss indicator, which calculates a dynamic stop loss line based on ATR and price itself. When the price breaks through this stop loss line, it indicates a trend reversal, so the current position should be stopped out.
This strategy uses the stop loss line calculated by the SuperTrend indicator as the stop loss for the strategy. When the price breaks through the stop loss line, the position will be closed immediately.
Advantages
-
Identify trend momentum, profit from momentum
Using the RSI indicator can effectively identify the trend momentum in stock prices, so that we can get in early in the trend, and the potential profit space is greater.
-
Stop loss controls risk and locks in profit
Through the stop loss line of the SuperTrend indicator, we can stop loss in time to avoid excessive drawdowns. We can also gradually raise the stop loss line to lock in profits as the trend progresses.
-
Simple and clear strategy logic
This strategy uses a combination of two indicators, each with a clear meaning, and the strategy logic is simple and clear, easy to understand and verify.
Risks
-
Stop loss triggered by false breakouts
During consolidation periods, prices may have some short-term false breakouts followed by quick pullbacks. This could trigger the stop loss line and cause some unnecessary losses.
-
Performance correlates with the broader market
This strategy identifies trend momentum in stocks, so its performance will correlate to some extent with the broader market. When the market adjusts, the strategy may produce additional losses.
-
Failure to identify trend reversals
This strategy focuses on identifying and tracking trends, and cannot effectively identify trend reversals. In case of a sudden trend reversal, the strategy may fail to stop loss in time, leading to larger losses.
Optimization Directions
-
Optimize RSI parameters for higher accuracy
Test different RSI parameters to find the optimal combination to improve RSI's accuracy in trend identification.
-
Optimize stop loss strategies to lower stop loss rate
Try different types of stop loss methods, such as waiting for a period before exiting, to avoid being stopped out by high frequency false breakouts.
-
Add trend reversal signals
Consider adding indicators like MACD to identify trend reversals early, avoiding large losses after strong trend reversals.
-
Consider appropriate hedging
During significant market corrections, appropriate hedging combos can be added to reduce the strategy's market correlation.
Summary
This strategy builds a simple and practical medium-to-long term momentum strategy with the two key elements of identifying trend momentum using RSI and trend tracking stop loss using SuperTrend. The strategy can effectively track trends while controlling risk with stop loss. Further enhancements can be made through optimizing parameters and adding reversal signals. Overall, the strategy has strong practical utility.
[/trans]
Source (PineScript)
/*backtest
start: 2023-10-02 00:00:00
end: 2023-11-01 00:00:00
period: 1h
basePeriod: 15m
exchanges: [{"eid":"Futures_Binance","currency":"BTC_USDT"}]
*/

//@version=4
//
// ▒▒▒▒▒▒▒▒▒▒▒▒▒▒▒▒▒▒▒▒▒▒▒▒▒▒▒▒▒▒▒▒▒▒▒▒▒▒▒▒▒▒▒▒▒▒▒▒▒▒▒▒▒▒▒▒▒▒▒▒▒▒▒▒▒▒▒▒▒▒▒▒▒▒▒▒▒▒▒▒▒▒▒▒▒▒▒▒▒▒▒▒▒▒▒▒▒▒▒▒▒▒▒▒▒▒▒▒▒▒▒▒▒▒
//  -----------------------------------------------------------------------------
//  Copyright 2021 Amey Tavkar
//  Momentum Trading Strategy (Weekly Chart) script may be freely distributed under the MIT license.
//
//  Permission is hereby granted, free of charge,
//  to any person obtaining a copy of this software and associated documentation files (the "Software"),
//  to deal in the Software without restriction, including without limitation the rights to use, copy, modify, merge,
//  publish, distribute, sublicense, and/or sell copies of the Software, and to permit persons to whom the Software is furnished to do so,
//  subject to the following conditions:
//
//  The above copyright notice and this permission notice shall be included in all copies or substantial portions of the Software.
//
//  THE SOFTWARE IS PROVIDED "AS IS", WITHOUT WARRANTY OF ANY KIND,
//  EXPRESS OR IMPLIED, INCLUDING BUT NOT LIMITED TO THE WARRANTIES OF MERCHANTABILITY,
//  FITNESS FOR A PARTICULAR PURPOSE AND NONINFRINGEMENT. IN NO EVENT SHALL THE AUTHORS OR COPYRIGHT HOLDERS BE LIABLE FOR ANY CLAIM,
//  DAMAGES OR OTHER LIABILITY, WHETHER IN AN ACTION OF CONTRACT, TORT OR OTHERWISE, ARISING FROM,
//  OUT OF OR IN CONNECTION WITH THE SOFTWARE OR THE USE OR OTHER DEALINGS IN THE SOFTWARE.
//
//  -----------------------------------------------------------------------------
//
//  Description
//  ===========
//  The strategy will open position when there is momentum in the stock
//  The strategy will ride up your stop loss based on the super trend.
//  The strategy will close your operation when the market price crossed the stop loss.
//  The strategy will close operation when the line based on the volatility will crossed
//
//
//  -----------------------------------------------------------------------------
//  Disclaimer:
//    1. I am not licensed financial advisors or broker dealers. I do not tell you
//       when or what to buy or sell. I developed this software which enables you
//       execute manual or automated trades multplierFactoriplierFactoriple trades using TradingView. The
//       software allows you to set the criteria you want for entering and exiting
//       trades.
//    2. Do not trade with money you cannot afford to lose.
//    3. I do not guarantee consistent profits or that anyone can make money with no
//       effort. And I am not selling the holy grail.
//    4. Every system can have winning and losing streaks.
//    5. Money management plays a large role in the results of your trading. For
//       example: lot size, account size, broker leverage, and broker margin call
//       rules all have an effect on results. Also, your Take Profit and Stop Loss
//       settings for individual pair trades and for overall account equity have a
//       major impact on results. If you are new to trading and do not understand
//       these items, then I recommend you seek education materials to further your
//       knowledge.
//
//    YOU NEED TO FIND AND USE THE TRADING SYSTEM THAT WORKS BEST FOR YOU AND YOUR
//    TRADING TOLERANCE.
//
//    I HAVE PROVIDED NOTHING MORE THAN A TOOL WITH OPTIONS FOR YOU TO TRADE WITH THIS PROGRAM ON TRADINGVIEW.
//
//    I accept suggestions to improve the script.
//    If you encounter any problems I will be happy to share with me.
//  -----------------------------------------------------------------------------
//
// ▒▒▒▒▒▒▒▒▒▒▒▒▒▒▒▒▒▒▒▒▒▒▒▒▒▒▒▒▒▒▒▒▒▒▒▒▒▒▒▒▒▒▒▒▒▒▒▒▒▒▒▒▒▒▒▒▒▒▒▒▒▒▒▒▒▒▒▒▒▒▒▒▒▒▒▒▒▒▒▒▒▒▒▒▒▒▒▒▒▒▒▒▒▒▒▒▒▒▒
strategy("Momentum Trading Strategy (Weekly Chart)", precision = 2, overlay = true, default_qty_type = strategy.percent_of_equity, default_qty_value = 10)

//Entry
[fastSupertrend, fastSupertrendDir]  = supertrend(5, 1)
rsi = rsi(close, 14)
entry = close > fastSupertrend and rsi > 60
strategy.entry("Long", strategy.long, when = entry)
plotshape(entry and strategy.opentrades == 0,color=color.green,text="Buy",location=location.belowbar,style=shape.labelup,textcolor=color.white, size = size.normal)
plot(fastSupertrendDir == -1 and strategy.opentrades == 1  ? fastSupertrend : na, title="Active Trade", style=plot.style_linebr, linewidth=2, color=color.blue)

//Exit
exit = close < fastSupertrend
strategy.close("Long", when = exit)
plotshape(exit and strategy.opentrades == 1,color=color.red,text="Sell",style=shape.labeldown,textcolor=color.white, size=size.normal)
Detail
https://www.fmz.com/strategy/430834
Last Modified
2023-11-02 13:59:20