
12 KiB
Name
基于趋势的开尔特纳通道策略Keltner-Channel-Trend-Based-Strategy
Author
ChaoZhang
Strategy Description
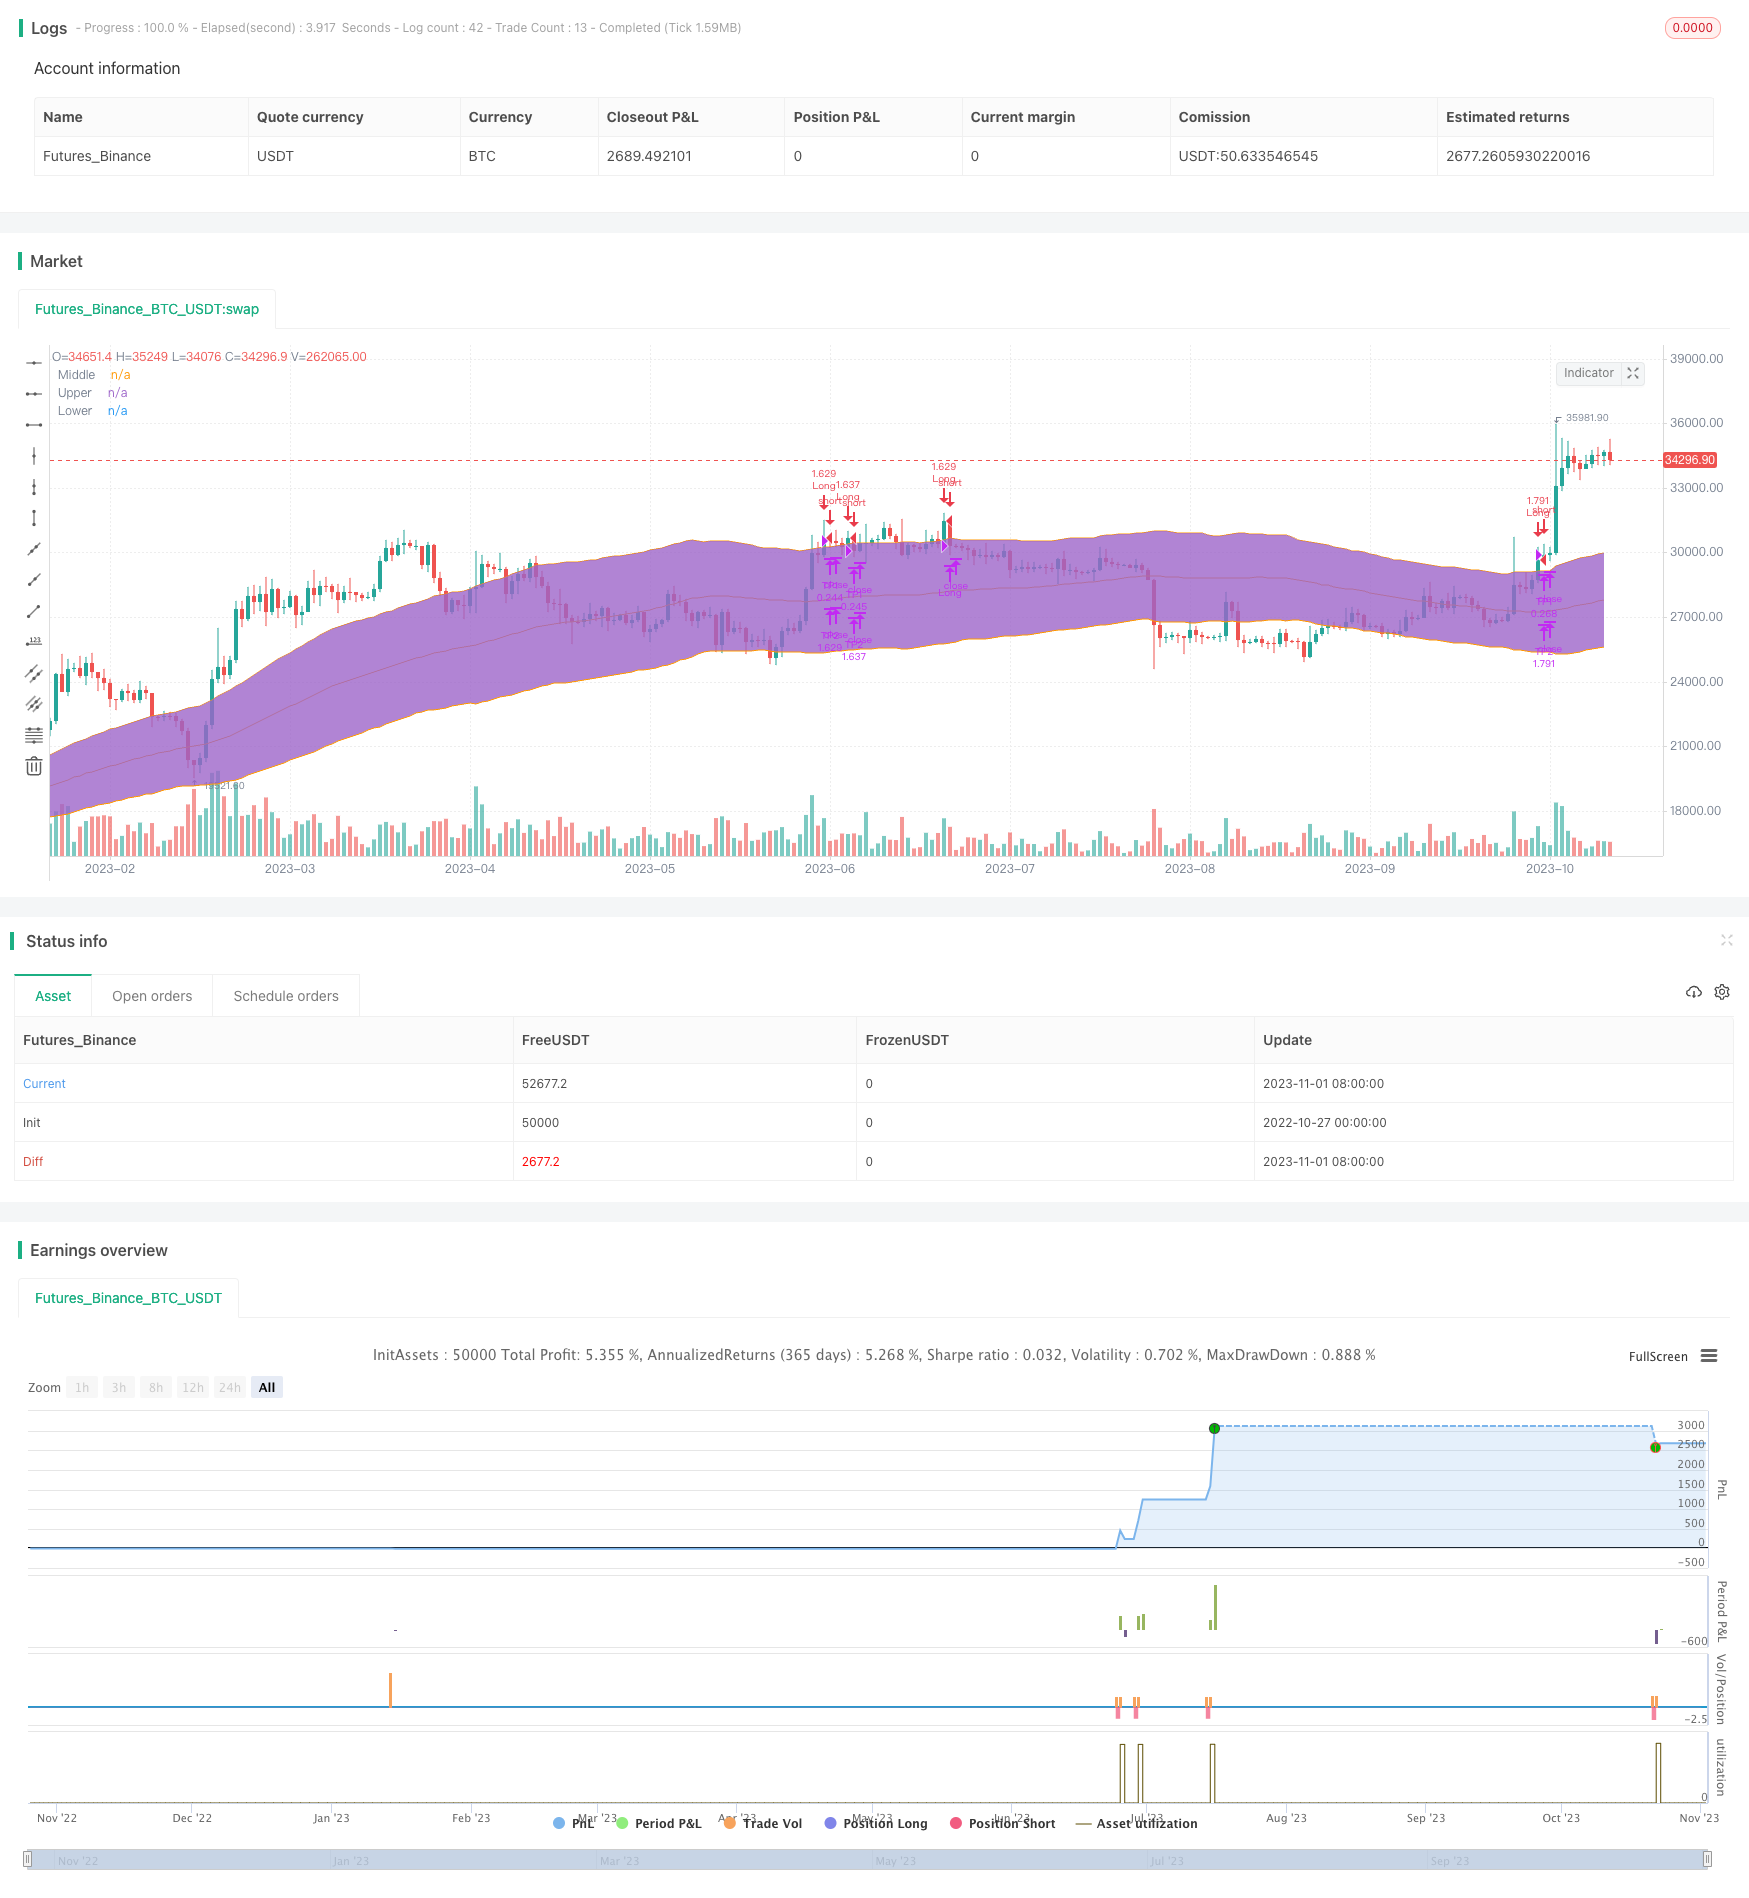 [trans]
概述
该策略基于三个主要指标:趋势指标、开尔特纳通道和DM指标。
趋势指标由SMA和EMA组成。当EMA上穿SMA时,确认进入趋势。开尔特纳通道则用来判断Candle的打开和收盘价格。DM指标用于判断多空方向。
满足以下入场条件时可做多:
- EMA上穿SMA,确认趋势上行
- Candle打开价格在上沿上方,收盘价格在通道内部
- DM指标大于设置的基准线
策略设置两个止盈位和一个止损位。可以考虑使用追踪止损来获取更多利润。
策略原理
趋势判断
通过EMA和SMA的金叉死叉来判断趋势方向。EMA参数为46,SMA参数为46。EMA上穿SMA时,表示进入上升趋势。
开尔特纳通道
开尔特纳通道包含三条线:中线、上轨、下轨。中线为收盘价的SMA,长度为81。上轨和下轨分别位于中线之上和之下指定倍数的真实振幅。这里设置为中线之上下2.5倍的振幅。
开尔特纳通道主要用于判断价格是否处于通道内,以及穿越通道的情况。
DM指标
DM指标包含三条线:ADX、+DI和-DI。+DI测量升势力量,-DI测量跌势力量。ADX代表平均趋向指标,反映趋势的力量。
这里设置ADX参数为10,DI参数为19。当+DI线上穿设置的基准线(默认27)时,表示涨势强劲,适合做多。
优势分析
该策略结合了趋势、通道和强弱指标,能有效判断价格走势和多空方向。具有以下优势:
-
趋势判断相对准确,可避免逆势操作。
-
开尔特纳通道清晰可见,形成支撑和压力位。
-
DM指标可测量多空力量,确保多空方向正确。
-
策略条件严谨,可有效过滤冲高回落的假突破。
-
设置止盈止损点,有利于把握盈利机会。
风险分析
该策略也存在一定的风险:
-
趋势可能发生转折,EMA可能会下穿SMA,应注意及时退出。
-
强势行情中,通道可能失效,不能חּ当作严格的支撑压力位。
-
DM指标可能发出错误信号,应结合价格行情判断。
-
假突破可能触发入场,但很快再次回落,应设置合理止损。
-
止盈止损点需要不断优化,以适应市场的变化。
优化方向
可以从以下几个方面进一步优化:
-
调整参数,测试不同趋势判断方法的效果。
-
优化通道参数,使之更贴近真实的波动范围。
-
测试不同的DM参数组合,选择最佳参数。
-
设置不同的入场条件,如结合交易量过滤。
-
优化止盈止损策略,如试用追踪止损来获取更多利润。
-
针对不同品种分别测试,选取最佳参数组合。
总结
该策略综合运用多种指标判断趋势方向、支撑压力位和多空力量,可以有效捕捉趋势且控制风险。但仍需注意风险,优化参数以适应市场变化。整体来说,该策略具有较强的实用性。
||
Overview
This strategy is based on three main indicators: trend indicator, Keltner Channel and DM indicator.
The trend indicator consists of SMA and EMA. Keltner Channel is used to determine the open and close price of candles. DM indicator is for judging the direction of long and short.
The entry signal is triggered when:
- EMA crosses over SMA, confirming uptrend
- Candle opens above the upper band and closes inside the channel
- DM indicator is above the benchmark
The strategy has two take profit levels and one stop loss level. Trailing stop can be used for optimizing profits.
Strategy Principles
Trend Identification
SMA and EMA crossovers are used to determine the trend direction. EMA (46) crossing over SMA (46) indicates an upward trend.
Keltner Channel
The channel has three lines: middle, upper and lower. The middle line is SMA of close price with length of 81. The upper and lower bands are placed at a multiple of true range above and below the middle line. Here we use 2.5 times of true range.
Keltner Channel shows support and resistance levels. Price movements in relation to the channel are analyzed.
DM Indicator
DM indicator contains ADX, +DI and -DI. +DI measures uptrend strength while -DI measures downtrend strength. ADX shows the trend strength.
Here ADX (10), DI (19) are used. When +DI crosses above the benchmark (default 27), it signals strong uptrend and good for long entry.
Advantage Analysis
This strategy combines trend, channel and momentum indicators to effectively determine price actions and long/short direction. The advantages are:
-
Trend identification is relatively accurate to avoid counter trend trades.
-
Keltner Channel shows clear support and resistance levels.
-
DM indicator measures long/short momentum to ensure direction.
-
Strict entry rules help filter false breakouts.
-
Take profit and stop loss points allow capturing profits.
Risk Analysis
There are also some risks to consider:
-
Trend may reverse when EMA crosses below SMA, so exit timely.
-
Channel can fail in strong trends, not strict support/resistance.
-
DM may generate false signals, check price action.
-
False breakout may trigger entry but quickly fallback, use reasonable stop loss.
-
Take profit and stop loss need continuous optimization to adapt to changing market conditions.
Optimization Directions
Some ways to further optimize the strategy:
-
Adjust parameters and test different trend identification methods.
-
Optimize channel parameters to better fit true range.
-
Test different DM parameters and find the optimal combination.
-
Add more entry filters like volume.
-
Try trailing stop loss for getting more profits.
-
Test separately for different products to find best parameter sets.
Conclusion
The strategy integrates multiple indicators for determining trend, support/resistance and momentum, which allows effectively catching trends and controlling risks. But risks need to be noticed and parameters require optimization as market changes. Overall, this is a strategy with strong practicality.
[/trans]
Strategy Arguments
| Argument | Default | Description |
|---|---|---|
| v_input_1 | 46 | Period |
| v_input_2 | true | useTrueRange |
| v_input_3 | 81 | length |
| v_input_4 | 2.5 | mult |
| v_input_5 | 19 | DI Length |
| v_input_6 | 27 | DMI Benchmark |
| v_input_7 | 2019 | Backtest Start Year |
| v_input_8 | true | Backtest Start Month |
| v_input_9 | true | Backtest Start Day |
| v_input_10 | 9999 | Backtest Stop Year |
| v_input_11 | 12 | Backtest Stop Month |
| v_input_12 | 31 | Backtest Stop Day |
| v_input_13 | 4.5 | Long Take Profit 1 % |
| v_input_14 | 15 | Long Take Profit 1 Qty |
| v_input_15 | 20 | Long Take Profit 2% |
| v_input_16 | 100 | Long Take Profit 2 Qty |
| v_input_17 | 4 | Long Stop Loss % |
Source (PineScript)
/*backtest
start: 2022-10-27 00:00:00
end: 2023-11-02 00:00:00
period: 1d
basePeriod: 1h
exchanges: [{"eid":"Futures_Binance","currency":"BTC_USDT"}]
*/

//Original Idea by: Wunderbit Trading

//@version=4
strategy("Keltner Channel ETH/USDT 1H", overlay=true, initial_capital=1000,pyramiding = 0, currency="USD", default_qty_type=strategy.percent_of_equity, default_qty_value=100,  commission_type=strategy.commission.percent,commission_value=0.07)


/// TREND
ribbon_period = input(46, "Period", step=1)

leadLine1 = ema(close, ribbon_period)
leadLine2 = sma(close, ribbon_period)

// p3 = plot(leadLine1, color= #53b987, title="EMA", transp = 50, linewidth = 1)
// p4 = plot(leadLine2, color= #eb4d5c, title="SMA", transp = 50, linewidth = 1)
// fill(p3, p4, transp = 60, color = leadLine1 > leadLine2 ? #53b987 : #eb4d5c)

//Upward Trend
UT=leadLine2 < leadLine1
DT=leadLine2>leadLine1

///////////////////////////////////////INDICATORS

// KELTNER //
source       = close
useTrueRange = input(true)
length       = input(81, step=1, minval=1)
mult         = input(2.5, step=0.1)

// Calculate Keltner Channel
ma      = sma(source, length)
range   = useTrueRange ? tr : high - low
rangema = sma(range, length)
upper = ma + rangema * mult
lower = ma - rangema * mult

plot(ma, title="Middle", color=color.orange)
p1=plot(upper, title="Upper", color=color.orange)
p2=plot(lower, title="Lower", color=color.orange)
fill(p1,p2)


// DMI INDICATOR //
adxlen = 10 // input(10, title="ADX Smoothing")
dilen = input(19, title="DI Length")
keyLevel = 23// input(23, title="key level for ADX")
dirmov(len) =>
	up = change(high)
	down = -change(low)
	truerange = rma(tr, len)
	plus = fixnan(100 * rma(up > down and up > 0 ? up : 0, len) / truerange)
	minus = fixnan(100 * rma(down > up and down > 0 ? down : 0, len) / truerange)
	[plus, minus]

adx(dilen, adxlen) =>
	[plus, minus] = dirmov(dilen)
	sum = plus + minus
	adx = 100 * rma(abs(plus - minus) / (sum == 0 ? 1 : sum), adxlen)
	[adx, plus, minus]

[sig, up, down] = adx(dilen, adxlen)

benchmark=input(title="DMI Benchmark", defval=27, minval=1,step=1)

// plot(sig, color=color.red, title="ADX")
// plot(up, style=plot.style_histogram, color=color.green, title="+DI")
// plot(down, style=plot.style_histogram, color=color.red, title="-DI")
// plot(keyLevel, color=color.white, title="Key Level")

///////////////////////////////////////////////////////////


////////////////////////////////////////////////////Component Code Start

testStartYear = input(2019, "Backtest Start Year")
testStartMonth = input(1, "Backtest Start Month")
testStartDay = input(1, "Backtest Start Day")
testPeriodStart = timestamp(testStartYear,testStartMonth,testStartDay,0,0)

testStopYear = input(9999, "Backtest Stop Year")
testStopMonth = input(12, "Backtest Stop Month")
testStopDay = input(31, "Backtest Stop Day")
testPeriodStop = timestamp(testStopYear,testStopMonth,testStopDay,0,0)

testPeriod() => true
///// Component Code Stop //////////////////////////////////////////

//////////////// STRATEGY EXECUTION //////////////////////////

//LONG SET UP
// Take Profit / Stop Loss
long_tp1_inp = input(4.5, title='Long Take Profit 1 %', step=0.1)/100
long_tp1_qty = input(15, title="Long Take Profit 1 Qty", step=1)

long_tp2_inp = input(20, title='Long Take Profit 2%', step=0.1)/100
long_tp2_qty = input(100, title="Long Take Profit 2 Qty", step=1)

long_take_level_1 = strategy.position_avg_price * (1 + long_tp1_inp)
long_take_level_2 = strategy.position_avg_price * (1 + long_tp2_inp)

long_sl_inp = input(4, title='Long Stop Loss %', step=0.1)/100
long_stop_level = strategy.position_avg_price * (1 - long_sl_inp)


// STRATEGY CONDITION
// LONG
entry_long = ((open > lower and open < upper) and close > upper) and up > down and up > benchmark //  and volume[0] > volume[1]
entry_price_long=valuewhen(entry_long,close,0)
SL_long = entry_price_long * (1 - long_sl_inp)
exit_long = (close < lower) or low < SL_long


// STRATEGY EXECUTION
if testPeriod()

    // LONG
    if UT
        strategy.entry(id="Long", long=true, when=entry_long, comment = "INSERT ENTER LONG COMMAND")
    strategy.exit("TP1","Long", qty_percent=long_tp1_qty, limit=long_take_level_1) // PLACE TAKE PROFIT IN WBT BOT SETTINGS
    strategy.exit("TP2","Long", qty_percent=long_tp2_qty, limit=long_take_level_2) // PLACE TAKE PROFIT IN WBT BOT SETTINGS
    strategy.close(id="Long", when=exit_long, comment= "INSERT EXIT LONG COMMAND")


//PLOT FIXED SLTP LINE
// LONG POSITION
plot(strategy.position_size > 0 ? long_take_level_1 : na, style=plot.style_linebr, color=color.green, linewidth=1, title="1st Long Take Profit")
plot(strategy.position_size > 0 ? long_take_level_2 : na, style=plot.style_linebr, color=color.green, linewidth=1, title="2nd Long Take Profit")
plot(strategy.position_size > 0 ? long_stop_level : na, style=plot.style_linebr, color=color.red, linewidth=1, title="Long Stop Loss")
Detail
https://www.fmz.com/strategy/431005
Last Modified
2023-11-03 16:59:39