
13 KiB
Name
基于艾略特波浪与汤姆德马克顺势交易策略-Elliott-Wave-and-Tom-DeMark-Trend-Following-Trading-Strategy
Author
ChaoZhang
Strategy Description
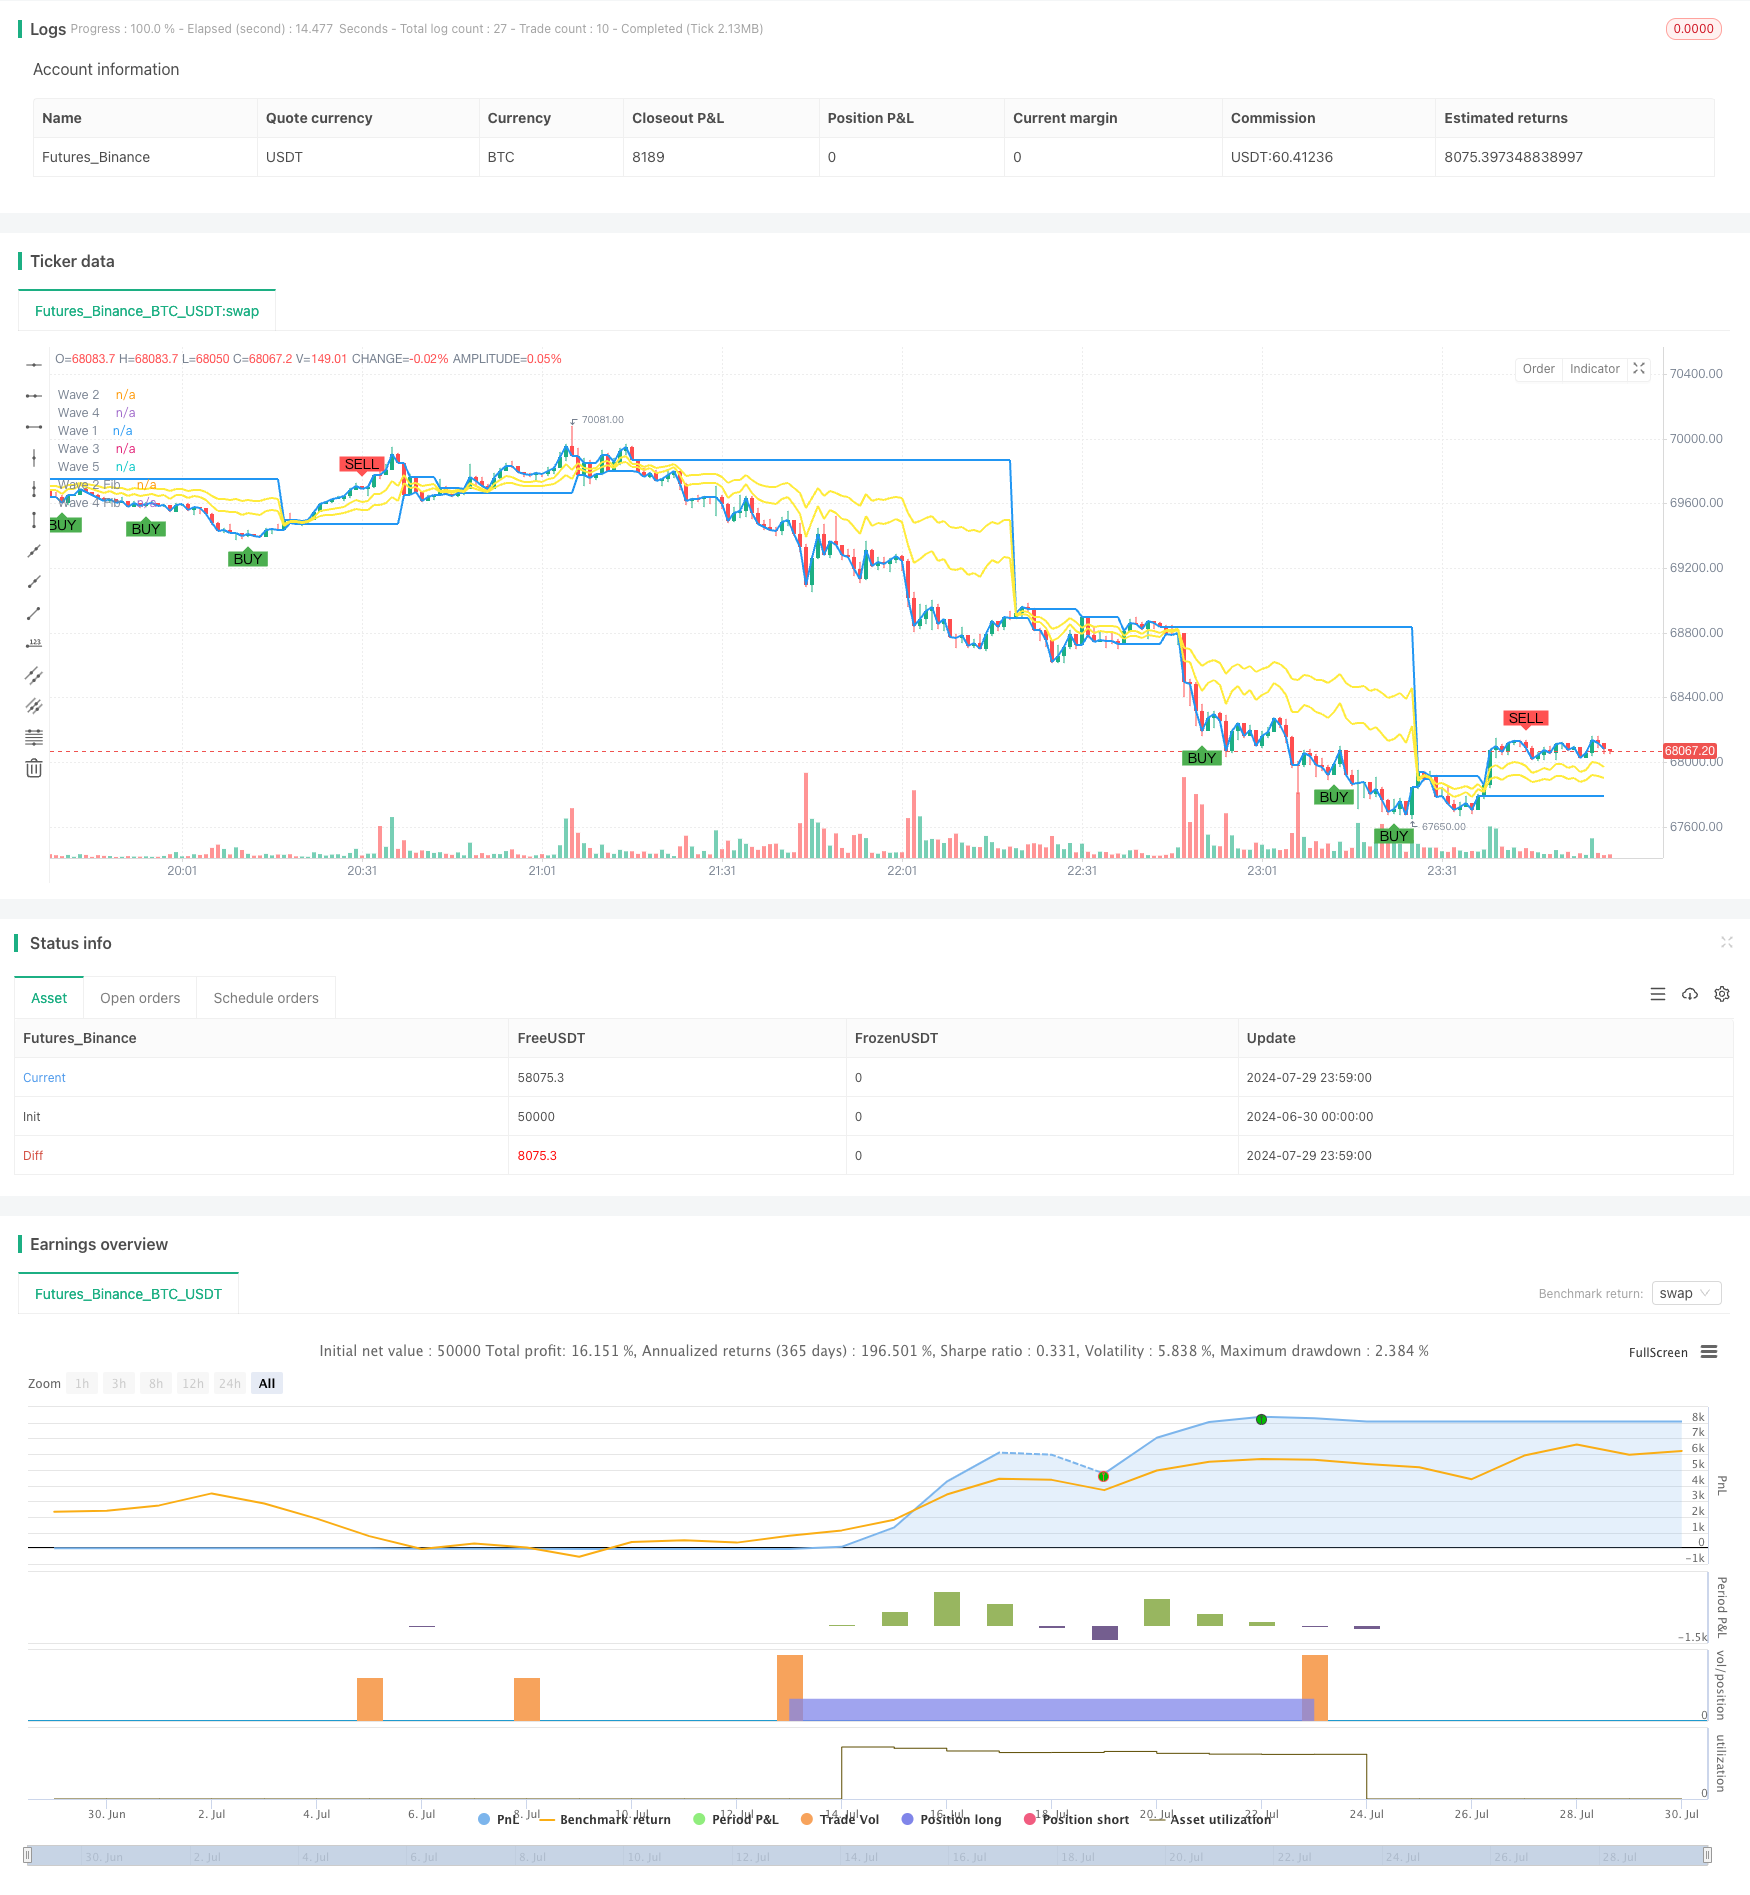
[trans]
概述
这个策略结合了艾略特波浪理论(Elliott Wave Theory)和汤姆·德马克序列(Tom DeMark Sequential)指标,旨在捕捉市场趋势并在适当时机进行交易。该策略使用指数移动平均线(EMA)来识别波浪,并利用斐波那契回调水平来确定关键支撑和阻力位。同时,它还通过TD Sequential指标来确认交易信号,特别是当连续出现三次买入或卖出信号时。这种方法试图在技术分析的基础上,结合多种指标来提高交易的准确性和盈利能力。
策略原理
-
艾略特波浪识别:
- 使用21周期EMA作为基准线来识别波浪。
- 当价格穿过EMA时,标记为新的波浪开始。
- 记录五个主要波浪点:Wave 1, Wave 2, Wave 3, Wave 4, 和 Wave 5。
-
斐波那契回调:
- 计算Wave 2的61.8%回调水平和Wave 4的38.2%回调水平。
- 这些水平用于确定潜在的支撑和阻力位。
-
TD Sequential信号:
- 使用9周期作为TD Sequential的默认设置。
- 当价格连续9个周期高于4周期前的收盘价时,形成卖出信号。
- 当价格连续9个周期低于4周期前的收盘价时,形成买入信号。
-
交易信号生成:
- 当TD Sequential连续3次给出买入信号,且Wave 5已形成时,触发做多信号。
- 当TD Sequential连续3次给出卖出信号,且Wave 5已形成时,触发做空信号。
-
止损和获利:
- 做多交易的止损设在Wave 1,获利目标设在Wave 3。
- 做空交易的止损设在Wave 4,获利目标设在Wave 2。
策略优势
-
多指标融合:结合了艾略特波浪理论和TD Sequential指标,提高了信号的可靠性。
-
趋势跟踪:通过识别波浪和使用EMA,策略能够有效地跟踪市场趋势。
-
风险管理:使用关键波浪点作为止损和获利目标,提供了清晰的风险管理框架。
-
信号确认:要求TD Sequential连续三次给出相同信号,减少了假信号的影响。
-
适应性:通过参数设置,策略可以适应不同的市场环境和交易品种。
-
客观性:基于明确的技术指标和规则,减少了主观判断带来的偏差。
策略风险
-
过度依赖技术指标:在某些市场条件下,纯粹的技术分析可能会忽视基本面因素。
-
滞后性:EMA和TD Sequential都是滞后指标,可能导致在趋势反转时反应较慢。
-
假突破:在横盘市场中,可能会产生多次假突破信号,增加交易成本。
-
参数敏感性:策略性能可能对EMA长度和TD Sequential周期的选择非常敏感。
-
复杂性:结合多个指标可能使策略变得复杂,增加了过度拟合的风险。
-
市场条件依赖:在强趋势市场中表现可能更好,但在震荡市场中可能效果不佳。
策略优化方向
-
动态参数调整:
- 实现:根据市场波动性自动调整EMA长度和TD Sequential周期。
- 原因:提高策略对不同市场条件的适应性。
-
整合成交量分析:
- 实现:在信号生成过程中考虑成交量指标。
- 原因:提高趋势确认的可靠性,减少假突破。
-
引入波动率过滤器:
- 实现:在低波动率期间减少或暂停交易。
- 原因:避免在横盘市场中频繁交易,降低成本。
-
优化止损策略:
- 实现:使用动态止损,如ATR(平均真实波幅)或波动率百分比止损。
- 原因:更好地适应市场波动,保护利润。
-
加入时间过滤:
- 实现:考虑市场时间因素,避开高波动性时段。
- 原因:减少在不利时间段交易带来的风险。
-
多时间框架分析:
- 实现:在进入交易前,确认更高时间框架的趋势方向。
- 原因:提高交易信号的质量,减少逆势交易。
总结
基于艾略特波浪与汤姆·德马克顺势交易策略是一个综合性的技术分析方法,它巧妙地结合了波浪理论、趋势跟踪和动量指标。通过EMA识别波浪,使用斐波那契回调确定关键价格水平,并利用TD Sequential确认交易信号,该策略旨在捕捉强劲的市场趋势。
策略的主要优势在于其多层面的信号确认机制和清晰的风险管理框架。然而,它也面临着过度依赖技术指标和可能的滞后性等挑战。为了优化策略表现,可以考虑引入动态参数调整、整合成交量分析、使用波动率过滤器等方法。
总的来说,这个策略为交易者提供了一个结构化的方法来分析和交易金融市场。但是,像所有交易策略一样,它需要在实际应用中经过严格的回测和持续的优化。交易者应该根据自己的风险承受能力和交易目标来调整策略参数,并始终保持对市场变化的警惕。
||
Overview
This strategy combines Elliott Wave Theory and Tom DeMark Sequential indicator to capture market trends and execute trades at opportune moments. It utilizes Exponential Moving Average (EMA) to identify waves and employs Fibonacci retracement levels to determine key support and resistance levels. Simultaneously, it uses the TD Sequential indicator to confirm trading signals, especially when three consecutive buy or sell signals occur. This approach attempts to enhance trading accuracy and profitability by integrating multiple indicators based on technical analysis.
Strategy Principles
-
Elliott Wave Identification:
- Uses a 21-period EMA as a baseline for wave identification.
- Marks the beginning of a new wave when price crosses the EMA.
- Records five main wave points: Wave 1, Wave 2, Wave 3, Wave 4, and Wave 5.
-
Fibonacci Retracement:
- Calculates 61.8% retracement level for Wave 2 and 38.2% retracement level for Wave 4.
- These levels are used to identify potential support and resistance areas.
-
TD Sequential Signals:
- Uses a default setting of 9 periods for TD Sequential.
- Forms a sell signal when price closes higher than the close 4 periods ago for 9 consecutive periods.
- Forms a buy signal when price closes lower than the close 4 periods ago for 9 consecutive periods.
-
Trade Signal Generation:
- Triggers a long signal when TD Sequential gives 3 consecutive buy signals and Wave 5 has formed.
- Triggers a short signal when TD Sequential gives 3 consecutive sell signals and Wave 5 has formed.
-
Stop Loss and Take Profit:
- Sets stop loss at Wave 1 and take profit at Wave 3 for long trades.
- Sets stop loss at Wave 4 and take profit at Wave 2 for short trades.
Strategy Advantages
-
Multi-indicator Integration: Combines Elliott Wave Theory and TD Sequential indicator, increasing signal reliability.
-
Trend Following: Effectively tracks market trends through wave identification and EMA use.
-
Risk Management: Provides a clear risk management framework using key wave points as stop loss and profit targets.
-
Signal Confirmation: Requires three consecutive identical signals from TD Sequential, reducing the impact of false signals.
-
Adaptability: Can be adapted to different market environments and trading instruments through parameter settings.
-
Objectivity: Based on clear technical indicators and rules, reducing bias from subjective judgment.
Strategy Risks
-
Over-reliance on Technical Indicators: May overlook fundamental factors in certain market conditions.
-
Lagging Nature: Both EMA and TD Sequential are lagging indicators, potentially leading to slow reactions to trend reversals.
-
False Breakouts: May generate multiple false breakout signals in range-bound markets, increasing trading costs.
-
Parameter Sensitivity: Strategy performance may be highly sensitive to the choice of EMA length and TD Sequential period.
-
Complexity: Combining multiple indicators may make the strategy complex, increasing the risk of overfitting.
-
Market Condition Dependency: May perform better in strong trend markets but potentially underperform in choppy markets.
Strategy Optimization Directions
-
Dynamic Parameter Adjustment:
- Implementation: Automatically adjust EMA length and TD Sequential period based on market volatility.
- Reason: Improve strategy adaptability to different market conditions.
-
Incorporate Volume Analysis:
- Implementation: Consider volume indicators in the signal generation process.
- Reason: Enhance trend confirmation reliability and reduce false breakouts.
-
Introduce Volatility Filter:
- Implementation: Reduce or pause trading during low volatility periods.
- Reason: Avoid frequent trading in range-bound markets, lowering costs.
-
Optimize Stop Loss Strategy:
- Implementation: Use dynamic stop losses, such as ATR (Average True Range) or volatility percentage stops.
- Reason: Better adapt to market volatility and protect profits.
-
Add Time Filtering:
- Implementation: Consider market time factors, avoiding high volatility periods.
- Reason: Reduce risks associated with trading during unfavorable time periods.
-
Multi-timeframe Analysis:
- Implementation: Confirm trend direction in higher timeframes before entering trades.
- Reason: Improve trade signal quality and reduce counter-trend trades.
Conclusion
The Elliott Wave and Tom DeMark Trend-Following Trading Strategy is a comprehensive technical analysis method that cleverly combines wave theory, trend following, and momentum indicators. By identifying waves through EMA, determining key price levels using Fibonacci retracements, and confirming trade signals with TD Sequential, this strategy aims to capture strong market trends.
The strategy's main advantages lie in its multi-layered signal confirmation mechanism and clear risk management framework. However, it also faces challenges such as over-reliance on technical indicators and potential lag in signal generation. To optimize strategy performance, considerations can be given to introducing dynamic parameter adjustments, integrating volume analysis, and using volatility filters.
Overall, this strategy provides traders with a structured approach to analyzing and trading financial markets. However, like all trading strategies, it requires rigorous backtesting and continuous optimization in practical applications. Traders should adjust strategy parameters according to their risk tolerance and trading objectives, and always remain vigilant to market changes.
[/trans]
Source (PineScript)
/*backtest
start: 2024-06-30 00:00:00
end: 2024-07-30 00:00:00
period: 1m
basePeriod: 1m
exchanges: [{"eid":"Futures_Binance","currency":"BTC_USDT"}]
*/

//@version=5
strategy("Elliott Wave and Tom DeMark Strategy", overlay=true)

// Tom DeMark Sequential Settings
td_length = input(9, title="TD Sequential Length")

// Tom DeMark Sequential
var int tdUpCount = 0
var int tdDownCount = 0

if close > close[4]
    tdUpCount := na(tdUpCount) ? 1 : tdUpCount + 1
    tdDownCount := 0
else if close < close[4]
    tdDownCount := na(tdDownCount) ? 1 : tdDownCount + 1
    tdUpCount := 0
else
    tdUpCount := 0
    tdDownCount := 0

tdBuySetup = (tdDownCount == td_length)
tdSellSetup = (tdUpCount == td_length)

plotshape(series=tdBuySetup, title="TD Buy Signal", location=location.belowbar, color=color.green, style=shape.labelup, text="BUY")
plotshape(series=tdSellSetup, title="TD Sell Signal", location=location.abovebar, color=color.red, style=shape.labeldown, text="SELL")

// Elliott Wave Settings
wave_length = input(21, title="EMA Length for Wave Identification")
ema = ta.ema(close, wave_length)
var int wave_trend = na

wave_trend := ta.crossover(close, ema) ? 1 : ta.crossunder(close, ema) ? -1 : nz(wave_trend[1])

var float wave1 = na
var float wave2 = na
var float wave3 = na
var float wave4 = na
var float wave5 = na

wave1 := ta.valuewhen(wave_trend == 1, close, 0)
wave2 := ta.valuewhen(wave_trend == -1, close, 0)
wave3 := ta.valuewhen(wave_trend == 1, close, 0)
wave4 := ta.valuewhen(wave_trend == -1, close, 0)
wave5 := ta.valuewhen(wave_trend == 1, close, 0)

fibonacciRetracement(level, waveStart, waveEnd) =>
    waveStart + (waveEnd - waveStart) * level

wave2Fib = fibonacciRetracement(0.618, wave1, wave2)
wave4Fib = fibonacciRetracement(0.382, wave3, wave4)

plot(wave1, title="Wave 1", color=color.blue, linewidth=2)
plot(wave2, title="Wave 2", color=color.blue, linewidth=2)
plot(wave3, title="Wave 3", color=color.blue, linewidth=2)
plot(wave4, title="Wave 4", color=color.blue, linewidth=2)
plot(wave5, title="Wave 5", color=color.blue, linewidth=2)

plot(wave2Fib, title="Wave 2 Fib", color=color.yellow, linewidth=2)
plot(wave4Fib, title="Wave 4 Fib", color=color.yellow, linewidth=2)

// Strategy Conditions
if (tdUpCount == td_length * 3 and not na(wave5))
    strategy.entry("Buy", strategy.long)

if (tdDownCount == td_length * 3 and not na(wave5))
    strategy.entry("Sell", strategy.short)

// Stop Loss and Take Profit
strategy.exit("Take Profit/Stop Loss", from_entry="Buy", limit=wave3, stop=wave1)
strategy.exit("Take Profit/Stop Loss", from_entry="Sell", limit=wave2, stop=wave4)
Detail
https://www.fmz.com/strategy/458245
Last Modified
2024-07-31 11:38:39