
8.9 KiB
Name
基于移动平均线和Outside-Bar模式的双重趋势确认交易策略-Dual-Trend-Confirmation-Trading-Strategy-Based-on-Moving-Averages-and-Outside-Bar-Pattern
Author
ChaoZhang
Strategy Description
[trans]
概述
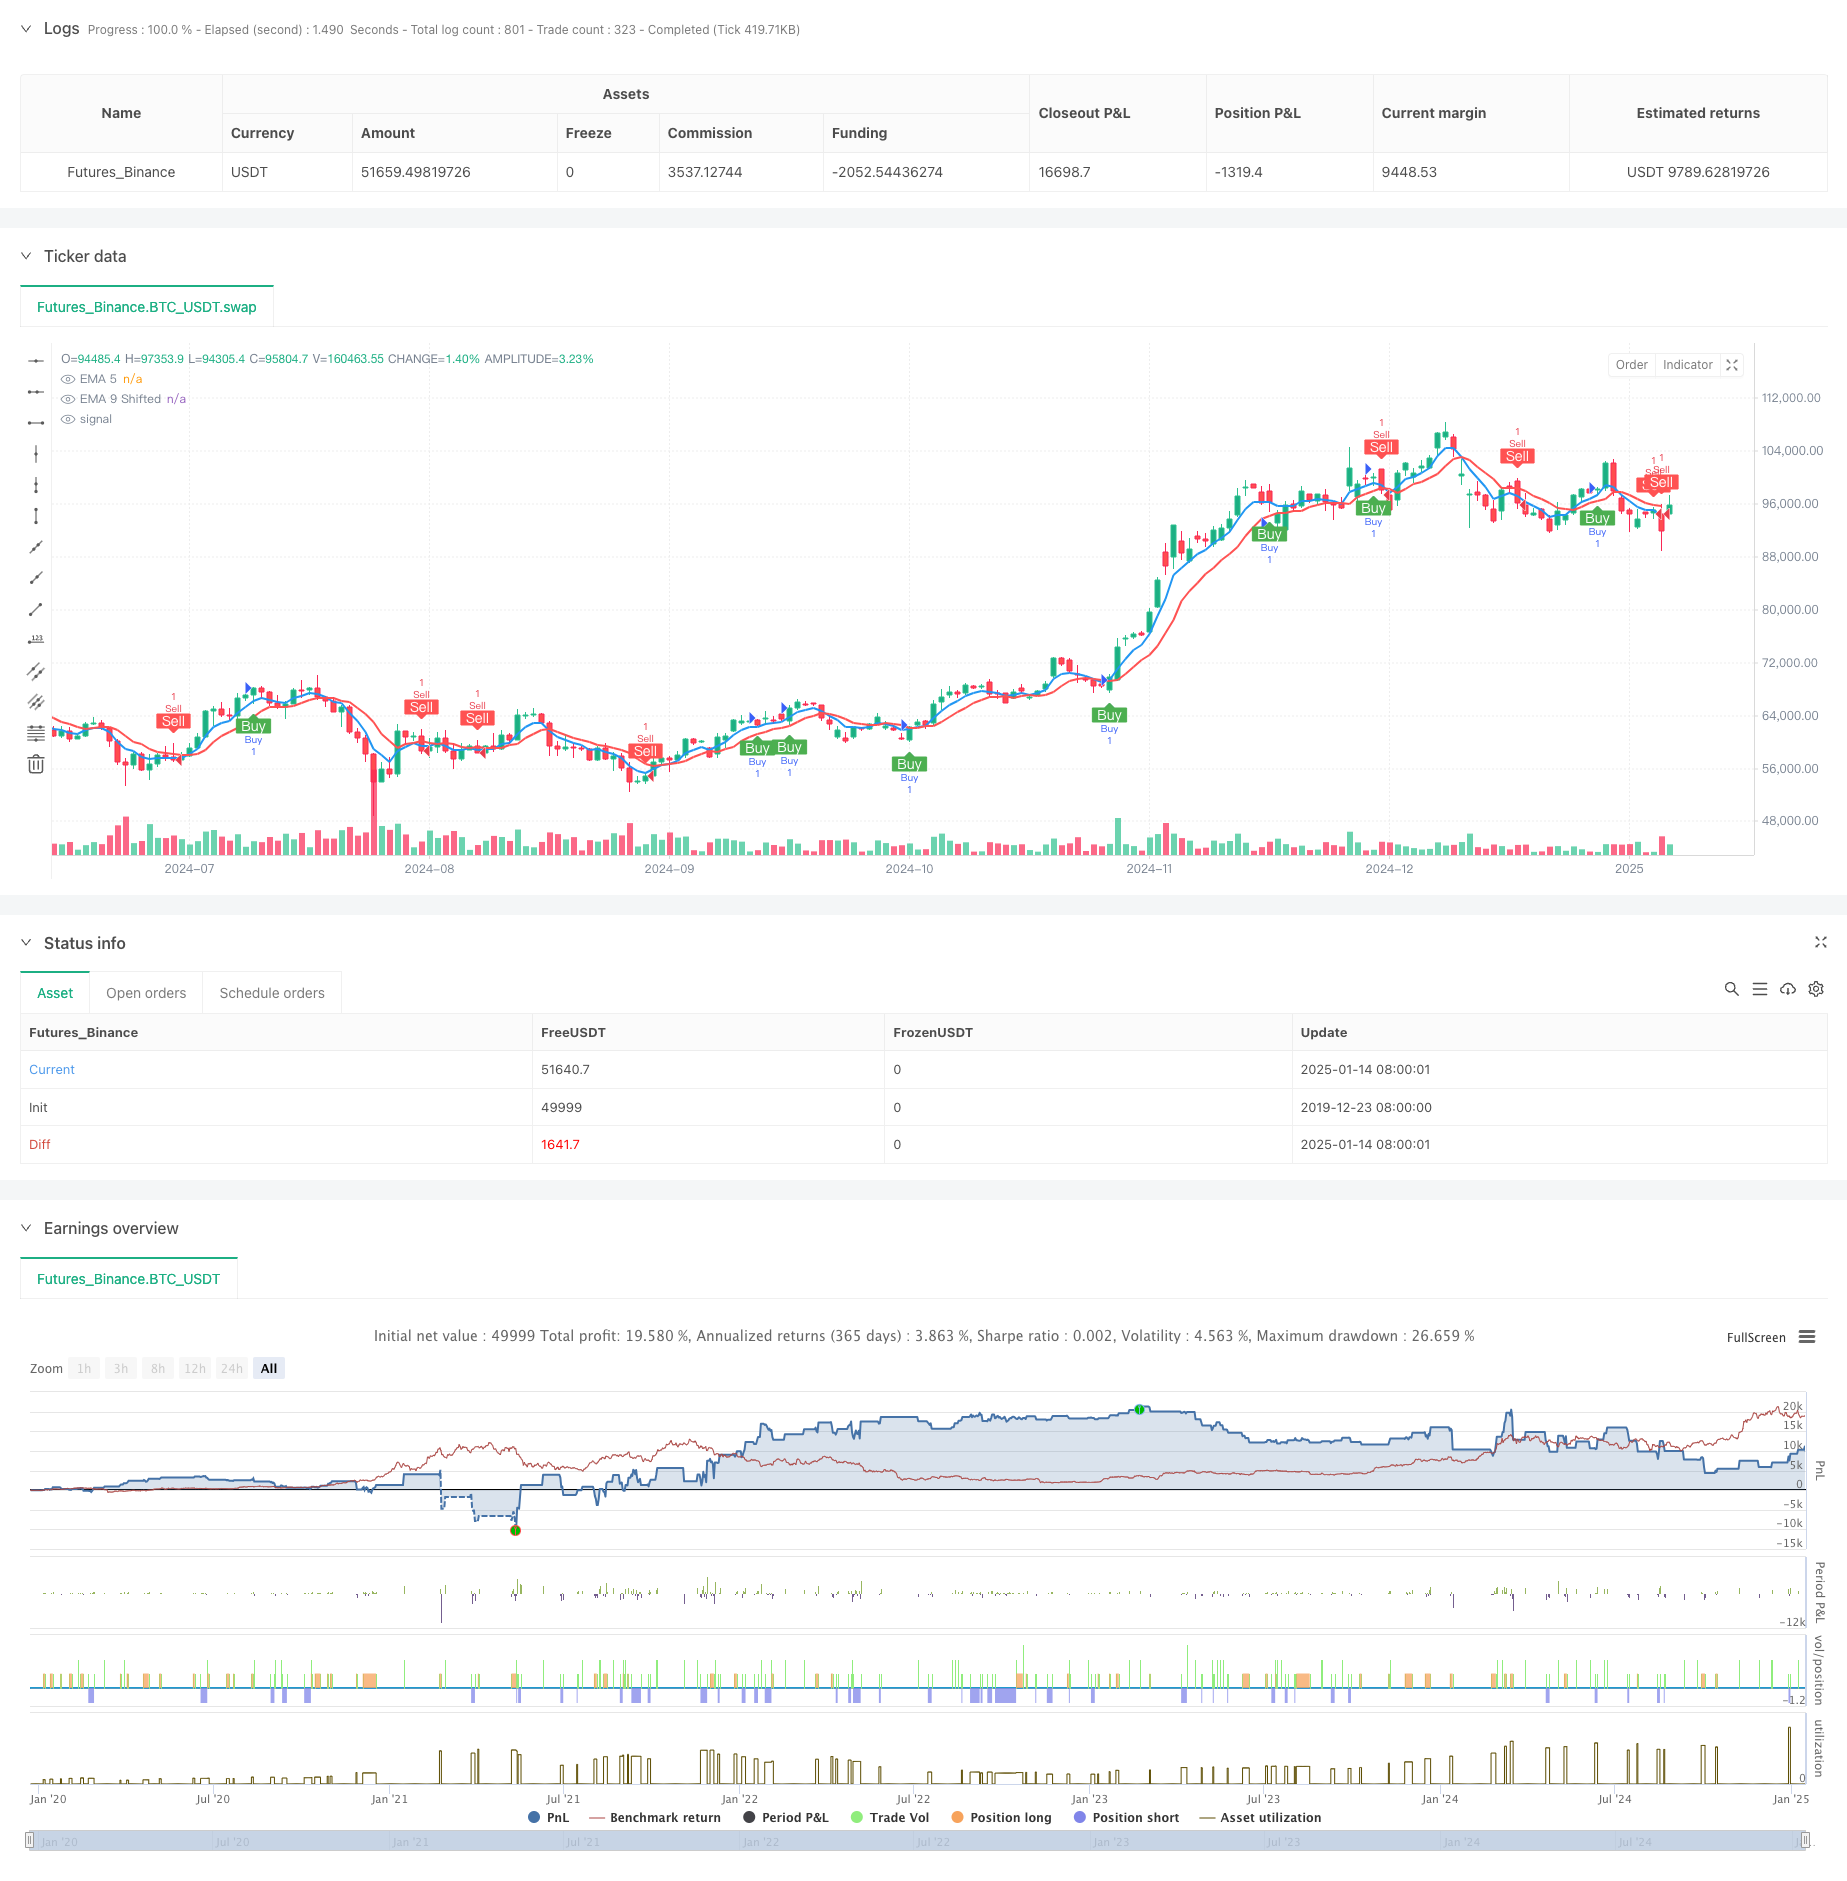
该策略是一个结合了移动平均线和Outside Bar形态的趋势跟踪系统。它使用了5周期和9周期的指数移动平均线(EMA)作为主要趋势指标,同时结合Outside Bar形态作为信号确认。策略还包含了基于Outside Bar高度的动态止损止盈设置,以及在止损触发后的仓位反转机制。
策略原理
策略的核心逻辑基于以下几个关键要素:
- 使用5周期和9周期EMA的交叉来确定基本趋势方向
- 通过Outside Bar形态(当前K线的最高价高于前一根K线的最高价,最低价低于前一根K线的最低价)来确认市场波动性
- 在EMA交叉信号和Outside Bar形态同时出现时进场交易
- 使用Outside Bar的高度来动态设置止损和止盈水平,止盈设为Outside Bar高度的50%,止损设为100%
- 当止损被触发时,自动执行反向仓位建立,以捕捉可能的趋势反转
策略优势
- 双重确认机制提高了交易的准确性,避免了单一指标可能带来的虚假信号
- 动态的止损止盈设置更好地适应市场波动性,在不同市场环境下都能保持合理的风险管理
- 仓位反转机制能够快速适应市场趋势的变化,提高资金利用效率
- 策略具有清晰的进出场规则,易于执行和回测
策略风险
- Outside Bar形态可能在波动较小的市场中较少出现,影响交易频率
- 在快速波动的市场中,止损位置可能过宽,增加单次交易的风险
- 仓位反转机制在震荡市场中可能导致连续止损
- EMA参数固定可能在不同市场环境下表现不一致
策略优化方向
- 可以引入波动率指标来动态调整止损止盈比例,使风险管理更加灵活
- 考虑添加趋势强度过滤器,在弱趋势环境下避免交易
- 优化仓位反转的触发条件,可以结合市场波动性指标来决定是否执行反转
- 研究不同时间周期的EMA参数优化方案,提高系统适应性
总结
这是一个结合了技术分析经典理论和现代量化交易理念的策略系统。通过移动平均线和Outside Bar的配合使用,既保证了趋势跟踪的及时性,又提高了信号的可靠性。动态止损止盈和仓位反转机制的设计体现了对风险管理的重视,使策略具有良好的实用性。虽然仍有优化空间,但整体框架已经具备了实盘操作的基本条件。 ||
Overview
This strategy is a trend following system that combines moving averages with Outside Bar pattern recognition. It utilizes 5-period and 9-period Exponential Moving Averages (EMA) as primary trend indicators, along with Outside Bar pattern for signal confirmation. The strategy includes dynamic stop-loss and take-profit settings based on Outside Bar height, as well as a position reversal mechanism triggered by stop-loss hits.
Strategy Principles
The core logic is based on the following key elements:
- Using 5-period and 9-period EMA crossovers to determine basic trend direction
- Confirming market volatility through Outside Bar pattern (current bar's high above previous bar's high and low below previous bar's low)
- Entering trades when EMA crossover signals coincide with Outside Bar patterns
- Using Outside Bar height to dynamically set stop-loss and take-profit levels, with take-profit at 50% and stop-loss at 100% of the bar height
- Automatically executing reverse positions when stop-loss is triggered to capture potential trend reversals
Strategy Advantages
- Dual confirmation mechanism improves trading accuracy by avoiding false signals from single indicators
- Dynamic stop-loss and take-profit settings better adapt to market volatility, maintaining reasonable risk management across different market conditions
- Position reversal mechanism quickly adapts to market trend changes, improving capital efficiency
- Strategy has clear entry and exit rules, making it easy to implement and backtest
Strategy Risks
- Outside Bar patterns may occur less frequently in low-volatility markets, affecting trading frequency
- Stop-loss positions may be too wide in rapidly volatile markets, increasing per-trade risk
- Position reversal mechanism may lead to consecutive losses in ranging markets
- Fixed EMA parameters may perform inconsistently across different market conditions
Optimization Directions
- Introduce volatility indicators to dynamically adjust stop-loss and take-profit ratios for more flexible risk management
- Consider adding trend strength filters to avoid trading in weak trend environments
- Optimize position reversal trigger conditions by incorporating market volatility indicators
- Research EMA parameter optimization across different timeframes to improve system adaptability
Summary
This is a strategy system that combines classical technical analysis with modern quantitative trading concepts. The combination of moving averages and Outside Bar patterns ensures both timely trend following and reliable signal generation. The design of dynamic stop-loss/take-profit and position reversal mechanisms demonstrates a strong focus on risk management, making the strategy practically viable. While there is room for optimization, the overall framework already meets basic conditions for live trading.[/trans]
Source (PineScript)
/*backtest
start: 2019-12-23 08:00:00
end: 2025-01-15 08:00:00
period: 1d
basePeriod: 1d
exchanges: [{"eid":"Futures_Binance","currency":"BTC_USDT","balance":49999}]
*/

//@version=5
strategy(title="Outside Bar EMA Crossover Strategy with EMA Shift", shorttitle="Outside Bar EMA Cross", overlay=true)

// Input for EMA lengths
lenEMA1 = input.int(5, title="EMA 5 Length")
lenEMA2 = input.int(9, title="EMA 9 Length")

// Input for EMA 9 shift
emaShift = input.int(1, title="EMA 9 Shift", minval=0)

// Calculate EMAs
ema1 = ta.ema(close, lenEMA1)
ema2 = ta.ema(close, lenEMA2)

// Apply shift to EMA 9
ema2Shifted = na(ema2[emaShift]) ? na : ema2[emaShift]  // Dịch chuyển EMA 9 bằng cách sử dụng offset

// Plot EMAs
plot(ema1, title="EMA 5", color=color.blue, linewidth=2)
plot(ema2Shifted, title="EMA 9 Shifted", color=color.red, linewidth=2)

// Outside Bar condition
outsideBar() => high > high[1] and low < low[1]

// Cross above EMA 5 and EMA 9 (shifted)
crossAboveEMA = close > ema1 and close > ema2Shifted

// Cross below EMA 5 and EMA 9 (shifted)
crossBelowEMA = close < ema1 and close < ema2Shifted

// Outside Bar cross above EMA 5 and EMA 9 (shifted)
outsideBarCrossAbove = outsideBar() and crossAboveEMA

// Outside Bar cross below EMA 5 and EMA 9 (shifted)
outsideBarCrossBelow = outsideBar() and crossBelowEMA

// Plot shapes for visual signals
plotshape(series=outsideBarCrossAbove, title="Outside Bar Cross Above", location=location.belowbar, color=color.green, style=shape.labelup, text="Buy", textcolor=color.white)
plotshape(series=outsideBarCrossBelow, title="Outside Bar Cross Below", location=location.abovebar, color=color.red, style=shape.labeldown, text="Sell", textcolor=color.white)

// Calculate Outside Bar height
outsideBarHeight = high - low  // Chiều cao của nến Outside Bar

// Calculate TP and SL levels
tpRatio = 0.5  // TP = 50% chiều cao nến Outside Bar
slRatio = 1.0  // SL = 100% chiều cao nến Outside Bar

tpLevelLong = close + outsideBarHeight * tpRatio  // TP cho lệnh mua
slLevelLong = close - outsideBarHeight * slRatio  // SL cho lệnh mua

tpLevelShort = close - outsideBarHeight * tpRatio  // TP cho lệnh bán
slLevelShort = close + outsideBarHeight * slRatio  // SL cho lệnh bán

// Strategy logic
if (outsideBarCrossAbove)
    strategy.entry("Buy", strategy.long)
    strategy.exit("Take Profit/Stop Loss", "Buy", stop=slLevelLong, limit=tpLevelLong)  // Thêm TP và SL

if (outsideBarCrossBelow)
    strategy.entry("Sell", strategy.short)
    strategy.exit("Take Profit/Stop Loss", "Sell", stop=slLevelShort, limit=tpLevelShort)  // Thêm TP và SL

// Logic: Nếu lệnh Buy bị Stop Loss => Vào lệnh Sell
if (strategy.position_size > 0 and close <= slLevelLong)
    strategy.close("Buy")
    strategy.entry("Sell After Buy SL", strategy.short)

// Logic: Nếu lệnh Sell bị Stop Loss => Vào lệnh Buy
if (strategy.position_size < 0 and close >= slLevelShort)
    strategy.close("Sell")
    strategy.entry("Buy After Sell SL", strategy.long)

// Cảnh báo khi label Buy xuất hiện
alertcondition(condition=outsideBarCrossAbove, title="Label Buy Xuất Hiện", message="Label Buy xuất hiện tại giá: {{close}}")

// Cảnh báo khi label Sell xuất hiện
alertcondition(condition=outsideBarCrossBelow, title="Label Sell Xuất Hiện", message="Label Sell xuất hiện tại giá: {{close}}")
Detail
https://www.fmz.com/strategy/478695
Last Modified
2025-01-17 14:39:19