
8.9 KiB
Name
基于相对强弱指数RSI与止损的多头量化交易策略RSI-based-Long-Strategy-with-Trailing-Stop-for-Quantitative-Trading
Author
ChaoZhang
Strategy Description
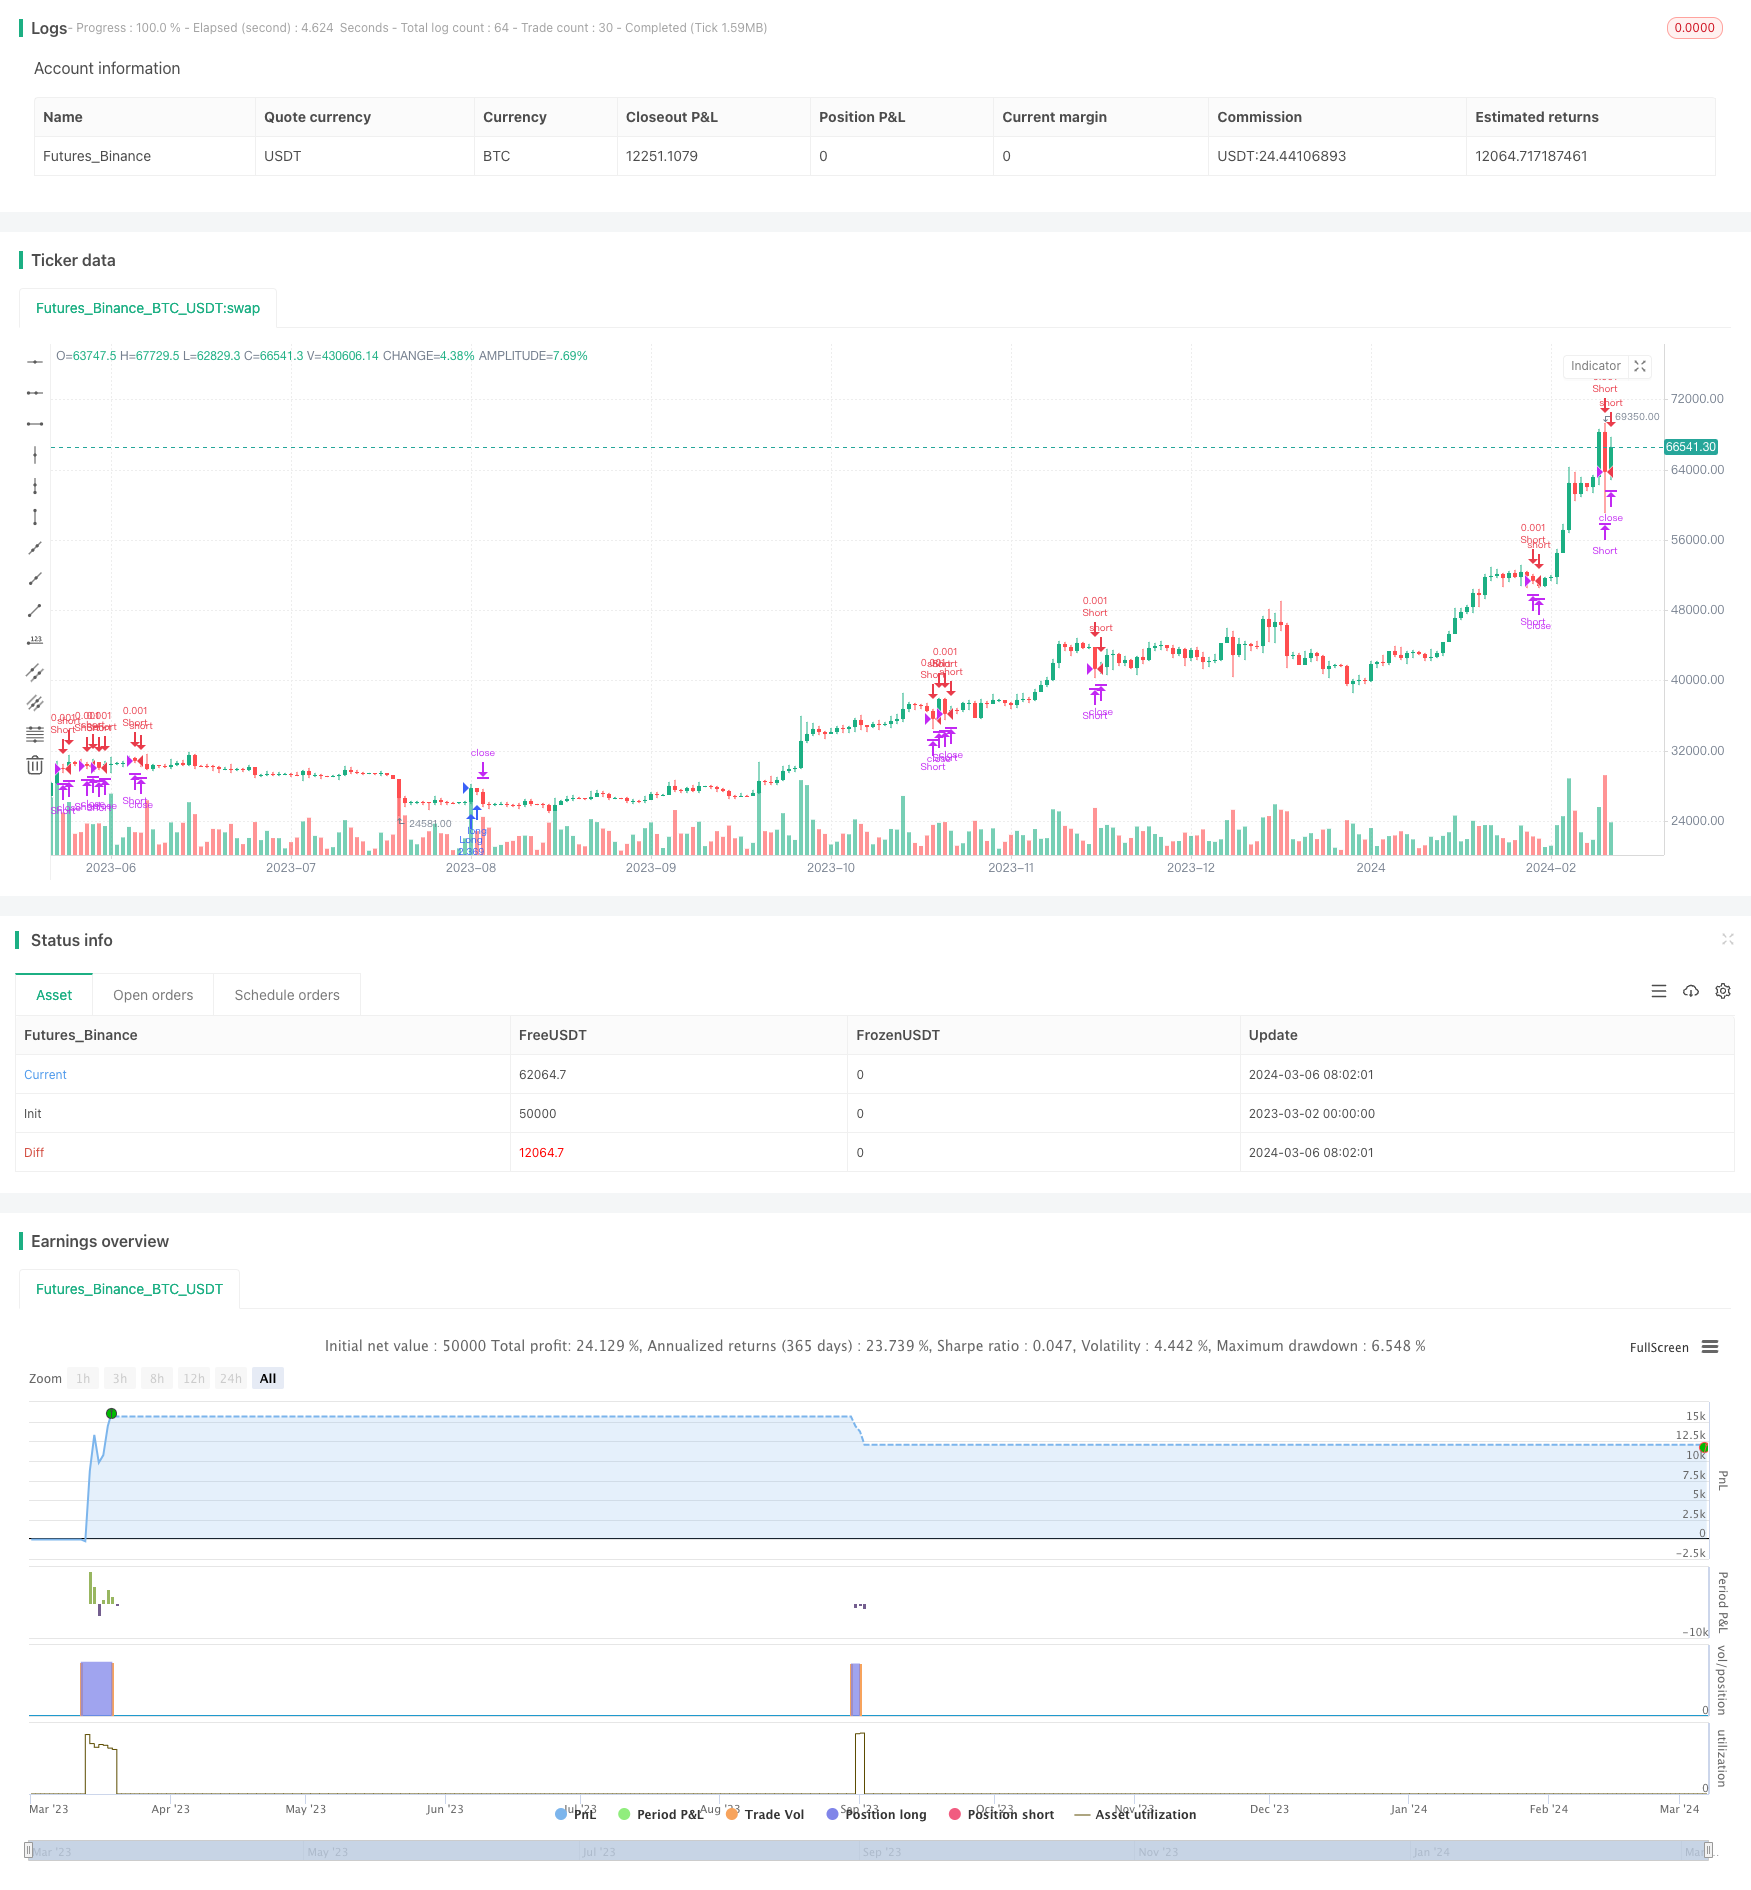 [trans]
概述
本文介绍了一种基于相对强弱指数(RSI)与止损的多头量化交易策略。该策略利用RSI指标判断市场超卖和超买状态,在超卖时开多头仓位,超买时平仓。同时,策略采用百分比止损来控制风险。这是一个经典的趋势追踪策略,旨在捕捉强势市场中的上涨趋势。
策略原理
该策略的核心是相对强弱指数(RSI)。RSI是一个动量振荡指标,用来衡量一段时间内价格的变化幅度。其计算公式为:
RS = N天内上涨幅度的平均值 / N天内下跌幅度的平均值
RSI = 100 - 100 / (1 + RS)
其中,N为计算RSI的时间周期,通常取14。
策略的逻辑如下:
- 计算N周期的RSI。
- 当RSI从下向上突破超卖水平(如30)时,开多头仓位。
- 当RSI从上向下突破超买水平(如70)时,平掉多头仓位。
- 在开仓时,根据当前价格和设定的百分比,计算出止损价格。
- 如果价格触及止损价格,则平掉多头仓位,控制损失。
该策略试图在市场由熊转牛初期开仓,牛市末期平仓,以捕捉主要上涨趋势。
优势分析
- 简单易用:该策略只使用了一个技术指标RSI,逻辑清晰,适合初学者学习和使用。
- 趋势追踪:策略在超卖区开仓,超买区平仓,符合"低买高卖"的趋势投资理念,可以有效捕捉牛市上涨趋势。
- 风险控制:百分比止损可以帮助投资者控制每笔交易的风险敞口,将损失限制在可接受范围内。
风险分析
- 振荡市亏损:RSI是一个滞后指标,在震荡市会发出较多错误信号,导致频繁开平仓,积小损成大损。
- 止损位设置不当:若止损位设置过宽,单次损失较大;若止损位设置过窄,会过早止损,错失后续趋势。
- 仓位管理欠缺:策略缺乏对仓位的动态调整机制,风险敞口控制不够灵活。
优化方向
- 趋势过滤:在使用RSI信号前,先通过长期均线或其他趋势指标判断大趋势,只在大趋势向上时使用RSI多头信号。
- 止损优化:可以考虑使用移动止损或ATR等更高级的止损策略,动态调整止损位置,使其更贴合市场节奏。
- 仓位管理:根据市场波动性、趋势强度等因素,动态调整每笔交易的仓位大小,以更好地控制风险。
- 多空对冲:在使用多头策略的同时,引入空头策略进行对冲,降低策略的整体风险敞口。
总结
本文介绍了一个基于RSI与止损的多头量化交易策略。该策略利用RSI超卖超买信号开平仓,同时使用百分比止损控制风险。这是一个简单实用的趋势追踪策略,适合初学者学习。但其也存在一些局限性,如震荡市表现不佳,止损和仓位管理欠缺灵活性等。针对这些不足,我们可以从趋势过滤、动态止损、仓位管理、多空对冲等方面对策略进行优化,以期获得更稳健的收益。量化交易策略的开发是一个不断优化迭代的过程,需要投资者在实践中不断总结经验,调整完善。
||
Overview
This article introduces a quantitative trading strategy for going long based on the Relative Strength Index (RSI) and trailing stop. The strategy uses the RSI indicator to determine overbought and oversold market conditions, entering long positions when the market is oversold and closing positions when it is overbought. At the same time, the strategy employs a percentage-based trailing stop to control risk. This is a classic trend-following strategy designed to capture uptrends in strong markets.
Strategy Principles
The core of this strategy is the Relative Strength Index (RSI). RSI is a momentum oscillator used to measure the magnitude of price changes over a period of time. Its calculation formula is:
RS = Average gain over N days / Average loss over N days
RSI = 100 - 100 / (1 + RS)
where N is the time period for calculating RSI, usually set to 14.
The strategy logic is as follows:
- Calculate the N-period RSI.
- When RSI crosses above the oversold level (e.g., 30) from below, enter a long position.
- When RSI crosses below the overbought level (e.g., 70) from above, close the long position.
- Upon entry, calculate the stop loss price based on the current price and the set percentage.
- If the price reaches the stop loss price, close the long position to control losses.
The strategy attempts to enter positions at the beginning of a market transition from bearish to bullish, and exit at the end of a bull market, in order to capture the main uptrend.
Advantage Analysis
- Simplicity: The strategy only uses one technical indicator, RSI, with clear logic, making it suitable for beginners to learn and use.
- Trend following: The strategy enters positions in the oversold zone and exits in the overbought zone, adhering to the "buy low, sell high" principle of trend investing, effectively capturing bull market uptrends.
- Risk control: The percentage-based trailing stop helps investors control the risk exposure of each trade, limiting losses to an acceptable range.
Risk Analysis
- Losses in range-bound markets: RSI is a lagging indicator and may generate many false signals in range-bound markets, leading to frequent entries and exits that accumulate small losses into large ones.
- Improper stop loss setting: If the stop loss is set too wide, the loss per trade will be large; if it is set too narrow, the strategy will stop out too early and miss subsequent trends.
- Lack of position management: The strategy lacks a mechanism for dynamically adjusting positions, resulting in inflexible risk exposure control.
Optimization Directions
- Trend filtering: Before using RSI signals, first determine the long-term trend using moving averages or other trend indicators, and only use RSI long signals when the major trend is up.
- Stop loss optimization: Consider using trailing stops or more advanced stop loss strategies such as ATR to dynamically adjust stop loss positions to better fit market rhythm.
- Position management: Dynamically adjust the size of each trade based on factors such as market volatility and trend strength to better control risk.
- Long-short hedging: While using the long strategy, introduce a short strategy for hedging to reduce the overall risk exposure of the strategy.
Conclusion
This article presented a quantitative trading strategy for going long based on RSI and trailing stops. The strategy uses RSI overbought and oversold signals to enter and exit positions, while using percentage-based trailing stops to control risk. This is a simple and practical trend-following strategy suitable for beginners to learn. However, it also has some limitations, such as poor performance in range-bound markets and lack of flexibility in stop loss and position management. To address these shortcomings, we can optimize the strategy in aspects such as trend filtering, dynamic stop loss, position management, and long-short hedging, in order to obtain more robust returns. The development of quantitative trading strategies is a process of continuous optimization and iteration, requiring investors to constantly summarize experiences and refine the strategy in practice. [/trans]
Strategy Arguments
| Argument | Default | Description |
|---|---|---|
| v_input_1 | 14 | length |
| v_input_2 | 30 | overSold |
| v_input_3 | 70 | overBought |
| v_input_4 | 5 | percent_diff |
Source (PineScript)
/*backtest
start: 2023-03-02 00:00:00
end: 2024-03-07 00:00:00
period: 1d
basePeriod: 1h
exchanges: [{"eid":"Futures_Binance","currency":"BTC_USDT"}]
*/

//@version=5
strategy("RSI Strategy (Long)", overlay=true, initial_capital=1000, default_qty_type=strategy.percent_of_equity, default_qty_value=100)
length = input( 14 )
overSold = input( 30 )
overBought = input( 70 )
price = close
vrsi = ta.rsi(price, length)
co = ta.crossover(vrsi, overSold)
cu = ta.crossunder(vrsi, overBought)

// *** Signals ***
enter_long = ta.crossover(vrsi, overSold)
enter_short = ta.crossunder(vrsi, overBought)
close_long = ta.crossunder(vrsi, overBought)
close_short = ta.crossunder(vrsi, overBought)


// *** Risk management ***
entry_price = close
percent_diff = input(5)
stop_loss_price_long = (1 - percent_diff / 100.) * entry_price
stop_loss_price_short = (1 + percent_diff / 100.) * entry_price


// *** Positions ***
if enter_long and strategy.position_size == 0
    strategy.entry("Long", strategy.long)
    strategy.exit("SL Long", "Long", stop = stop_loss_price_long)

if enter_short and strategy.position_size == 0
    strategy.entry("Short", strategy.short, qty=.001)
    strategy.exit("SL short", "Short", stop = stop_loss_price_short)

if close_long
    strategy.close("Long", "Exit Long")

if close_short
    strategy.close("Short", "Exit Short")
Detail
https://www.fmz.com/strategy/444004
Last Modified
2024-03-08 15:06:58