
7.9 KiB
Name
基于相对强弱指数的超买超卖自动化交易策略-Automated-Trading-Strategy-Based-on-RSI-Overbought-and-Oversold-Levels
Author
ChaoZhang
Strategy Description
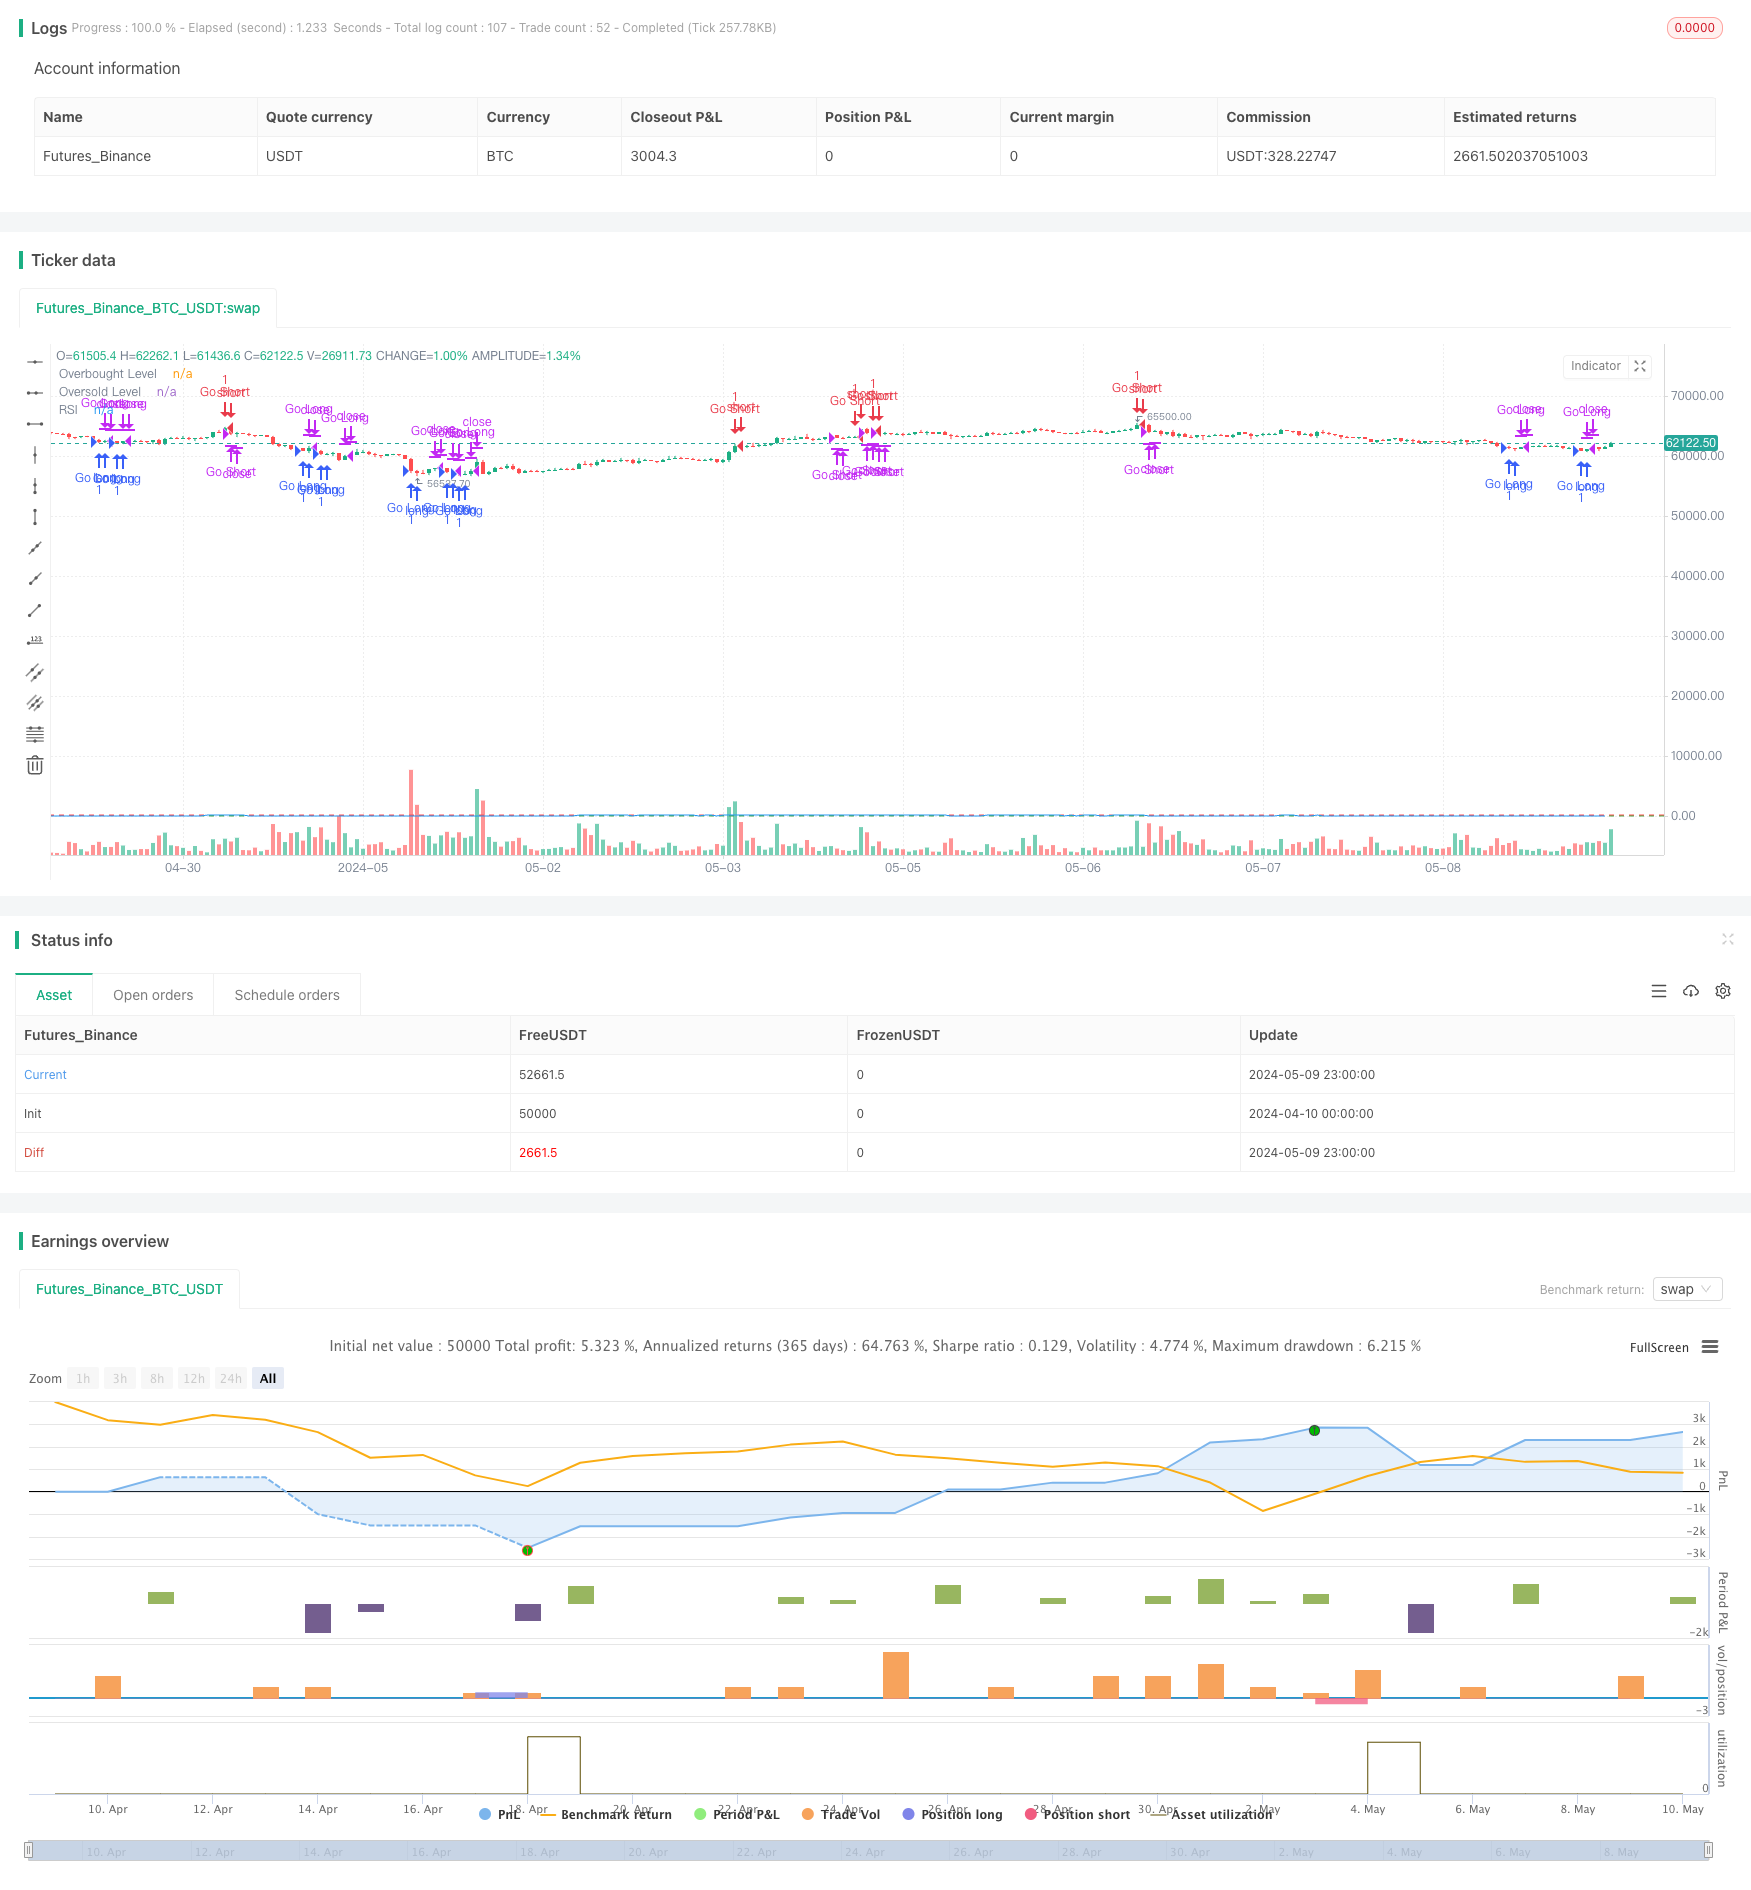
[trans]
概述
该策略基于相对强弱指数(RSI)的超买和超卖水平来自动化执行交易。当RSI低于用户设定的超卖水平时开仓做多,当RSI高于用户设定的超买水平时开仓做空。持仓一定时间后自动平仓。所有参数都可由用户自行设置,包括RSI周期、超买和超卖水平以及持仓时间。
策略原理
相对强弱指数(RSI)是一个动量指标,用于衡量近期价格变化的幅度。它的取值范围在0到100之间。传统的解释认为,RSI高于70表示超买,低于30表示超卖。该策略利用这一原理,在RSI超卖时买入,超买时卖出,试图捕捉价格的短期反转。同时,为了控制风险,策略在持仓一定时间后自动平仓。
策略优势
-
简单易懂:该策略基于经典的技术分析指标RSI,逻辑清晰明了,易于理解和实施。
-
参数灵活:用户可以根据自己的偏好和市场特点,灵活设置RSI周期、超买超卖阈值以及持仓时间等参数。
-
自动化程度高:策略可以自动监测RSI水平,执行开仓和平仓操作,减少了人为干预和情绪影响。
-
适应性强:通过调整参数,该策略可以适用于不同的市场环境和交易品种。
策略风险
-
参数优化难度大:不同市场环境下的最优参数组合可能差异很大,寻找合适的参数需要大量的回测和分析工作。
-
市场趋势风险:当市场出现强劲的单边趋势时,该策略可能会频繁交易而导致亏损。
-
假信号风险:RSI可能产生假信号,导致策略进行错误的交易。
-
黑天鹅事件:策略对极端行情的适应性有限,面对黑天鹅事件可能承受较大损失。
策略优化方向
-
结合其他指标:仅依靠RSI可能不够稳健,可以考虑结合其他技术指标如移动平均线、MACD等,提高信号的可靠性。
-
引入止损和止盈:在策略中加入止损和止盈机制,以更好地控制单笔交易的风险和收益。
-
动态调整参数:根据市场状况的变化,动态调整RSI周期、超买超卖阈值等参数,使策略更具适应性。
-
市场状态过滤:根据市场波动性、趋势强度等指标,过滤掉不适合交易的市场状态,提高策略的稳健性。
总结
该策略利用RSI指标的超买超卖原理,构建了一个简单易懂的自动化交易系统。用户可以灵活设置各项参数,策略会自动执行交易。但是,策略也存在参数优化难度大、趋势风险和假信号风险等问题。未来可以考虑引入其他指标、止损止盈机制、动态参数调整和市场状态过滤等优化手段,以提升策略的稳健性和盈利能力。
||
Overview
This strategy automatically executes trades based on the overbought and oversold levels of the Relative Strength Index (RSI). It goes long when RSI is below the user-defined oversold level and goes short when RSI is above the user-defined overbought level. Positions are automatically closed after a certain holding period. All parameters can be set by the user, including the RSI period, overbought and oversold levels, and holding time.
Strategy Principles
The Relative Strength Index (RSI) is a momentum indicator that measures the magnitude of recent price changes. It ranges from 0 to 100. Traditionally, an RSI above 70 is considered overbought, and below 30 is considered oversold. This strategy utilizes these principles, buying when RSI is oversold and selling when it is overbought, attempting to capture short-term price reversals. To control risk, the strategy automatically closes positions after a certain holding period.
Strategy Advantages
-
Simplicity: The strategy is based on the classic RSI technical indicator, with a clear and easy-to-understand logic, making it simple to implement.
-
Parameter flexibility: Users can flexibly set parameters such as the RSI period, overbought and oversold thresholds, and holding time according to their preferences and market characteristics.
-
High degree of automation: The strategy can automatically monitor RSI levels and execute opening and closing trades, reducing human intervention and emotional influence.
-
Adaptability: By adjusting parameters, the strategy can be applied to different market environments and trading instruments.
Strategy Risks
-
Parameter optimization difficulty: The optimal parameter combination may vary greatly under different market conditions, requiring extensive backtesting and analysis to find suitable parameters.
-
Market trend risk: When the market exhibits a strong unilateral trend, the strategy may frequently trade and lead to losses.
-
False signal risk: RSI may generate false signals, causing the strategy to make incorrect trades.
-
Black swan events: The strategy has limited adaptability to extreme market conditions and may suffer significant losses in the face of black swan events.
Strategy Optimization Directions
-
Combining with other indicators: Relying solely on RSI may not be robust enough. Consider combining with other technical indicators such as moving averages or MACD to improve signal reliability.
-
Introducing stop-loss and take-profit: Incorporate stop-loss and take-profit mechanisms into the strategy to better control the risk and return of individual trades.
-
Dynamic parameter adjustment: Dynamically adjust parameters such as the RSI period and overbought/oversold thresholds based on changes in market conditions to make the strategy more adaptive.
-
Market state filtering: Filter out unfavorable market states for trading based on indicators such as market volatility and trend strength to improve the strategy's robustness.
Summary
This strategy utilizes the overbought and oversold principles of the RSI indicator to construct a simple and easy-to-understand automated trading system. Users can flexibly set various parameters, and the strategy automatically executes trades. However, the strategy also faces issues such as difficulty in parameter optimization, trend risk, and false signal risk. In the future, optimization measures such as introducing other indicators, stop-loss and take-profit mechanisms, dynamic parameter adjustment, and market state filtering can be considered to enhance the strategy's robustness and profitability. [/trans]
Source (PineScript)
/*backtest
start: 2024-04-10 00:00:00
end: 2024-05-10 00:00:00
period: 1h
basePeriod: 15m
exchanges: [{"eid":"Futures_Binance","currency":"BTC_USDT"}]
*/

//@version=5
strategy("Dougie Trades RSI Strategy V1", overlay=true)

// Inputs for strategy
rsiPeriod = input.int(14, title="RSI Period")
overbought = input.int(70, title="Overbought Level", minval=0, maxval=100)
oversold = input.int(30, title="Oversold Level", minval=0, maxval=100)
exitAfterMinutes = input.int(60, title="Exit After X Minutes", minval=1)

// Calculate RSI
rsi = ta.rsi(close, rsiPeriod)

// Define long and short conditions based on RSI
longCondition = rsi < oversold
shortCondition = rsi > overbought

var float entryTime = na

// Execute trades and track entry time
if (longCondition)
    strategy.entry("Go Long", strategy.long)
    entryTime := time
if (shortCondition)
    strategy.entry("Go Short", strategy.short)
    entryTime := time

// Exit logic after 'x' minutes
if (not na(entryTime) and (time - entryTime) / 60000 >= exitAfterMinutes)
    strategy.close("Go Long")
    strategy.close("Go Short")
    entryTime := na  // Reset entry time after exit

// Plotting RSI and thresholds
plot(rsi, title="RSI", color=color.blue)
hline(overbought, "Overbought Level", color=color.red)
hline(oversold, "Oversold Level", color=color.green)
Detail
https://www.fmz.com/strategy/451029
Last Modified
2024-05-11 11:57:20