
8.3 KiB
Name
基于波动率和回归线的多空市场机制优化策略-Volatility-and-Linear-Regression-based-Long-Short-Market-Regime-Optimization-Strategy
Author
ChaoZhang
Strategy Description
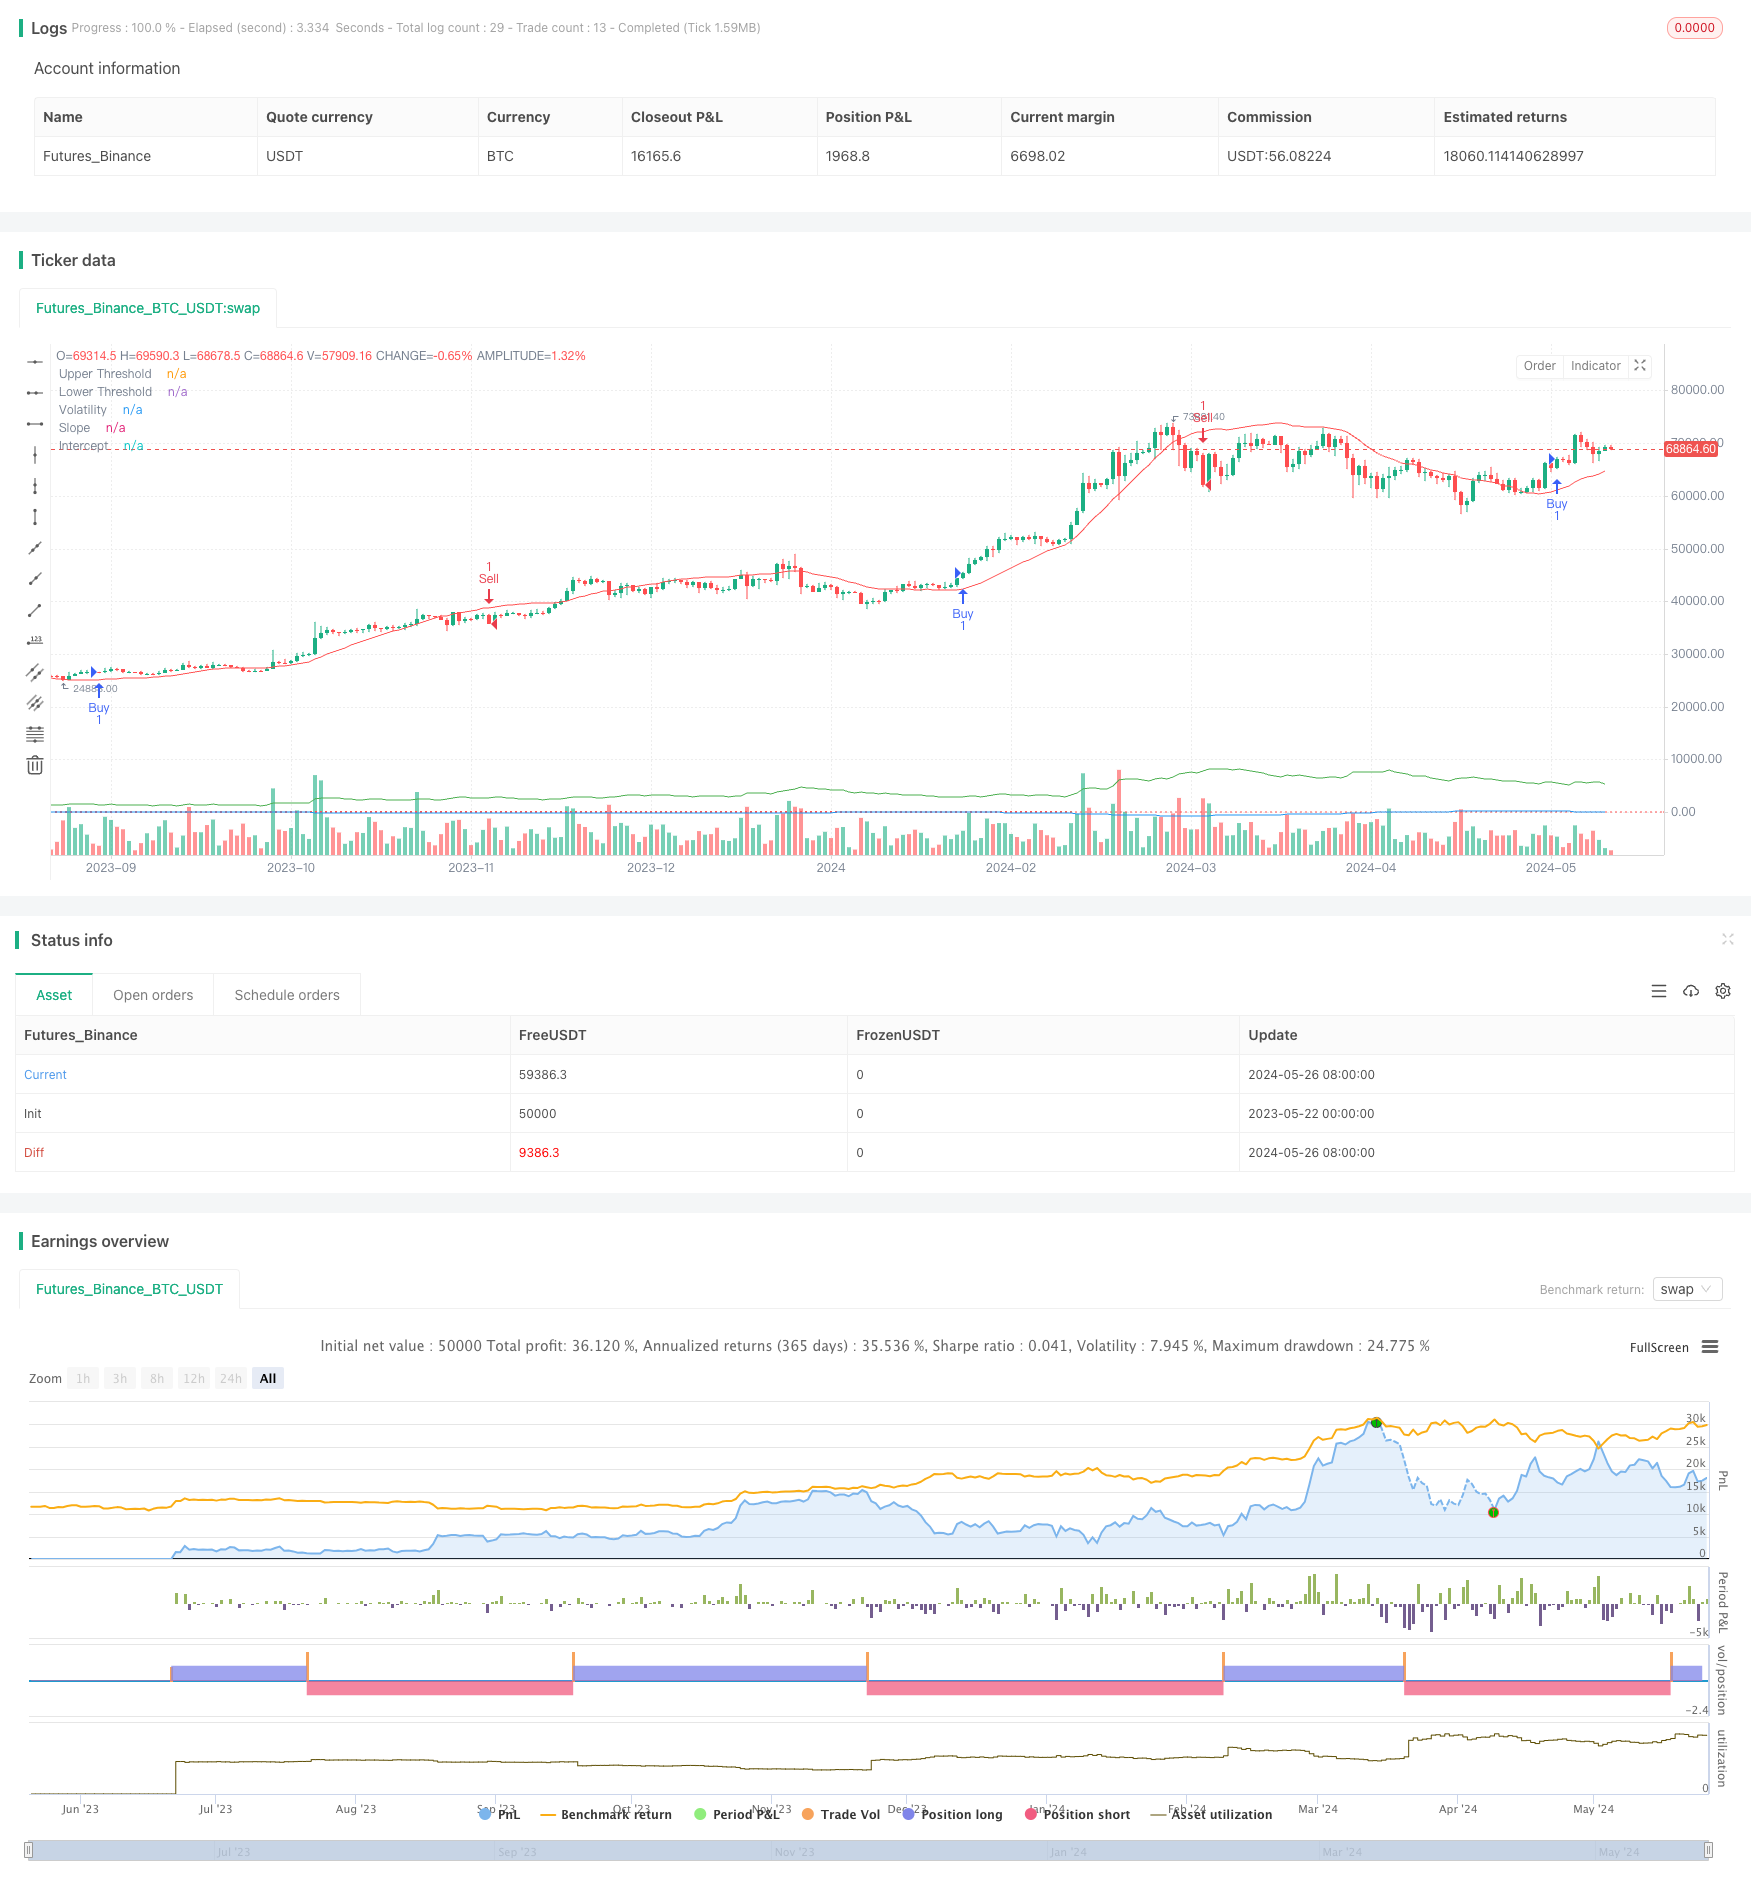
[trans]
概述
该策略利用线性回归和波动率指标来识别不同的市场状态,当满足买入或卖出条件时,策略会建立相应的多头或空头仓位。同时,该策略允许根据市场状况进行参数优化和调整,以适应不同的市场环境。策略还使用指数移动平均线作为附加指标来确认交易信号。
策略原理
- 计算线性回归的截距和斜率,用于确定市场趋势。
- 计算平均真实波动率(ATR)乘以乘数作为波动率指标。
- 当斜率大于上阈值且价格高于回归线加上波动率时,产生买入信号。
- 当斜率小于下阈值且价格低于回归线减去波动率时,产生卖出信号。
- 使用快速和慢速指数移动平均线(EMA)作为附加确认指标。
- 当买入信号出现且快速EMA高于慢速EMA时,建立多头仓位。
- 当卖出信号出现且快速EMA低于慢速EMA时,建立空头仓位。
策略优势
- 结合线性回归和波动率指标,可以更准确地识别市场状态和趋势。
- 使用附加的EMA指标来确认交易信号,提高策略的可靠性。
- 允许对关键参数进行优化,以适应不同的市场环境和品种特性。
- 同时考虑趋势和波动性,可以在趋势明确时及时建仓,在波动加剧时控制风险。
策略风险
- 参数选择不当可能导致策略表现不佳,需要根据具体品种和市场特点进行优化。
- 在震荡市场或趋势转折点,策略可能会出现频繁交易或错误信号。
- 策略依赖于历史数据,对于突发事件或市场异常波动可能反应不及时。
策略优化方向
- 引入其他技术指标或基本面因素,丰富策略的决策依据,提高信号准确性。
- 优化参数选择,如回归长度、波动率乘数、EMA周期等,以适应不同品种和市场特点。
- 增加止损和止盈机制,控制单笔交易风险和总体回撤水平。
- 考虑加入仓位管理和资金管理规则,根据市场波动和账户equity调整仓位大小。
总结
该策略通过线性回归和波动率指标识别市场状态,并使用EMA作为确认指标,构建了一个适应性强、逻辑清晰的交易策略。策略的优势在于结合趋势和波动性,同时允许参数优化,适用于不同市场环境。但策略也存在参数选择、震荡市和黑天鹅事件等风险,需要在实际应用中不断优化和完善。未来可以从丰富信号来源、优化参数选择、完善风控措施等方面对策略进行改进,以提升其稳定性和盈利能力。
||
Overview
The strategy utilizes linear regression and volatility indicators to identify different market states. When the conditions for buying or selling are met, the strategy establishes corresponding long or short positions. Additionally, the strategy allows for parameter optimization and adjustment based on market conditions to adapt to various market environments. The strategy also employs exponential moving averages (EMAs) as additional indicators to confirm trading signals.
Strategy Principles
- Calculate the intercept and slope of the linear regression to determine market trends.
- Calculate the Average True Range (ATR) multiplied by a multiplier as the volatility indicator.
- Generate a buy signal when the slope is greater than the upper threshold and the price is above the regression line plus volatility.
- Generate a sell signal when the slope is less than the lower threshold and the price is below the regression line minus volatility.
- Use fast and slow EMAs as additional confirmation indicators.
- Establish a long position when a buy signal occurs and the fast EMA is above the slow EMA.
- Establish a short position when a sell signal occurs and the fast EMA is below the slow EMA.
Strategy Advantages
- By combining linear regression and volatility indicators, the strategy can more accurately identify market states and trends.
- The use of additional EMA indicators to confirm trading signals enhances the reliability of the strategy.
- Allowing optimization of key parameters enables adaptation to different market environments and instrument characteristics.
- Considering both trends and volatility, the strategy can promptly establish positions when trends are clear and control risks when volatility increases.
Strategy Risks
- Improper parameter selection may lead to poor strategy performance, requiring optimization based on specific instruments and market characteristics.
- In choppy markets or at trend turning points, the strategy may experience frequent trades or false signals.
- The strategy relies on historical data and may not react promptly to sudden events or abnormal market fluctuations.
Strategy Optimization Directions
- Incorporate other technical indicators or fundamental factors to enrich the decision-making basis and improve signal accuracy.
- Optimize parameter selection, such as regression length, volatility multiplier, EMA periods, etc., to adapt to different instruments and market characteristics.
- Introduce stop-loss and take-profit mechanisms to control individual trade risks and overall drawdown levels.
- Consider incorporating position sizing and money management rules to adjust position sizes based on market volatility and account equity.
Summary
The strategy identifies market states using linear regression and volatility indicators, with EMAs as confirmation indicators, constructing an adaptive and logically clear trading strategy. The strategy's advantages lie in combining trends and volatility while allowing parameter optimization, making it suitable for various market environments. However, the strategy also faces risks such as parameter selection, choppy markets, and black swan events, requiring continuous optimization and improvement in practical applications. Future enhancements can focus on enriching signal sources, optimizing parameter selection, and refining risk control measures to enhance the strategy's stability and profitability. [/trans]
Source (PineScript)
/*backtest
start: 2023-05-22 00:00:00
end: 2024-05-27 00:00:00
period: 1d
basePeriod: 1h
exchanges: [{"eid":"Futures_Binance","currency":"BTC_USDT"}]
*/

// This Pine Script™ code is subject to the terms of the Mozilla Public License 2.0 at https://mozilla.org/MPL/2.0/
// © tmalvao

//@version=5
strategy("Regime de Mercado com Regressão e Volatilidade Otimizado", overlay=true)

// Parâmetros para otimização
upperThreshold = input.float(1.0, title="Upper Threshold")
lowerThreshold = input.float(-1.0, title="Lower Threshold")
length = input.int(50, title="Length", minval=1)

// Indicadores de volatilidade
atrLength = input.int(14, title="ATR Length")
atrMult = input.float(2.0, title="ATR Multiplier")
atr = ta.atr(atrLength)
volatility = atr * atrMult

// Calculando a regressão linear usando função incorporada
intercept = ta.linreg(close, length, 0)
slope = ta.linreg(close, length, 1) - ta.linreg(close, length, 0)

// Sinal de compra e venda
buySignal = slope > upperThreshold and close > intercept + volatility
sellSignal = slope < lowerThreshold and close < intercept - volatility

// Entrando e saindo das posições
if (buySignal)
    strategy.entry("Buy", strategy.long)
if (sellSignal)
    strategy.entry("Sell", strategy.short)

// Indicadores adicionais para confirmação
emaFastLength = input.int(10, title="EMA Fast Length")
emaSlowLength = input.int(50, title="EMA Slow Length")
emaFast = ta.ema(close, emaFastLength)
emaSlow = ta.ema(close, emaSlowLength)

// Confirmando sinais com EMAs
if (buySignal and emaFast > emaSlow)
    strategy.entry("Buy Confirmed", strategy.long)
if (sellSignal and emaFast < emaSlow)
    strategy.entry("Sell Confirmed", strategy.short)

// Exibindo informações no gráfico
plot(slope, title="Slope", color=color.blue)
plot(intercept, title="Intercept", color=color.red)
plot(volatility, title="Volatility", color=color.green)
hline(upperThreshold, "Upper Threshold", color=color.green, linestyle=hline.style_dotted)
hline(lowerThreshold, "Lower Threshold", color=color.red, linestyle=hline.style_dotted)
Detail
https://www.fmz.com/strategy/452743
Last Modified
2024-05-28 17:40:37