
9.2 KiB
Name
基于波动率和动量指标的波林格带RSI随机RSI策略-Bollinger-Bands-RSI-Stochastic-RSI-Strategy-Based-on-Volatility-and-Momentum-Indicators
Author
ChaoZhang
Strategy Description
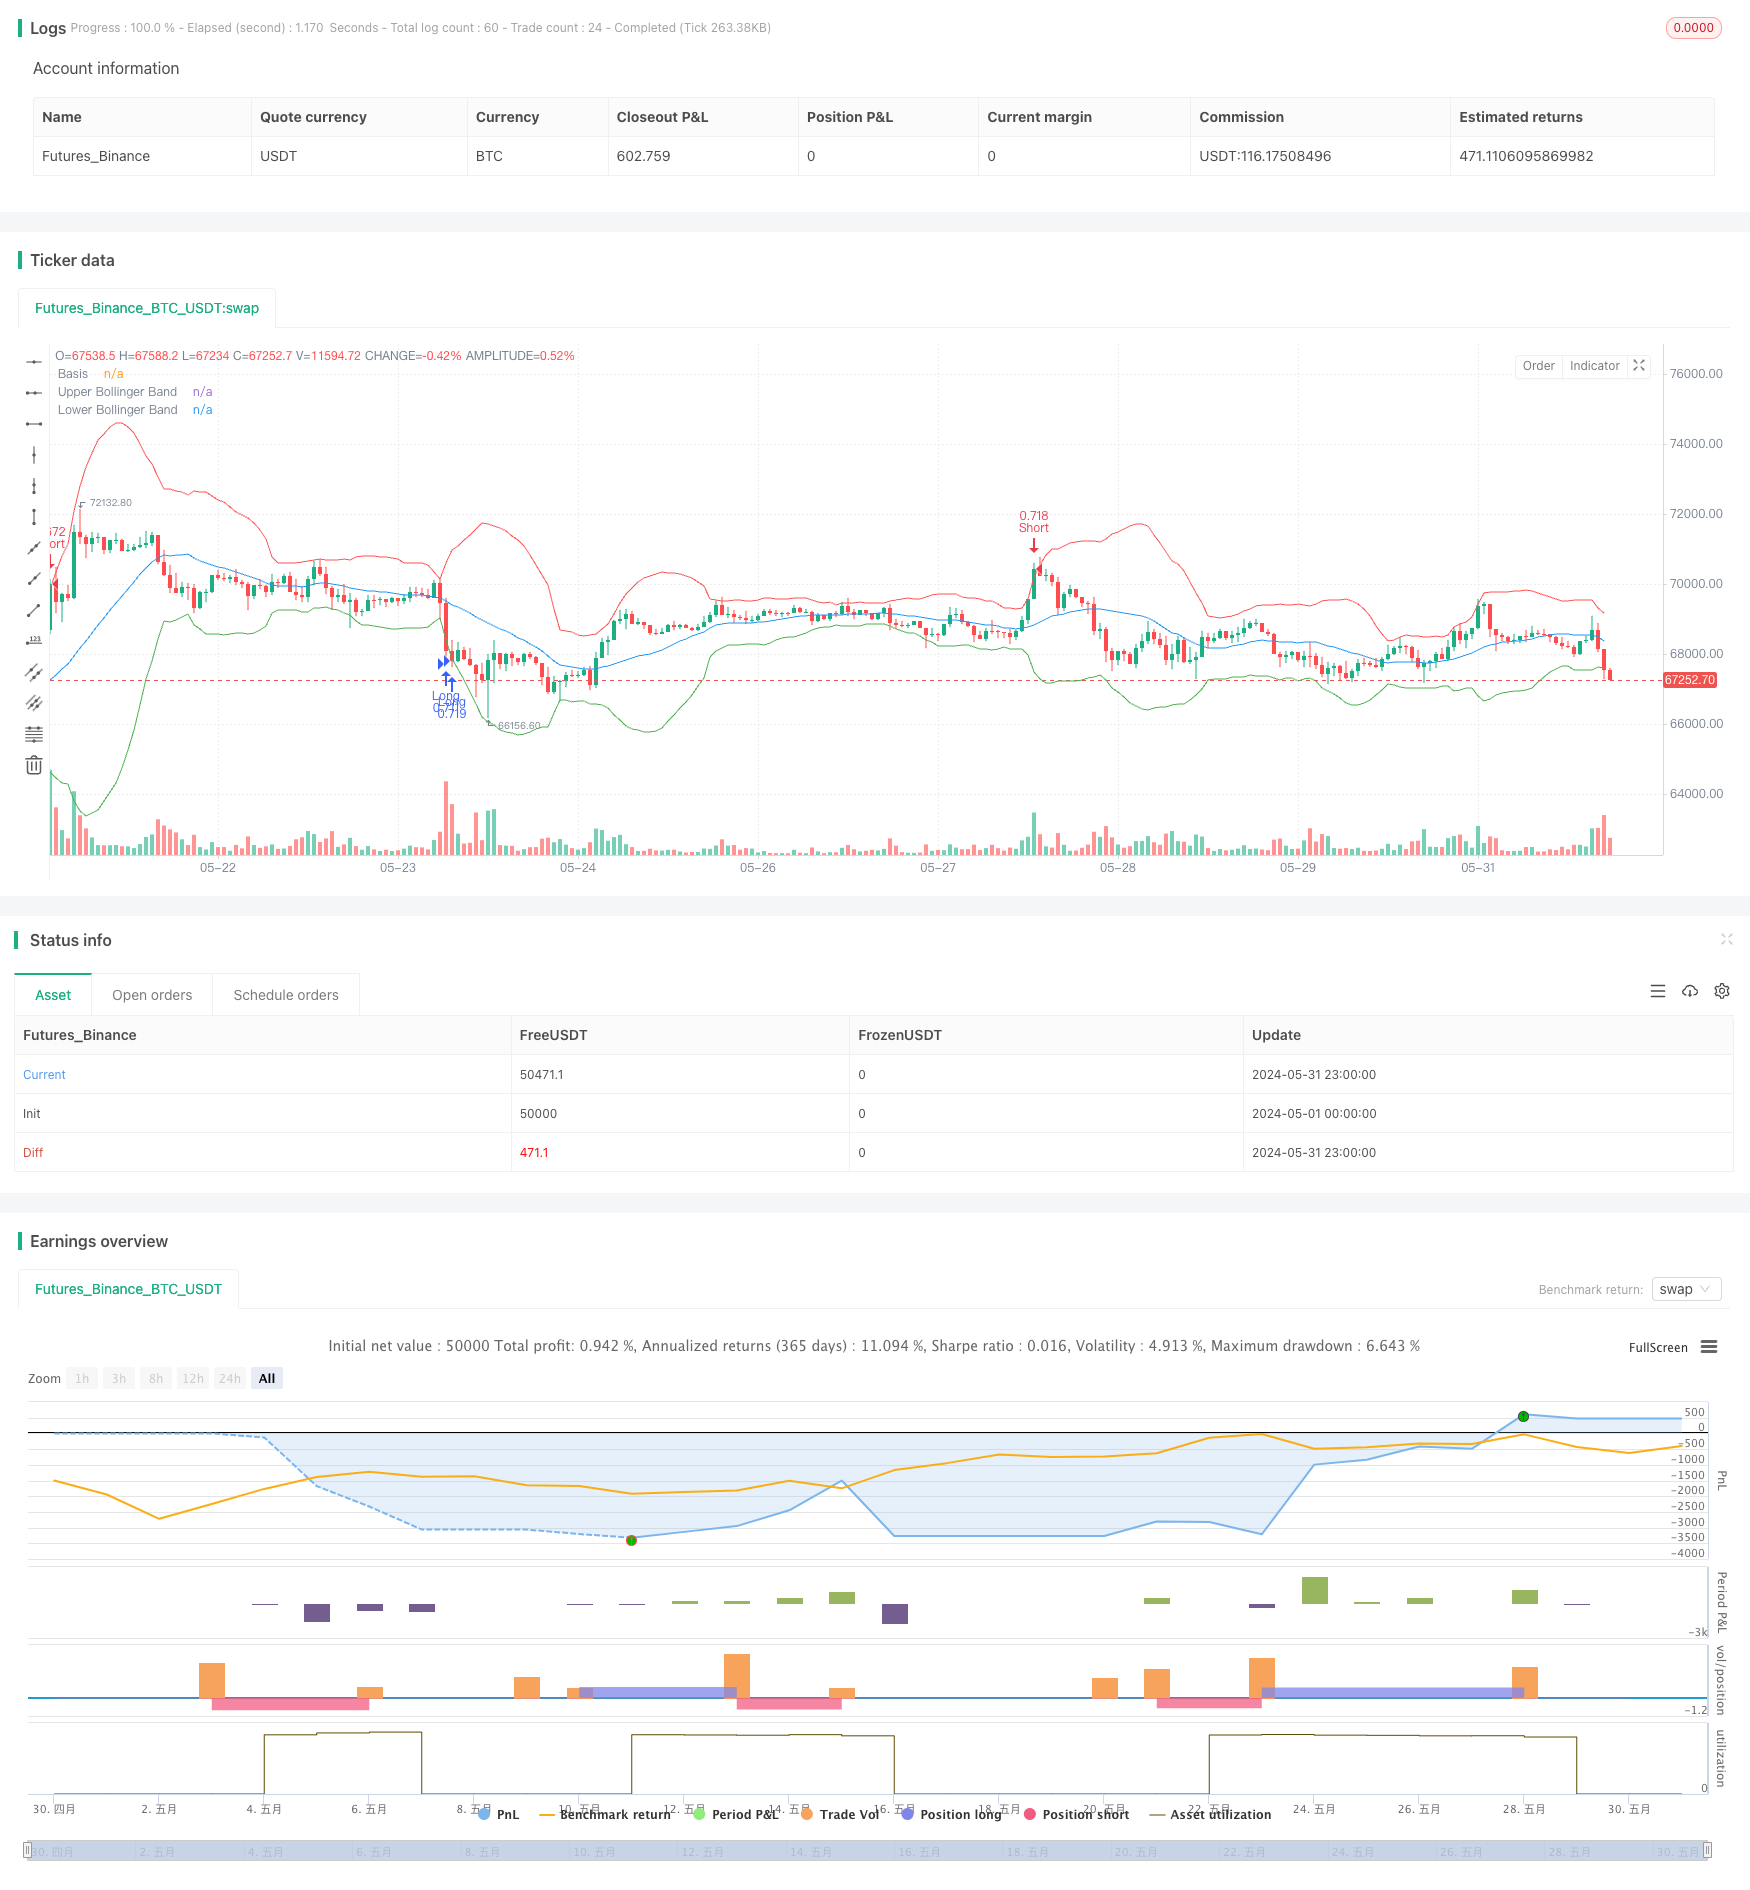 [trans]
概述
该策略结合了波林格带、相对强弱指数(RSI)和随机RSI三种技术指标,通过分析价格的波动率和动量,寻找市场的超买和超卖状态,以确定最佳的买入和卖出时机。策略使用20倍杠杆模拟期权交易,设置了0.60%的止盈位和0.25%的止损位,并限制每天只进行一次交易,以控制风险。
策略原理
该策略的核心是利用波林格带、RSI和随机RSI三种指标来评估市场状态。波林格带由中轨(20周期简单移动平均线)、上轨(中轨上方3个标准差)和下轨(中轨下方3个标准差)组成,用于衡量价格的波动率。RSI是一个动量振荡器,用于识别超买和超卖条件,本策略使用14周期RSI。随机RSI将随机振荡器公式应用于RSI值,也使用14周期长度。
当RSI低于34,随机RSI低于20,且收盘价在下轨附近或低于下轨时,触发买入信号。当RSI高于66,随机RSI高于80,且收盘价在上轨附近或高于上轨时,触发卖出信号。策略使用20倍杠杆模拟期权交易,止盈位设置为0.60%,止损位设置为0.25%。此外,该策略每天只进行一次交易,以控制风险。
策略优势
- 结合多个技术指标:该策略综合考虑了价格波动率(波林格带)和动量(RSI和随机RSI)两个方面,提供了更全面的市场分析。
- 风险控制:策略设置了明确的止盈和止损位,并限制每天只进行一次交易,有效控制了风险敞口。
- 适应性强:通过调整参数,如波林格带的标准差倍数、RSI和随机RSI的阈值等,该策略可以适应不同的市场条件。
策略风险
- 市场风险:策略的表现依赖于市场条件,在趋势不明朗或波动率极高的情况下,策略可能会表现不佳。
- 参数敏感性:策略的效果取决于所选参数的质量,参数设置不当可能导致策略表现欠佳。
- 杠杆风险:策略使用了20倍杠杆,虽然可以放大收益,但也会放大损失。在极端市场条件下,高杠杆可能导致重大损失。
策略优化方向
- 动态调整参数:根据市场状况的变化,动态调整波林格带的标准差倍数、RSI和随机RSI的阈值等参数,以适应不同的市场环境。
- 加入其他指标:考虑加入其他技术指标,如MACD、ADX等,以提高策略的可靠性和稳定性。
- 优化止盈止损:通过回测和优化,找到最佳的止盈止损比例,以在控制风险的同时最大化收益。
- 改进资金管理:探索更高级的资金管理技巧,如凯利准则,以优化策略的长期表现。
总结
该策略通过结合波林格带、RSI和随机RSI三种技术指标,利用价格波动率和动量信息,寻找最佳的买入和卖出时机。策略设置了明确的止盈止损位,并控制每天的交易次数,以管理风险。尽管该策略有其优势,但仍面临市场风险、参数敏感性和杠杆风险等挑战。通过动态调整参数、纳入其他指标、优化止盈止损和改进资金管理等方法,可以进一步优化该策略的表现。
||
Overview
This strategy combines three technical indicators: Bollinger Bands, Relative Strength Index (RSI), and Stochastic RSI. By analyzing price volatility and momentum, it aims to identify overbought and oversold market conditions to determine optimal entry and exit points. The strategy simulates options trading with 20x leverage, sets a 0.60% take-profit and a 0.25% stop-loss, and limits trading to once per day to manage risk.
Strategy Principle
The core of this strategy lies in using Bollinger Bands, RSI, and Stochastic RSI to assess market conditions. Bollinger Bands consist of a middle band (20-period simple moving average), an upper band (3 standard deviations above the middle band), and a lower band (3 standard deviations below the middle band), measuring price volatility. RSI is a momentum oscillator used to identify overbought and oversold conditions, with a 14-period length in this strategy. Stochastic RSI applies the Stochastic Oscillator formula to RSI values, also using a 14-period length.
A long signal is triggered when the RSI is below 34, the Stochastic RSI is below 20, and the close price is at or below the lower Bollinger Band. A short signal is triggered when the RSI is above 66, the Stochastic RSI is above 80, and the close price is at or above the upper Bollinger Band. The strategy uses 20x leverage to simulate options trading, with a 0.60% take-profit and a 0.25% stop-loss. Furthermore, it limits trading to once per day to control risk.
Strategy Advantages
- Multi-indicator approach: The strategy considers both price volatility (Bollinger Bands) and momentum (RSI and Stochastic RSI), providing a more comprehensive market analysis.
- Risk management: The strategy sets clear take-profit and stop-loss levels and limits trading to once per day, effectively managing risk exposure.
- Adaptability: By adjusting parameters such as the standard deviation multiplier for Bollinger Bands and the thresholds for RSI and Stochastic RSI, the strategy can adapt to various market conditions.
Strategy Risks
- Market risk: The strategy's performance depends on market conditions and may underperform during unclear trends or extremely high volatility.
- Parameter sensitivity: The strategy's effectiveness relies on the quality of chosen parameters, and improper settings may lead to suboptimal performance.
- Leverage risk: The strategy employs 20x leverage, which can amplify gains but also magnify losses. In extreme market conditions, high leverage may result in significant losses.
Strategy Optimization Directions
- Dynamic parameter adjustment: Dynamically adjust parameters such as the standard deviation multiplier for Bollinger Bands and the thresholds for RSI and Stochastic RSI based on changing market conditions to adapt to different environments.
- Additional indicators: Consider incorporating other technical indicators like MACD or ADX to enhance the strategy's reliability and stability.
- Optimize take-profit and stop-loss: Through backtesting and optimization, find the optimal take-profit and stop-loss ratios to maximize returns while managing risk.
- Improve money management: Explore more advanced money management techniques, such as the Kelly Criterion, to optimize the strategy's long-term performance.
Summary
This strategy combines Bollinger Bands, RSI, and Stochastic RSI to identify optimal entry and exit points by leveraging price volatility and momentum information. It sets clear take-profit and stop-loss levels and controls the number of daily trades to manage risk. Despite its advantages, the strategy faces challenges such as market risk, parameter sensitivity, and leverage risk. Further optimization can be achieved through dynamic parameter adjustment, incorporating additional indicators, optimizing take-profit and stop-loss, and improving money management techniques. [/trans]
Source (PineScript)
/*backtest
start: 2024-05-01 00:00:00
end: 2024-05-31 23:59:59
period: 1h
basePeriod: 15m
exchanges: [{"eid":"Futures_Binance","currency":"BTC_USDT"}]
*/

//@version=5
strategy("Bollinger Bands + RSI + Stochastic RSI Strategy with OTM Options", overlay=true)
// Define leverage factor (e.g., 20x leverage for OTM options)
leverage = 1
// Bollinger Bands
length = 20
deviation = 3
basis = ta.sma(close, length)
dev = ta.stdev(close, length)
upper = basis + deviation * dev
lower = basis - deviation * dev
// RSI
rsi_length = 14
rsi = ta.rsi(close, rsi_length)
// Stochastic RSI
stoch_length = 14
stoch_k = ta.stoch(close, close, close, stoch_length)
// Entry condition with Bollinger Bands
longCondition = rsi < 34 and stoch_k < 20 and close <= lower
shortCondition = rsi > 66 and stoch_k > 80 and close >= upper
// Plot Bollinger Bands
plot(basis, color=color.blue, title="Basis")
plot(upper, color=color.red, title="Upper Bollinger Band")
plot(lower, color=color.green, title="Lower Bollinger Band")
// Track if a trade has been made today
var int lastTradeDay = na
// Options Simulation: Take-Profit and Stop-Loss Conditions
profitPercent = 0.01    // 1% take profit
lossPercent = 0.002  // 0.2% stop loss
// Entry Signals
if (dayofmonth(timenow) != dayofmonth(lastTradeDay))
    if (longCondition)
        longTakeProfitPrice = close * (1 + profitPercent)
        longStopLossPrice = close * (1 - lossPercent)
        strategy.entry("Long", strategy.long, qty=leverage * strategy.equity / close)
        strategy.exit("Take Profit Long", from_entry="Long", limit=longTakeProfitPrice, stop=longStopLossPrice)
        lastTradeDay := dayofmonth(timenow)
    if (shortCondition)
        shortTakeProfitPrice = close * (1 - profitPercent)
        shortStopLossPrice = close * (1 + lossPercent)
        strategy.entry("Short", strategy.short, qty=leverage * strategy.equity / close)
        strategy.exit("Take Profit Short", from_entry="Short", limit=shortTakeProfitPrice, stop=shortStopLossPrice)
        lastTradeDay := dayofmonth(timenow)
Detail
https://www.fmz.com/strategy/453230
Last Modified
2024-06-03 10:51:36