
8.6 KiB
Name
基于枢轴指标的趋势操纵策略Pivot-Detector-Oscillator-Trend-Trading-Strategy
Author
ChaoZhang
Strategy Description
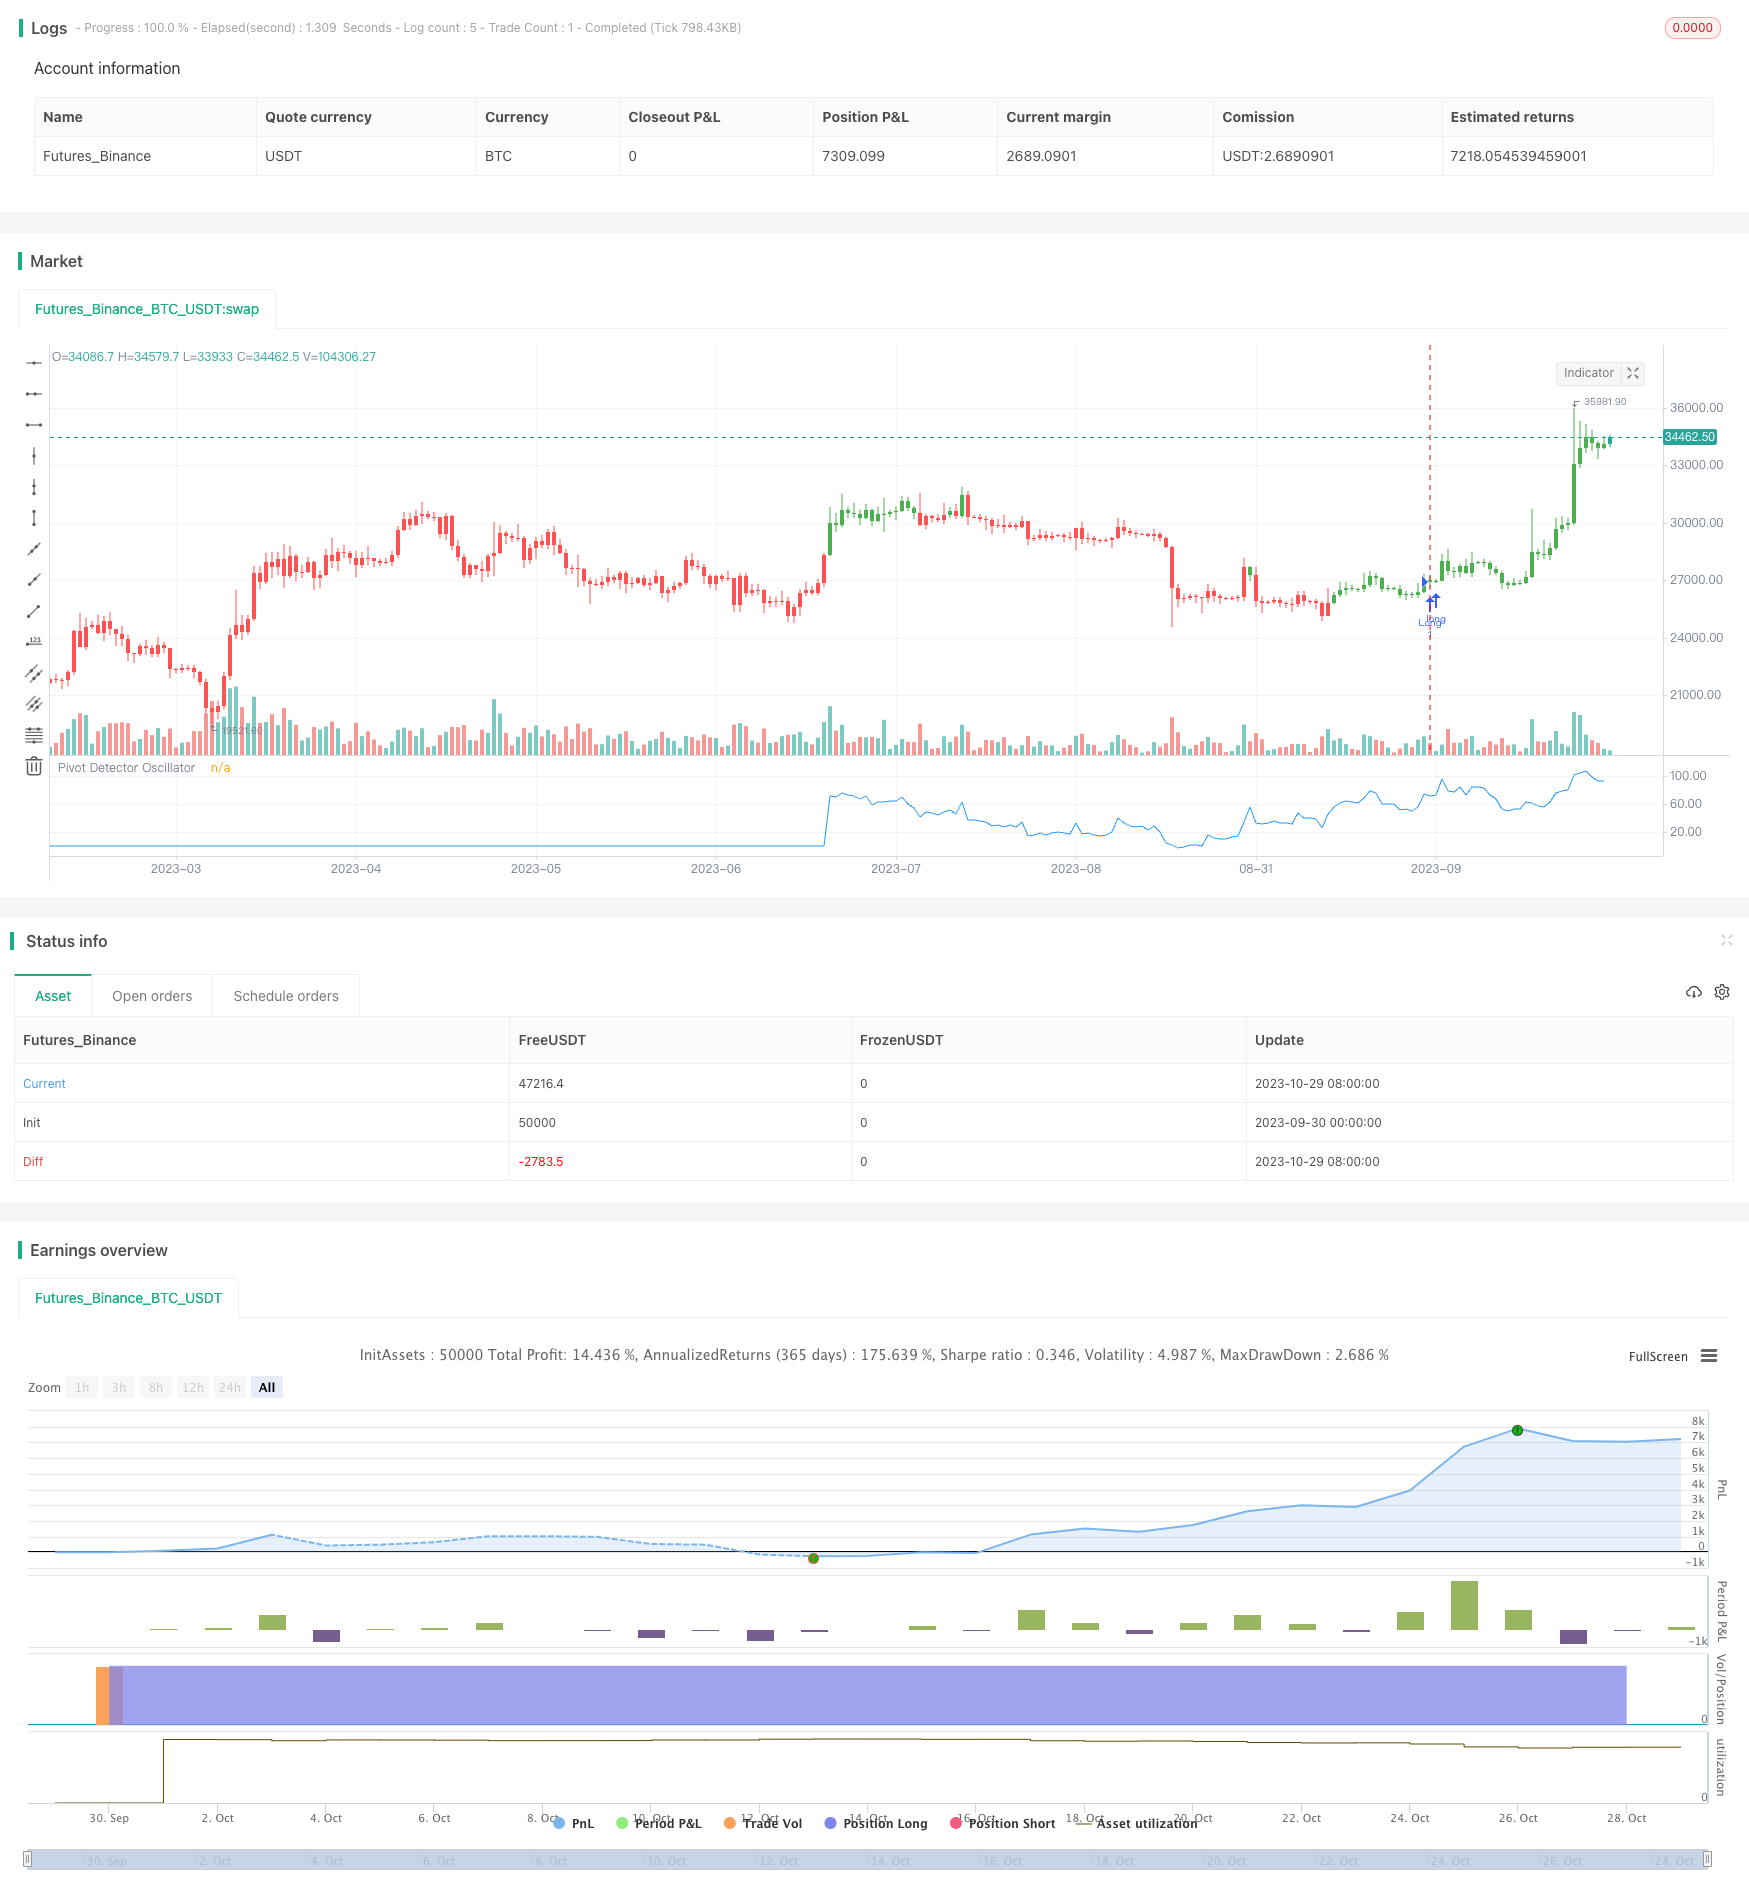 [trans]
概述
本策略基于枢轴指标,通过枢轴指标判断当前趋势方向,并结合RSI指标进行反向操纵,以达到追踪趋势的目的。
策略原理
本策略利用SMA移动平均线和RSI相对强弱指标构建枢轴指标。具体计算方法如下:
- 计算N日SMA移动平均线
- 计算M日RSI指标
- 当收盘价高于SMA时,枢轴指标=(RSI-35) / (85-35)
- 当收盘价低于SMA时,枢轴指标=(RSI-20) / (70-20)
- 根据枢轴指标值判断趋势方向
- 枢轴指标>50为看涨
- 枢轴指标<50为看跌
根据枢轴指标信号,进行反向操纵,即看涨时做空,看跌时做多,以追踪趋势方向。
本策略的关键在于运用枢轴指标判断趋势方向,并进行反向操纵,从而追踪市场趋势。
优势分析
本策略主要具有以下优势:
-
运用枢轴指标判断趋势方向准确。枢轴指标综合考虑了移动平均线和RSI指标,能较准确判断趋势转折点。
-
采用反向操纵策略,可有效追踪趋势。当出现趋势反转时,及时进行反向操作,追踪趋势走势。
-
RSI参数设置可调节策略灵敏度。RSI参数越小,对市场变化越敏感,可针对不同市场调整参数。
-
可灵活调整SMA周期,适应不同周期的趋势分析。
-
可切换做多做空方向,适应不同行情方向。
-
资金利用效率高,不需要大量资金即可获得较好收益。
风险分析
本策略也存在一定的风险:
-
枢轴指标存在误判风险,可能出现背离导致判断失误。
-
反向操纵策略亏损风险较大,需要严格控制止损。
-
趋势较强时,无法及时反转操作,可能错过趋势。
-
参数设置不当可能导致过于灵敏或迟钝。
-
交易频繁,交易费用是一大负担。
对应风险管理措施:
-
合理设置移动平均线周期,避免误判。
-
严格止损,控制单笔亏损。
-
采用分批建仓,降低风险。
-
参数优化测试,选择适合本策略的参数组合。
-
优化止损策略,降低损失。
优化方向
本策略可从以下几个方面进行优化:
-
优化指标参数,选择最优参数组合。可以通过遍历回测确定最佳参数。
-
优化止损策略。可以设置余弦波动止损、跟踪止损等动态止损方案。
-
结合其他指标过滤信号。可以加入MACD、KDJ等指标,避免误信号。
-
采用机器学习方法自动优化。使用进化算法、强化学习等方法自动寻找最优参数。
-
结合量价关系选时。如成交量突增时才考虑进场。
-
采用基于模型的止损。建立股价波动模型,进行动态止损。
-
利用高频数据进行止损优化。
总结
本策略基于枢轴指标判断趋势方向,采用反向操纵模式追踪趋势,可有效跟踪市场趋势走向。优点是判断准确、灵活、资金利用效率高,但也存在一定的误判风险和亏损风险。通过参数优化、止损优化等手段,可以进一步提高策略盈利能力和稳定性。本策略为一种较为典型的定量交易策略,整体思路清晰,值得深入研究。
||
Overview
This strategy is based on the Pivot Detector Oscillator to determine the current trend direction and manipulate the trend reversely using RSI to follow the trend.
Strategy Logic
This strategy uses SMA and RSI to construct the Pivot Detector Oscillator. The calculation method is as follows:
- Calculate N-day SMA
- Calculate M-day RSI
- When close price is above SMA, Pivot Detector Oscillator = (RSI - 35) / (85 - 35)
- When close price is below SMA, Pivot Detector Oscillator = (RSI - 20) / (70 - 20)
- Determine trend direction based on Pivot Detector Oscillator value
-
50 means bullish
- <50 means bearish
-
According to the Pivot Detector Oscillator signal, reverse manipulate the trend, i.e. go short when bullish and go long when bearish, to follow the trend direction.
The key of this strategy is using the Pivot Detector Oscillator to determine the trend direction and reverse manipulate to track the market trend.
Advantage Analysis
The main advantages of this strategy are:
-
The Pivot Detector Oscillator can accurately determine the trend direction. It comprehensively considers SMA and RSI, and can accurately identify trend reversal points.
-
The reverse manipulation strategy can effectively follow the trend. It can reverse operation in time when trend reversal happens to follow the trend.
-
The RSI parameter setting can adjust the sensitivity. Smaller RSI parameter makes it more sensitive to market changes.
-
The SMA period can be flexibly adjusted for trend analysis over different timeframes.
-
The long/short direction can be switched to adapt to different market conditions.
-
High capital utilization efficiency without requiring large capital.
Risk Analysis
There are also some risks:
-
Risk of misjudgment of the Pivot Detector Oscillator. Divergence may cause wrong judgments.
-
High risk of loss in reverse manipulation strategies. Strict stop loss is required.
-
Unable to reverse operation in time in strong trend conditions, potentially missing the trend.
-
Improper parameter settings may cause over-sensitivity or sluggishness.
-
Frequent trading leads to high transaction costs.
Risk management measures:
-
Set reasonable SMA period to avoid misjudgment.
-
Strict stop loss to control single loss.
-
Using partial position to reduce risk.
-
Parameter optimization to find optimal parameters.
-
Optimize stop loss strategy to reduce loss.
Improvement Directions
This strategy can be improved from the following aspects:
-
Optimize indicator parameters to find the optimal combination.
-
Optimize stop loss strategies such as trailing stop loss.
-
Add other indicators like MACD, KDJ to filter signals.
-
Use machine learning methods to automatically optimize, like evolutionary algorithms, reinforcement learning.
-
Combine volume analysis for timing.
-
Model-based stop loss based on price fluctuation models.
-
Optimize stop loss using high frequency data.
Summary
This strategy uses the Pivot Detector Oscillator to determine the trend direction and reverse manipulation to follow the trend. The advantages are accuracy, flexibility, high capital utilization efficiency, but there are also risks of misjudgment and loss. Further improvements on parameter optimization and stop loss can enhance profitability and stability. Overall this is a typical quantitative trading strategy with clear logic and worth in-depth researching.
[/trans]
Strategy Arguments
| Argument | Default | Description |
|---|---|---|
| v_input_1 | 200 | Length_MA |
| v_input_2 | 14 | Length_RSI |
| v_input_3 | 100 | UpBand |
| v_input_4 | false | DownBand |
| v_input_5 | 50 | MidlleBand |
| v_input_6 | false | Trade reverse |
Source (PineScript)
/*backtest
start: 2023-09-30 00:00:00
end: 2023-10-30 00:00:00
period: 1d
basePeriod: 1h
exchanges: [{"eid":"Futures_Binance","currency":"BTC_USDT"}]
*/

//@version=2
////////////////////////////////////////////////////////////
//  Copyright by HPotter v1.0 03/10/2017
// The Pivot Detector Oscillator, by Giorgos E. Siligardos
// The related article is copyrighted material from Stocks & Commodities 2009 Sep
//
// You can change long to short in the Input Settings
// WARNING:
// - For purpose educate only
// - This script to change bars colors.
////////////////////////////////////////////////////////////
strategy(title="The Pivot Detector Oscillator, by Giorgos E. Siligardos")
Length_MA = input(200, minval=1)
Length_RSI = input(14, minval=1)
UpBand = input(100, minval=1)
DownBand = input(0)
MidlleBand = input(50)
reverse = input(false, title="Trade reverse")
// hline(MidlleBand, color=black, linestyle=dashed)
// hline(UpBand, color=red, linestyle=line)
// hline(DownBand, color=green, linestyle=line)
xMA = sma(close, Length_MA)
xRSI = rsi(close, Length_RSI)
nRes = iff(close > xMA, (xRSI - 35) / (85-35),
         iff(close <= xMA, (xRSI - 20) / (70 - 20), 0))
pos = iff(nRes * 100 > 50, 1,
	   iff(nRes * 100 < 50, -1, nz(pos[1], 0)))
possig = iff(reverse and pos == 1, -1,
          iff(reverse and pos == -1, 1, pos))
if (possig == 1)
    strategy.entry("Long", strategy.long)
if (possig == -1)
    strategy.entry("Short", strategy.short)
barcolor(possig == -1 ? red: possig == 1 ? green : blue )
plot(nRes * 100, color=blue, title="Pivot Detector Oscillator")
Detail
https://www.fmz.com/strategy/430669
Last Modified
2023-10-31 14:47:05