
7.8 KiB
Name
基于方差和移动平均线的波动幅度策略-Variance-and-Moving-Averages-Based-Volatility-Strategy
Author
ChaoZhang
Strategy Description
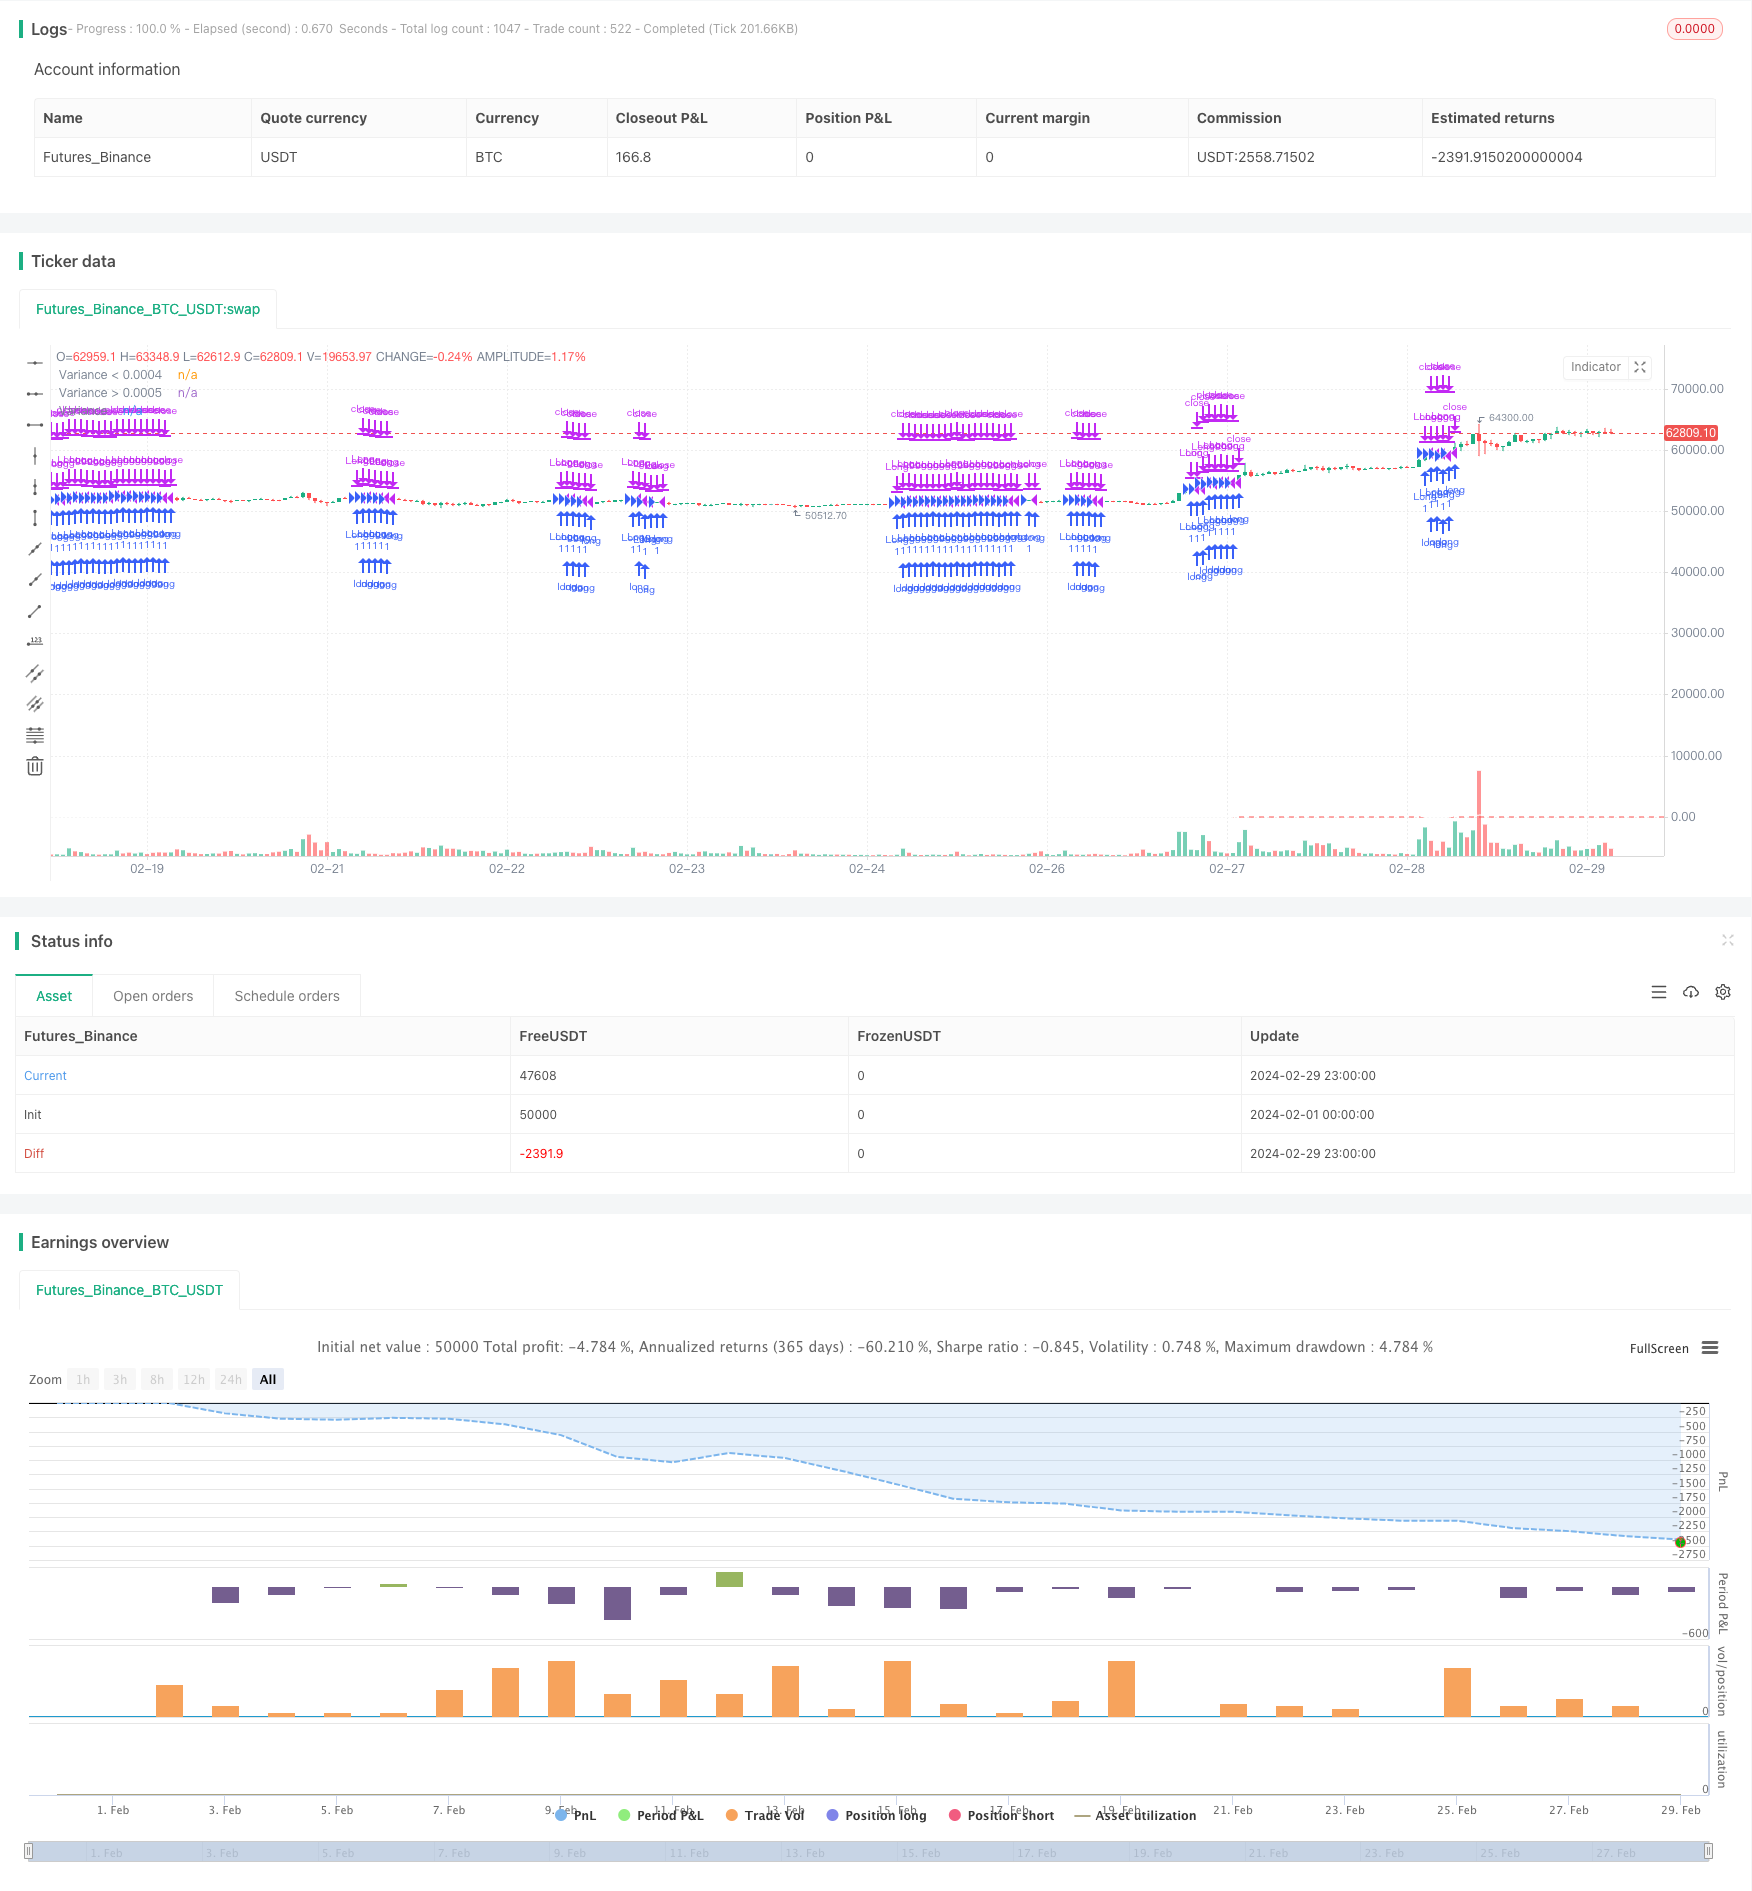
[trans] 该策略名为"基于方差和移动平均线的波动幅度策略",它利用过去30根K线的波动幅度方差和三条移动平均线(MA5、MA15和MA30)来制定交易决策。
策略的主要思想是通过计算价格波动幅度的方差来衡量市场的波动性,并结合不同周期的移动平均线来判断趋势方向。当波动性较低且短期均线在长期均线之上时,策略会进行买入操作。同时,策略设置了止损和止盈条件来控制风险和锁定利润。
策略的原理可以分为以下几个步骤:
- 计算5日、15日和30日移动平均线(MA5、MA15和MA30)。
- 计算过去30根K线的波动幅度(最高价和最低价之差除以收盘价)的方差,并将其乘以1,000,000以便于观察。
- 定义买入条件:方差小于35且MA5大于MA15,MA15大于MA30。
- 定义止损条件:收盘价低于MA30或MA5低于MA30。
- 定义止盈条件:方差大于500。
- 当买入条件满足时,策略开仓做多;当止损或止盈条件满足时,策略平仓。
该策略的优势包括:
- 结合波动性和趋势指标,能够在趋势明确且波动性较低时进行交易,避免了在波动剧烈的市场环境下交易。
- 使用多个周期的移动平均线,能够更全面地判断趋势方向,提高交易的准确性。
- 设置明确的止损和止盈条件,有效控制风险和锁定利润。
策略的风险主要有:
- 在市场趋势不明确或波动性突然增大时,策略可能会出现频繁交易或错误信号。
- 止损和止盈条件的设置可能无法完全适应所有市场环境,需要根据实际情况进行调整。
- 策略依赖于历史数据,对于突发事件或市场异常波动可能反应不及时。
为了优化该策略,可以考虑以下几个方向:
- 对于买入条件中的方差阈值和移动平均线组合,可以通过回测和参数优化来寻找最佳值。
- 止损和止盈条件可以引入更多技术指标或市场情绪指标,如RSI、MACD等,以提高信号的可靠性。
- 可以考虑引入市场风险管理机制,如动态调整仓位、波动率调整等,以应对市场环境的变化。
总的来说,"基于方差和移动平均线的波动幅度策略"是一个结合波动性和趋势指标的交易策略。它通过计算价格波动幅度的方差来衡量市场的波动性,并结合不同周期的移动平均线来判断趋势方向,在适当的市场环境下进行交易。该策略设置了明确的止损和止盈条件,能够有效控制风险和锁定利润。同时,策略还有优化的空间,可以通过参数优化、引入更多指标和风险管理机制来提高其适应性和稳健性。
||
The strategy named "Variance and Moving Averages Based Volatility Strategy" uses the variance of the price volatility over the past 30 candles and three moving averages (MA5, MA15, and MA30) to make trading decisions.
The main idea of the strategy is to measure market volatility by calculating the variance of price volatility and combine it with moving averages of different periods to determine the trend direction. When volatility is low and the short-term moving average is above the long-term moving average, the strategy enters a long position. At the same time, the strategy sets stop-loss and take-profit conditions to control risk and lock in profits.
The principle of the strategy can be divided into the following steps:
- Calculate the 5-day, 15-day, and 30-day moving averages (MA5, MA15, and MA30).
- Calculate the variance of the price volatility (the difference between the highest and lowest prices divided by the closing price) over the past 30 candles, and multiply it by 1,000,000 for easier observation.
- Define the buy condition: variance is less than 35, MA5 is greater than MA15, and MA15 is greater than MA30.
- Define the stop-loss condition: the closing price is lower than MA30 or MA5 is lower than MA30.
- Define the take-profit condition: variance is greater than 500.
- When the buy condition is met, the strategy enters a long position; when the stop-loss or take-profit condition is met, the strategy closes the position.
The advantages of this strategy include:
- By combining volatility and trend indicators, it can trade when the trend is clear and volatility is low, avoiding trading in highly volatile market conditions.
- Using multiple moving averages allows for a more comprehensive assessment of the trend direction, improving the accuracy of trades.
- Setting clear stop-loss and take-profit conditions effectively controls risk and locks in profits.
The risks of the strategy mainly include:
- When the market trend is unclear or volatility suddenly increases, the strategy may experience frequent trades or false signals.
- The stop-loss and take-profit conditions may not fully adapt to all market environments and may require adjustments based on actual situations.
- The strategy relies on historical data and may not react quickly to unexpected events or abnormal market fluctuations.
To optimize this strategy, the following directions can be considered:
- For the variance threshold and moving average combination in the buy condition, the optimal values can be found through backtesting and parameter optimization.
- More technical indicators or market sentiment indicators, such as RSI and MACD, can be introduced into the stop-loss and take-profit conditions to improve the reliability of signals.
- Market risk management mechanisms, such as dynamic position adjustment and volatility adjustment, can be introduced to adapt to changes in market conditions.
In summary, the "Variance and Moving Averages Based Volatility Strategy" is a trading strategy that combines volatility and trend indicators. It measures market volatility by calculating the variance of price volatility and combines it with moving averages of different periods to determine the trend direction, entering trades in appropriate market conditions. The strategy sets clear stop-loss and take-profit conditions, which can effectively control risk and lock in profits. At the same time, the strategy has room for optimization and can improve its adaptability and robustness through parameter optimization, introducing more indicators, and implementing risk management mechanisms.
[/trans]
Source (PineScript)
/*backtest
start: 2024-02-01 00:00:00
end: 2024-02-29 23:59:59
period: 1h
basePeriod: 15m
exchanges: [{"eid":"Futures_Binance","currency":"BTC_USDT"}]
*/

//@version=5
strategy("Variance and Moving Averages Strategy", overlay=true)

// 计算MA5、MA15和MA30
ma5 = ta.sma(close, 5)
ma15 = ta.sma(close, 15)
ma30 = ta.sma(close, 30)

// 计算过去30根K线的波动幅度(最高价和最低价)的方差
variance = ta.variance((high - low) / close, 30) * 1000000

// 定义买入条件
buy_condition = variance < 35 and ma5 > ma15 and ma15 > ma30

// 定义止损条件 close < ma30 or ma5 < ma30
stop_loss_condition = true

// 定义止盈条件
take_profit_condition = variance > 500

// 执行交易逻辑
if (buy_condition)
    strategy.entry("Long", strategy.long)
if (stop_loss_condition)
    strategy.close("Long")
if (take_profit_condition)
    strategy.close("Long")

// 绘制MA5、MA15和MA30
// plot(ma5, color=color.blue, title="MA5")
// plot(ma15, color=color.orange, title="MA15")
// plot(ma30, color=color.red, title="MA30")

// 绘制方差
hline(0.0004, color=color.green, linestyle=hline.style_dashed, title="Variance < 0.0004")
hline(0.0005, color=color.red, linestyle=hline.style_dashed, title="Variance > 0.0005")
plot(variance, color=color.white, title="Variance")
Detail
https://www.fmz.com/strategy/446453
Last Modified
2024-03-28 17:33:08