
7.9 KiB
Name
基于斐波那契07水平的趋势突破量化交易策略-Quantitative-Trading-Strategy-Based-on-Fibonacci-07-Level-Trend-Breakthrough
Author
ChaoZhang
Strategy Description
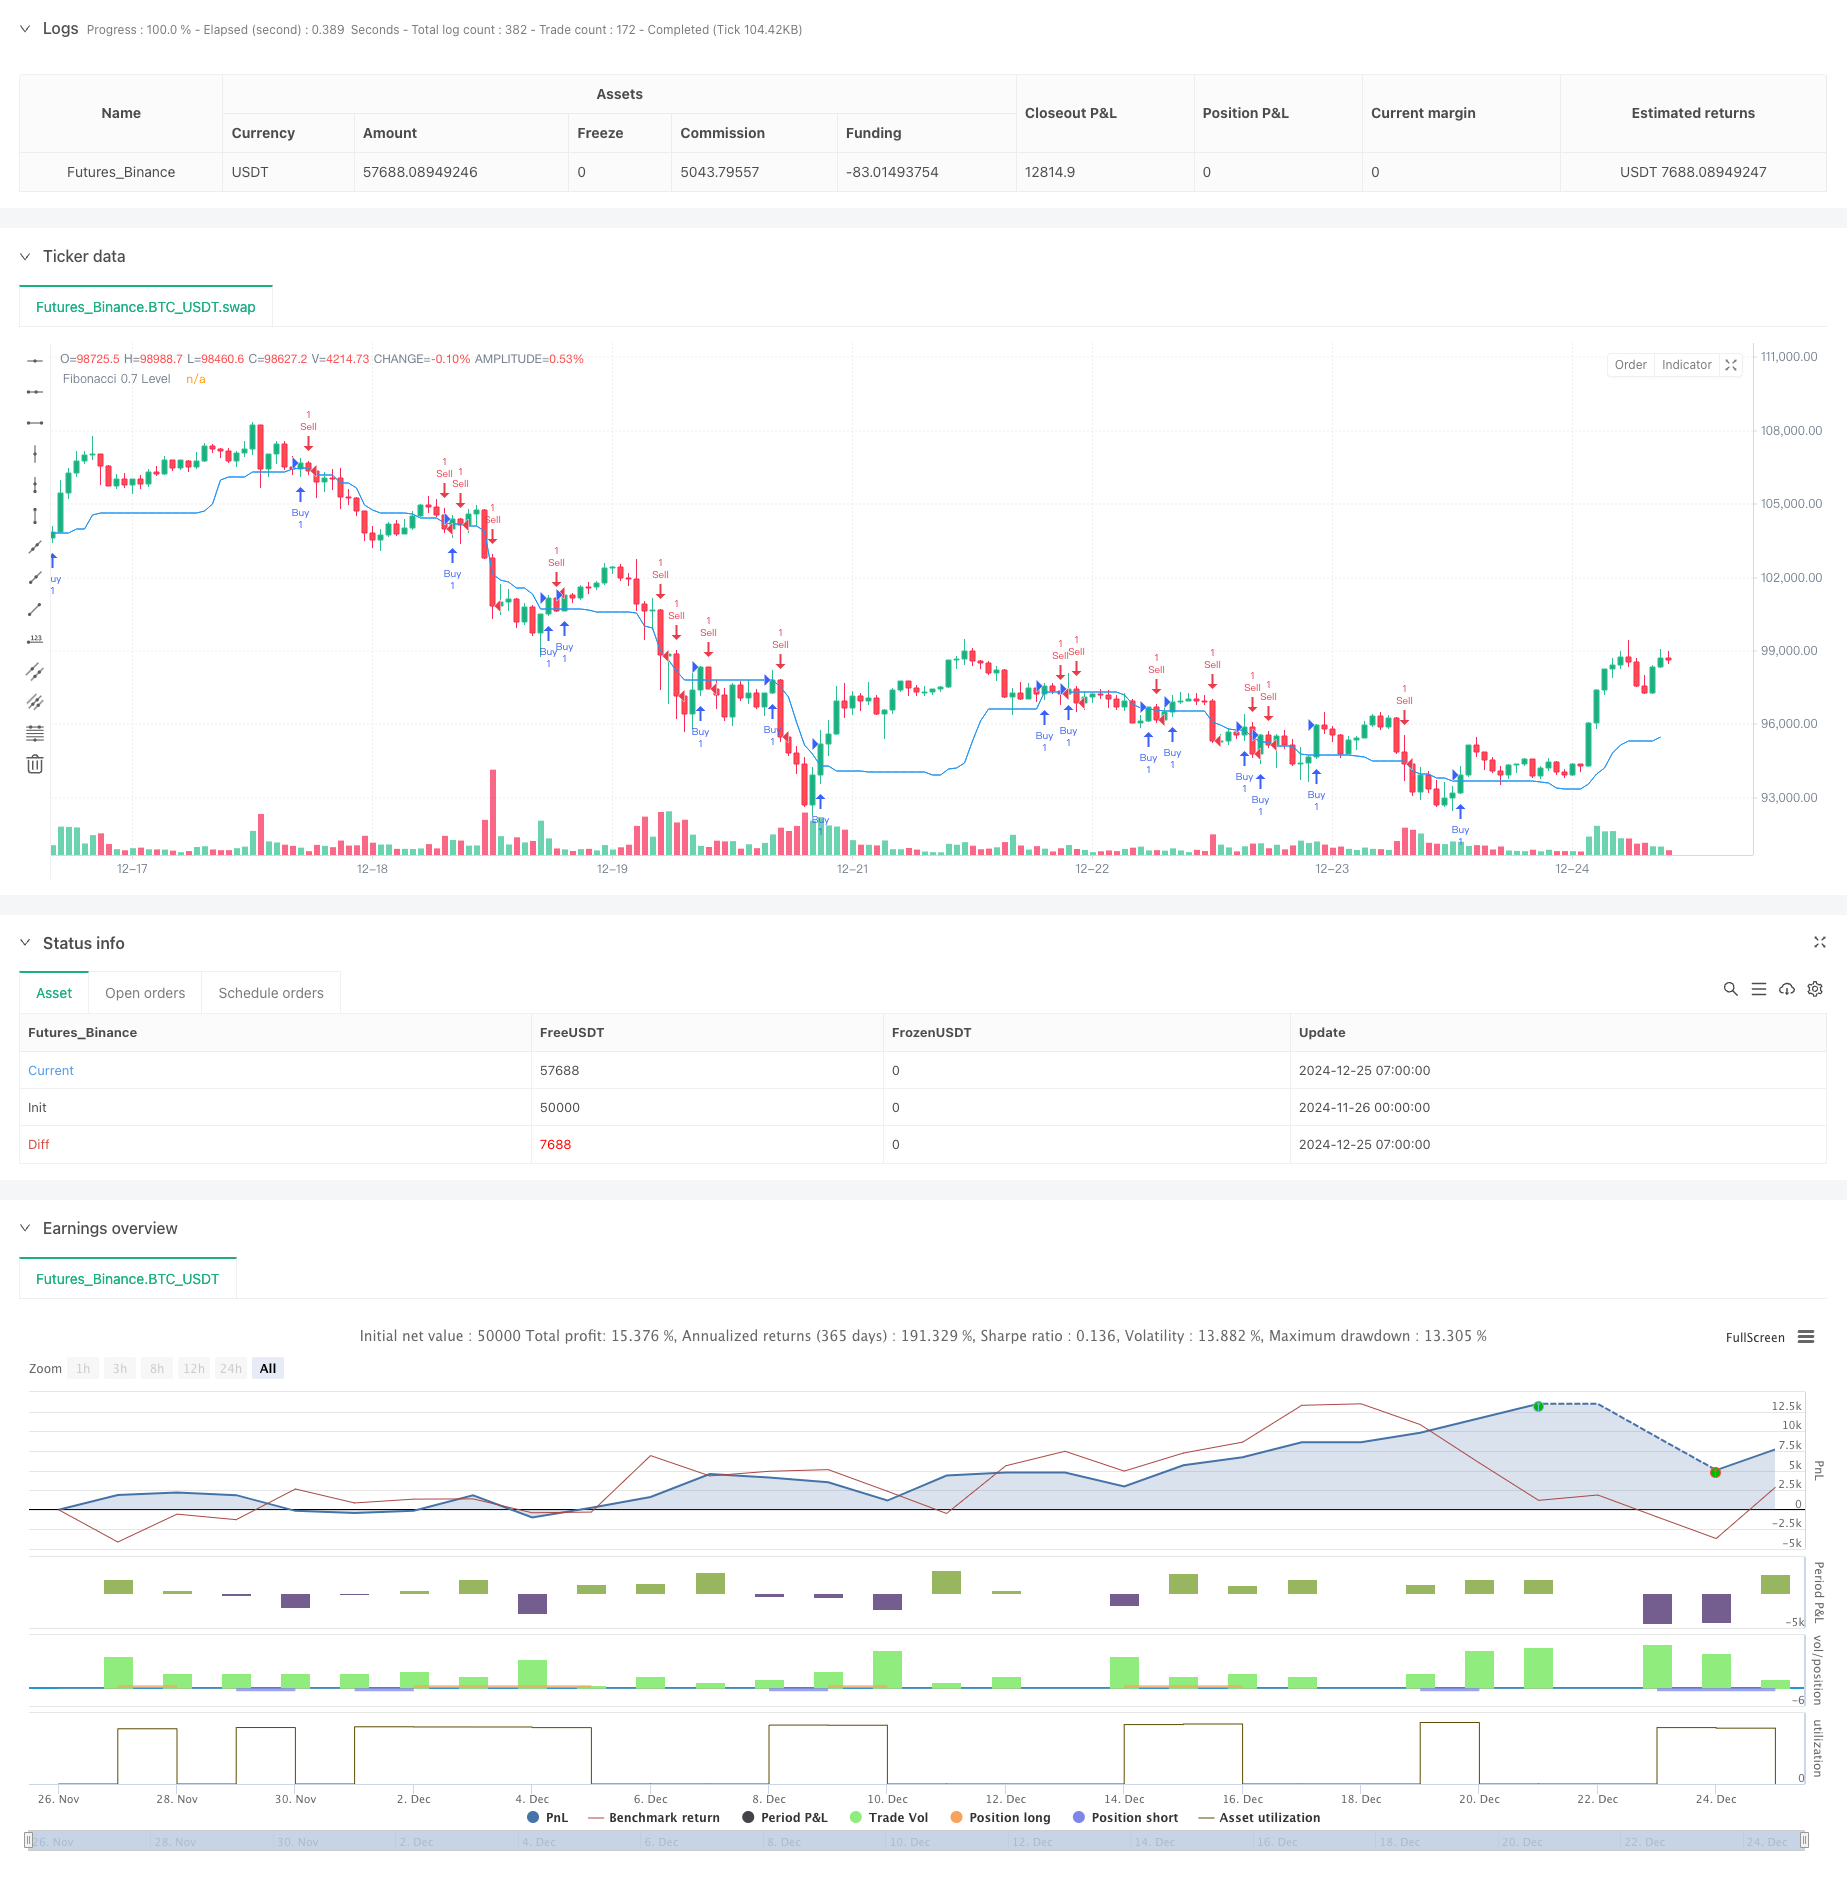
[trans]
概述
该策略是一个基于斐波那契0.7回撤水平的趋势突破交易系统。它通过计算指定回看期内的最高价和最低价来确定斐波那契0.7水平,并在价格突破该水平时产生交易信号。策略采用了固定百分比的止盈止损来管理风险,默认使用账户总值的5%作为单次交易金额。
策略原理
策略的核心逻辑基于以下几个关键要素:
- 动态计算斐波那契水平:在指定的回看期(默认20个周期)内,持续追踪最高价和最低价,并计算0.7斐波那契回撤位置。
- 突破信号确认:当收盘价从下方突破0.7水平时产生做多信号;当从上方突破时产生做空信号。
- 风险管理:系统设置了对称的止盈止损条件,默认止盈为1.8%,止损为1.2%,这种设置体现了正期望值的理念。
- 仓位管理:采用账户总值的固定比例作为开仓金额,这种方式有助于资金的动态管理和风险的稳定控制。
策略优势
- 技术指标选择科学:斐波那契回撤是市场广泛认可的技术分析工具,0.7水平通常代表较强的支撑或阻力。
- 信号逻辑清晰:使用价格突破作为交易触发条件,避免了复杂的信号组合可能带来的滞后性。
- 风险收益比合理:止盈止损比例的设置体现了正期望值,有利于长期稳定盈利。
- 资金管理灵活:采用账户比例进行开仓,能够随着账户规模的变化自动调整交易量。
策略风险
- 市场环境依赖:在震荡市场中可能产生频繁的假突破信号,增加交易成本。
- 参数敏感性:回看周期、止盈止损比例等参数的选择会显著影响策略表现。
- 滑点影响:在交易量较小的市场中,可能面临较大的滑点风险。
- 技术局限性:单一技术指标可能无法充分捕捉市场的多维度信息。
策略优化方向
- 信号过滤:可以引入成交量、波动率等辅助指标来过滤假突破信号。
- 动态参数:考虑根据市场波动率动态调整回看周期和止盈止损比例。
- 时间过滤:增加交易时间窗口的限制,避开波动性较大的时段。
- 多周期验证:增加多个时间周期的确认机制,提高信号的可靠性。
总结
该策略基于经典的斐波那契理论,结合了趋势突破和风险管理的核心要素。虽然存在一定的局限性,但通过合理的参数优化和信号过滤,有望在多种市场环境下保持稳定的表现。策略的成功运行需要交易者深入理解市场特征,并根据实际情况进行适当的调整和优化。 ||
Overview
This strategy is a trend breakthrough trading system based on the Fibonacci 0.7 retracement level. It generates trading signals when price breaks through the Fibonacci 0.7 level, which is calculated using the highest and lowest prices within a specified lookback period. The strategy employs fixed percentage take-profit and stop-loss levels for risk management, using 5% of account equity as the default position size.
Strategy Principle
The core logic of the strategy is based on the following key elements:
- Dynamic Fibonacci level calculation: Continuously tracks the highest and lowest prices within the specified lookback period (default 20 periods) and calculates the 0.7 Fibonacci retracement level.
- Breakthrough signal confirmation: Generates long signals when closing price breaks above the 0.7 level and short signals when it breaks below.
- Risk management: System implements symmetrical take-profit and stop-loss conditions, with default settings of 1.8% for take-profit and 1.2% for stop-loss, reflecting a positive expected value approach.
- Position sizing: Uses a fixed percentage of account equity for position sizing, facilitating dynamic money management and consistent risk control.
Strategy Advantages
- Scientific indicator selection: Fibonacci retracement is a widely recognized technical analysis tool, with the 0.7 level typically representing strong support or resistance.
- Clear signal logic: Uses price breakthrough as trading trigger, avoiding potential lag from complex signal combinations.
- Reasonable risk-reward ratio: Take-profit and stop-loss ratio settings reflect positive expected value, conducive to long-term stable profits.
- Flexible money management: Position sizing based on account percentage automatically adjusts trading volume as account size changes.
Strategy Risks
- Market environment dependency: May generate frequent false breakthrough signals in ranging markets, increasing transaction costs.
- Parameter sensitivity: Choice of lookback period, take-profit, and stop-loss ratios significantly affects strategy performance.
- Slippage impact: May face significant slippage risk in markets with low trading volume.
- Technical limitations: Single technical indicator may not fully capture multi-dimensional market information.
Strategy Optimization Directions
- Signal filtering: Can introduce auxiliary indicators like volume and volatility to filter false breakthrough signals.
- Dynamic parameters: Consider dynamically adjusting lookback period and profit/loss ratios based on market volatility.
- Time filtering: Add trading time window restrictions to avoid highly volatile periods.
- Multi-timeframe verification: Add confirmation mechanisms across multiple timeframes to improve signal reliability.
Summary
The strategy combines classic Fibonacci theory with core elements of trend breakthrough and risk management. While it has certain limitations, through appropriate parameter optimization and signal filtering, it has the potential to maintain stable performance across various market conditions. Successful strategy implementation requires traders to deeply understand market characteristics and make appropriate adjustments and optimizations based on actual conditions.[/trans]
Source (PineScript)
/*backtest
start: 2024-11-26 00:00:00
end: 2024-12-25 08:00:00
period: 1h
basePeriod: 1h
exchanges: [{"eid":"Futures_Binance","currency":"BTC_USDT"}]
*/

//@version=5
strategy("Fibonacci 0.7 Strategy - 60% Win Rate", overlay=true)

// Input parameters
fibonacci_lookback = input.int(20, minval=1, title="Fibonacci Lookback Period")
take_profit_percent = input.float(1.8, title="Take Profit (%)")
stop_loss_percent = input.float(1.2, title="Stop Loss (%)")

// Calculating Fibonacci levels
var float high_level = na
var float low_level = na
if (ta.change(ta.highest(high, fibonacci_lookback)))
    high_level := ta.highest(high, fibonacci_lookback)
if (ta.change(ta.lowest(low, fibonacci_lookback)))
    low_level := ta.lowest(low, fibonacci_lookback)

fib_level_0_7 = high_level - ((high_level - low_level) * 0.7)

// Entry Conditions
buy_signal = close > fib_level_0_7 and close[1] <= fib_level_0_7
sell_signal = close < fib_level_0_7 and close[1] >= fib_level_0_7

// Risk management
long_take_profit = strategy.position_avg_price * (1 + take_profit_percent / 100)
long_stop_loss = strategy.position_avg_price * (1 - stop_loss_percent / 100)
short_take_profit = strategy.position_avg_price * (1 - take_profit_percent / 100)
short_stop_loss = strategy.position_avg_price * (1 + stop_loss_percent / 100)

// Execute trades
if (buy_signal)
    strategy.entry("Buy", strategy.long)
if (sell_signal)
    strategy.entry("Sell", strategy.short)

// Take Profit and Stop Loss
if (strategy.position_size > 0)
    strategy.exit("Take Profit/Stop Loss", "Buy", stop=long_stop_loss, limit=long_take_profit)
if (strategy.position_size < 0)
    strategy.exit("Take Profit/Stop Loss", "Sell", stop=short_stop_loss, limit=short_take_profit)

// Plot Fibonacci Level
plot(fib_level_0_7, color=color.blue, title="Fibonacci 0.7 Level")
Detail
https://www.fmz.com/strategy/476278
Last Modified
2024-12-27 15:51:13