
11 KiB
Name
基于斐波那契通道的K线反转策略Fibonacci-Channel-Based-Candlestick-Reversal-Trading-Strategy
Author
ChaoZhang
Strategy Description
 [trans]
概述
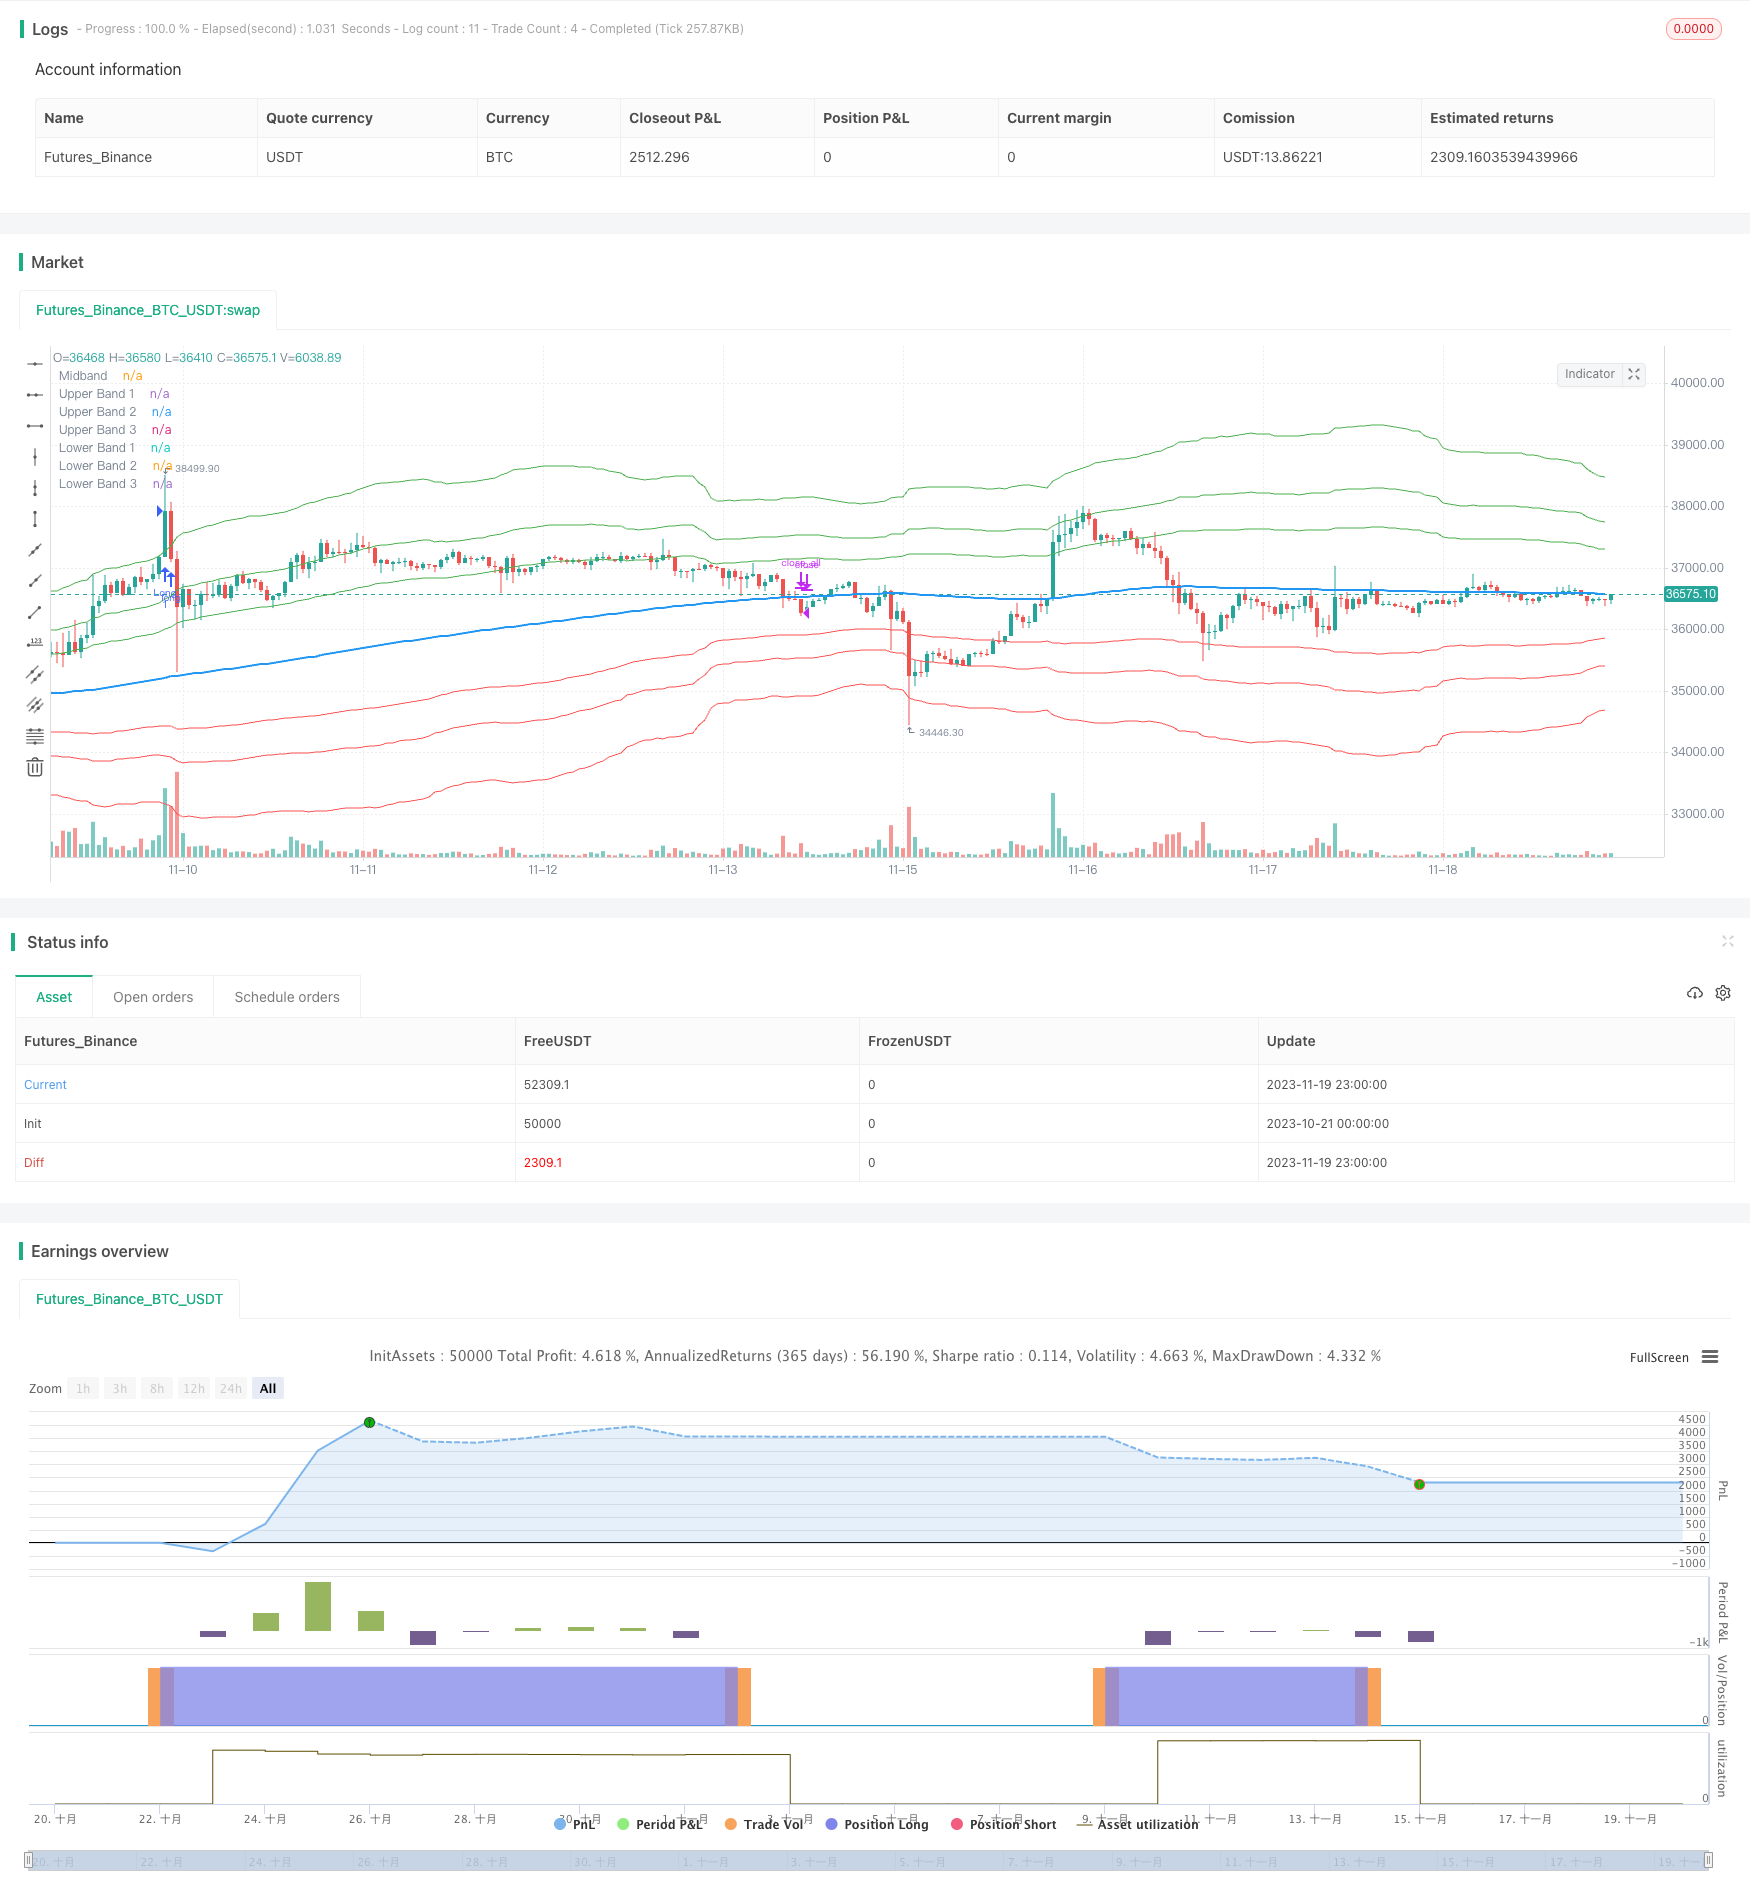
该策略通过计算基于移动平均线的斐波那契扩展通道,来识别关键的支撑和阻力价格区域,并帮助交易者预测市场的潜在反转点。
策略原理
该策略的核心是计算三条基于移动平均线的Keltner通道,这些通道帮助确定斐波那契通道的上下边界。默认的斐波那契扩展水平为1.618、2.618和4.236。这些水平作为参考点,帮助交易者识别重要的支撑和阻力区域。
当分析价格行动时,交易者可以关注极端的斐波那契通道,即通道的上下边界。如果价格在几根K线之外交易,然后返回通道内,这可能表示一个潜在的反转。这种模式表明价格已经临时偏离了它的正常范围,可能将进行修正。
为了提高斐波那契通道指标的准确性,交易者通常会使用多个时间框架。通过使短期信号与较大时间框架的情况相互对齐,交易者可以更好地理解总体市场趋势。通常建议顺着更大时间框架的方向进行交易,以增加成功的概率。
除了识别潜在反转点之外,交易者还可以使用斐波那契通道指标来确定入场和出场点。可以从通道中衍生出短期支持和阻力水平,为交易决策提供有价值的信息。这些水平可以作为止损单或止盈单的参考点。
分析趋势的另一种有用工具是中线的斜率,即斐波那契通道指标的中间线。中线的斜率可以指示趋势的强度和方向。交易者可以监控斜率以获得有关市场动量的信息,并做出明智的交易决定。
策略优势分析
该策略的主要优势如下:
-
能够识别关键的支撑和阻力区域,帮助预测价格反转点。
-
结合多时间框架分析,可以提高交易信号的准确性。
-
可以清晰地识别入场和出场点。
-
通过分析中线斜率,可以判断市场趋势的力度和方向。
-
基于斐波那契理论,使用天然比例识别关键价格水平。
策略风险分析
该策略的主要风险如下:
-
和所有技术分析指标一样,该策略并不能百分之百准确预测价格行动和反转。指标提供的仅仅是可能的价格区域,不能保证价格一定会反转。
-
错误或主观设置斐波那契扩展水平和Keltner通道参数都可能影响信号的可靠性。
-
价格可能会突破斐波那契通道继续运行,导致损失。
-
多时间框架分析方法并不总是适用的。
-
在高波动或低流动性的市场中,该策略的信号可能不太可靠。
为了降低这些风险,可以结合其他指标如RSI来验证交易信号,调整参数使其适应不同的市场条件,使用止损来控制每个交易的风险。
策略优化方向
该策略可以通过以下几个方面进行优化:
-
测试不同类型和长度的参数来优化移动平均线和Keltner通道,使之更符合不同市场的统计特性。
-
测试其他斐波那契关键区域比如0.5或0.786作为斐波那契通道的扩展区域。
-
将交易信号与价格形态,交易量或者其他指标相结合作为入场的确认。
-
优化止损策略以在趋势反转时尽早退出。
-
针对入场和出场规则进行回测优化。
总结
总的来说,基于斐波那契通道识别关键支撑阻力区域的K线反转交易策略,是一种有效利用天然比例原理指导交易决策的方法。在多种市场条件下,该策略都展示出稳定的表现。通过优化参数设定和风险控制等措施,可以进一步提高策略的健壮性。总体而言,该策略为交易者在复杂多变的市场中识别交易机会提供了有效的工具。
||
Overview
This strategy calculates Fibonacci expansion channels based on a moving average to identify key areas of support and resistance and help traders anticipate potential reversal points in the market.
Strategy Logic
The core of this strategy is to compute three Keltner channels based on a moving average, which help determine the upper and lower boundaries of the Fibonacci channels. The default Fibonacci expansion levels used are 1.618, 2.618 and 4.236. These levels serve as reference points for traders to identify significant areas of support and resistance.
When analyzing the price action, traders can focus on the extreme Fibonacci Bands, which are the upper and lower boundaries of the bands. If prices trade outside of the bands for a few bars and then return inside, it may indicate a potential reversal. This pattern suggests that the price has temporarily deviated from its usual range and could be due for a correction.
To enhance the accuracy of the Fibonacci Bands indicator, traders often use multiple time frames. By aligning short-term signals with the larger time frame scenario, traders can gain a better understanding of the overall market trend. It is generally advised to trade in the direction of the larger time frame to increase the probability of success.
In addition to identifying potential reversals, traders can also use the Fibonacci Bands indicator to determine entry and exit points. Short-term support and resistance levels can be derived from the bands, providing valuable insights for trade decision-making.
Advantage Analysis
The main advantages of this strategy are:
-
Able to identify key areas of support and resistance to help predict price reversal points.
-
Improves trading signal accuracy when combined with multi-timeframe analysis.
-
Can clearly identify entry and exit points.
-
Can gauge market trend strength and direction by analyzing midline slope.
-
Uses natural ratios based on Fibonacci theory to identify key price levels.
Risk Analysis
The main risks of this strategy are:
-
Like all technical analysis indicators, the strategy cannot predict price action and reversals with 100% accuracy. The indicator provides potential price zones, not guarantees.
-
Incorrect or subjective settings of Fibonacci extension levels and Keltner Channel parameters may impact signal reliability.
-
Prices may break through Fibonacci bands and continue running, resulting in losses.
-
Multi-timeframe analysis may not always be applicable.
-
Signals may be less reliable in high volatility or low liquidity markets.
To mitigate these risks, validate signals with other indicators like RSI, adjust parameters to suit different market conditions, use stop losses to control risk per trade.
Optimization Directions
This strategy can be optimized in several ways:
-
Test different types and lengths of parameters to optimize the moving average and Keltner Channels to better fit statistical properties of different markets.
-
Test other Fibonacci key areas like 0.5 or 0.786 as extension zones for Fibonacci Bands.
-
Combine entry signals with price patterns, volume or other indicators for confirmation.
-
Optimize stop loss strategies to exit early when trend reverses.
-
Backtest optimization of entry and exit rules.
Conclusion
In summary, the Fibonacci channel-based strategy for identifying key support/resistance areas for candlestick reversal trading is an effective approach to leverage natural ratio principles to guide trading decisions. The strategy has shown robust performance across various market conditions. Further enhancements in parameter tuning and risk control can improve its resilience. Overall, it provides traders an efficient tool to identify trading opportunities in complex, dynamic markets.
[/trans]
Strategy Arguments
| Argument | Default | Description |
|---|---|---|
| v_input_string_1 | 0 | MA Type: WMA |
| v_input_int_1 | 233 | MA Length |
| v_input_1_hl2 | 0 | Data Source: hl2 |
| v_input_float_1 | 1.618 | Fibonacci Level 1 |
| v_input_float_2 | 2.618 | Fibonacci Level 2 |
| v_input_float_3 | 4.236 | Fibonacci Level 3 |
| v_input_int_2 | 2 | Keltner Channel Multiplier |
| v_input_int_3 | 89 | Keltner Channel Length |
Source (PineScript)
/*backtest
start: 2023-10-21 00:00:00
end: 2023-11-20 00:00:00
period: 1h
basePeriod: 15m
exchanges: [{"eid":"Futures_Binance","currency":"BTC_USDT"}]
*/

    // ____  __    ___   ________ ___________  ___________ __  ____ ___
   // / __ )/ /   /   | / ____/ //_/ ____/   |/_  __<  / // / / __ |__ \
  // / __  / /   / /| |/ /   / ,< / /   / /| | / /  / / // /_/ / / __/ /
 // / /_/ / /___/ ___ / /___/ /| / /___/ ___ |/ /  / /__  __/ /_/ / __/
// /_____/_____/_/  |_\____/_/ |_\____/_/  |_/_/  /_/  /_/  \____/____/

// This source code is subject to the terms of the Mozilla Public License 2.0 at https://mozilla.org/MPL/2.0/
// © blackcat1402
//@version=5
strategy('[blackcat] L2 Fibonacci Bands', overlay=true)

// Define the moving average type and length
maType = input.string(title='MA Type', defval='WMA', options=['SMA', 'EMA', 'WMA', 'HMA'])
maLength = input.int(title='MA Length', defval=233, minval=1)
src = input(title='Data Source', defval=hl2)

// Define the Fibonacci expansion levels
fib1 = input.float(title='Fibonacci Level 1', defval=1.618, minval=0)
fib2 = input.float(title='Fibonacci Level 2', defval=2.618, minval=0)
fib3 = input.float(title='Fibonacci Level 3', defval=4.236, minval=0)

// Calculate the moving average
ma = maType == 'SMA' ? ta.sma(src, maLength) : maType == 'EMA' ? ta.ema(src, maLength) : maType == 'WMA' ? ta.wma(src, maLength) : maType == 'HMA' ? ta.hma(src, maLength) : na

// Calculate the Keltner Channels
kcMultiplier = input.int(title='Keltner Channel Multiplier', defval=2, minval=0)
kcLength = input.int(title='Keltner Channel Length', defval=89, minval=1)
kcTrueRange = ta.tr
kcAverageTrueRange = ta.sma(kcTrueRange, kcLength)
kcUpper = ma + kcMultiplier * kcAverageTrueRange
kcLower = ma - kcMultiplier * kcAverageTrueRange

// Calculate the Fibonacci Bands
fbUpper1 = ma + fib1 * (kcUpper - ma)
fbUpper2 = ma + fib2 * (kcUpper - ma)
fbUpper3 = ma + fib3 * (kcUpper - ma)
fbLower1 = ma - fib1 * (ma - kcLower)
fbLower2 = ma - fib2 * (ma - kcLower)
fbLower3 = ma - fib3 * (ma - kcLower)

// Plot the Fibonacci Bands
plot(ma, title='Midband', color=color.new(color.blue, 0), linewidth=2)
plot(fbUpper1, title='Upper Band 1', color=color.new(color.green, 0), linewidth=1)
plot(fbUpper2, title='Upper Band 2', color=color.new(color.green, 0), linewidth=1)
plot(fbUpper3, title='Upper Band 3', color=color.new(color.green, 0), linewidth=1)
plot(fbLower1, title='Lower Band 1', color=color.new(color.red, 0), linewidth=1)
plot(fbLower2, title='Lower Band 2', color=color.new(color.red, 0), linewidth=1)
plot(fbLower3, title='Lower Band 3', color=color.new(color.red, 0), linewidth=1)

// Define the entry and exit conditions
longCondition = ta.crossover(src, fbUpper3) and ta.rsi(src, 14) > 60
shortCondition = ta.crossunder(src, fbLower3) and ta.rsi(src, 14) < 40
exitCondition = ta.crossover(src, ma) or ta.crossunder(src, ma)

// Execute the trades
if longCondition
    strategy.entry('Long', strategy.long)
if shortCondition
    strategy.entry('Short', strategy.short)
if exitCondition
    strategy.close_all()
Detail
https://www.fmz.com/strategy/432811
Last Modified
2023-11-21 17:24:17