
10 KiB
Name
基于改进涡轮指标的量化交易策略Quantitative-Trading-Strategy-Based-on-Improved-Vortex-Indicator
Author
ChaoZhang
Strategy Description
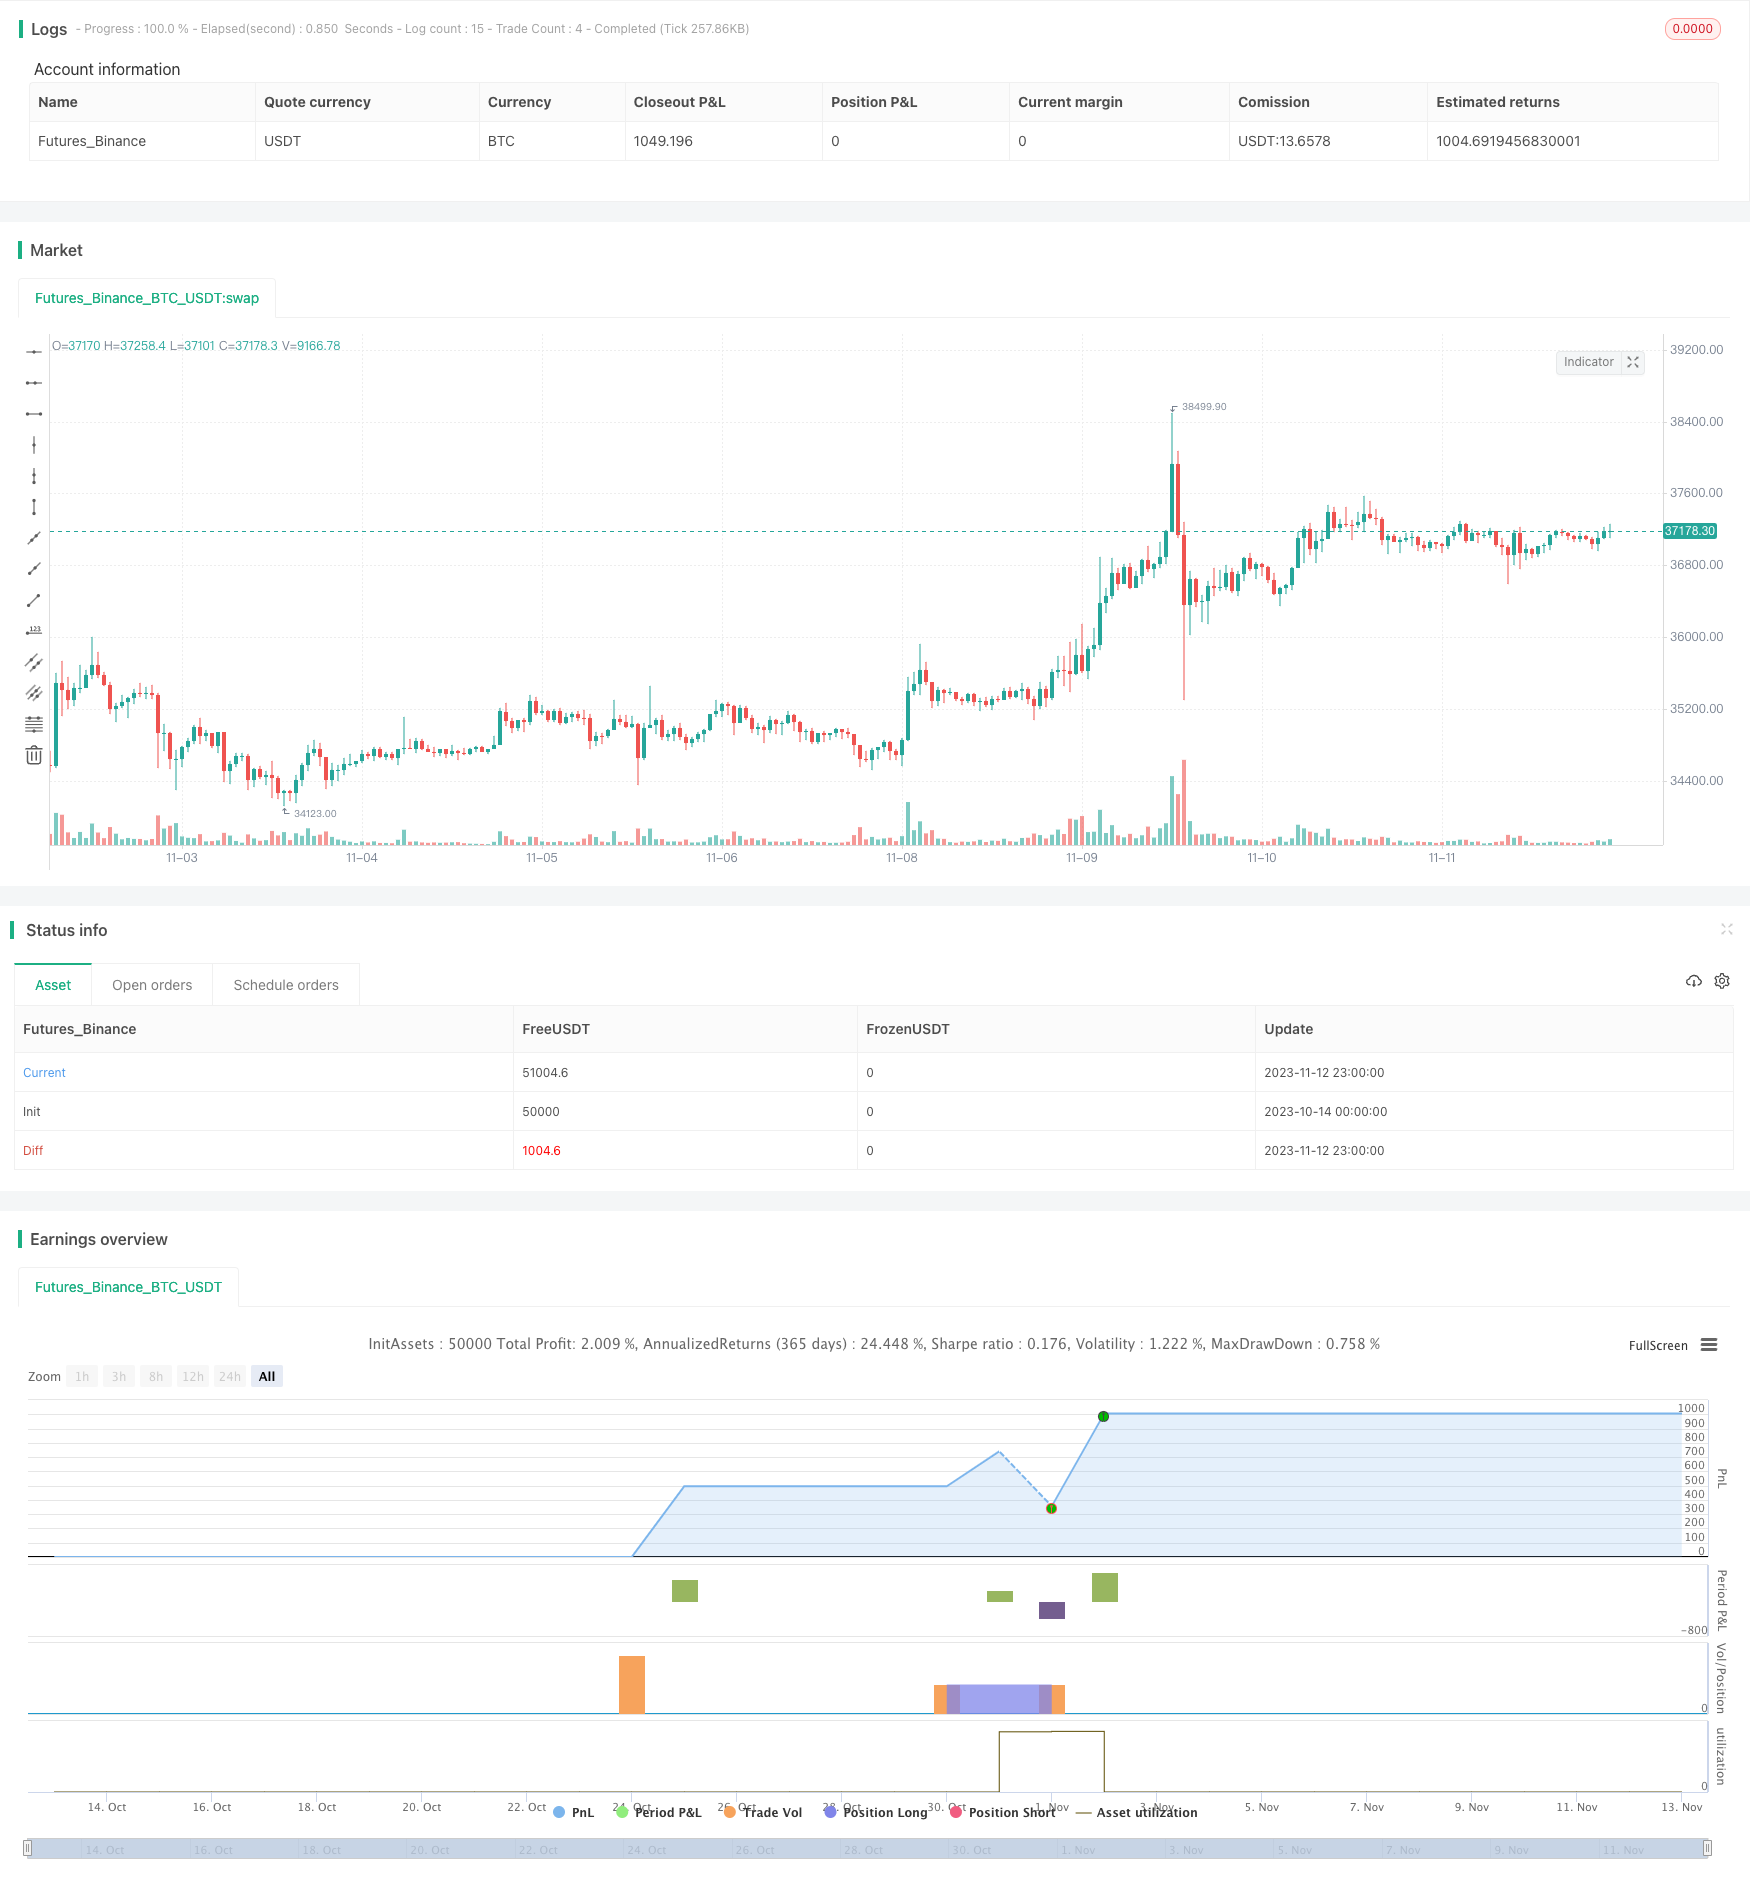
[trans]
概述
本策略为改进版的涡轮指标策略,在原有涡轮指标的基础上,增加了多项新功能,包括基于阈值进行买卖信号触发、使用EMA平滑涡轮线、添加止损止盈、实现只做多、只做空或双向交易等。该策略适用于希望利用改进涡轮指标进行量化交易的投资者。
原理
该策略的核心指标是改进版的涡轮指标。传统涡轮指标通过计算价格波动的绝对值之和,形成正负涡轮线。当正涡轮线上穿负涡轮线时,为买入信号;当负涡轮线下穿正涡轮线时,为卖出信号。
本策略对传统涡轮指标进行了升级:
-
不再仅根据涡轮线的交叉来判断买卖,而是引入阈值概念。只有当正负涡轮线之间的差价超过设定的阈值时,才会触发买卖。这可以过滤掉部分无效的小幅度交叉信号。
-
对涡轮线进行EMA平滑处理,以减少曲线的抖动。
-
添加止损止盈设置,可以预设盈亏比例,更精细控制风险。
-
可以选择只做多、只做空或双向交易,满足不同需求。
基于以上改进,该策略可以更可靠地捕捉趋势,在回测中表现出色。
优势分析
-
改进后的涡轮指标滤除无效信号,可以有效避免假突破。EMA平滑处理也有助于去噪。
-
采用阈值判断买卖信号,而非简单交叉,可以更可靠地判断趋势转折点。
-
添加止损止盈功能,可以预设盈亏比来控制单笔交易风险,符合理性交易原则。
-
可选择只做多、只做空或双向,可以灵活适应市场不同阶段,满足不同交易者的需求。
-
该策略参数设计合理,回测表现较好,具有实际运用价值。
风险分析
-
该策略主要适用于趋势性行情,在盘整市场中表现可能会受到影响。
-
涡轮线本身对股票波动较为敏感,参数设置不当可能导致过于频繁交易。
-
阈值设置过高会错过买卖点,过低会增加假信号,需要仔细测试找到最佳参数。
-
市场存在异常行情时,止损可能被突破,需要警惕此风险。
优化方向
-
可以考虑结合其他指标进行组合,在确定信号时引入更多因素判断。
-
可以测试不同股票对参数的敏感性,优化参数设置。
-
可以研究自适应止损技巧,在大趋势中随价格调整止损位。
-
可以引入机器学习等技术,训练模型自动优化参数。
-
可以探索基于该策略的指数化方法,扩大策略容量。
总结
本策略在传统涡轮指标的基础上进行了多项改进,形成一个较为成熟可靠的量化交易方案。它结合趋势判断和风险控制的优点,既可以避免零散交易的过拟合风险,也可以利用指标本身的趋势捕捉能力。通过参数优化和组合技术的应用,该策略可以进一步增强稳定性和跟踪能力。总体来说,本策略具有一定的实践价值,是涡轮指标策略的一个提升版本。
||
Overview
This strategy is an upgraded version of the Vortex Indicator strategy. Based on the original Vortex Indicator, it incorporates several new features, including triggering trades based on threshold, smoothing vortex lines with EMA, adding stop loss and take profit, implementing long-only, short-only or long/short strategies, etc. It is suitable for investors who want to apply improved Vortex Indicator in quantitative trading.
Principles
The core indicator of this strategy is the improved Vortex Indicator. The traditional Vortex Indicator forms positive and negative vortex lines by calculating the absolute sum of price fluctuations. When the positive line crosses above the negative line, it sends a buy signal. When the negative line crosses below the positive line, it sends a sell signal.
This strategy makes the following upgrades to the traditional Vortex Indicator:
-
Instead of solely relying on line crosses, it introduces the concept of threshold. Trades are triggered only when the spread between the positive and negative lines exceeds a preset threshold. This helps filter out small, insignificant crosses.
-
The vortex lines are smoothed with EMA to reduce curve jitters.
-
Stop loss and take profit functionalities are added. Loss/profit ratios can be pre-set for better risk control.
-
Traders can choose between long-only, short-only or long/short strategies to suit different needs.
With these improvements, the strategy can more reliably detect trends and performs well in backtests.
Advantage Analysis
-
The improved Vortex Indicator filters out invalid signals and avoids false breaks. EMA smoothing also helps reduce noise.
-
Using threshold for signals instead of simple crosses can more reliably detect trend reversal points.
-
The stop loss/take profit features allow pre-setting profit/loss ratios to control risks for each trade, aligning with rational trading principles.
-
Choosing between long-only, short-only or long/short provides flexibility to adapt to different market stages and suit needs of different traders.
-
The strategy has well-designed parameters and good backtest results, giving it practical value.
Risk Analysis
-
The strategy mainly works for trending markets. Performance may suffer during range-bound markets.
-
Vortex lines are inherently sensitive to price fluctuations. Improper settings may cause over-trading.
-
If threshold is set too high, it may miss trades. If set too low, it may generate false signals. Extensive testing is needed to find the optimal levels.
-
Stop loss may be taken out during black swan events. Traders need to be alert about this risk.
Optimization Directions
-
Consider combining with other indicators for signal confirmation and more comprehensive judgments.
-
Test parameter sensitivity across different stocks and optimize settings.
-
Research adaptive stop loss techniques to adjust stops along the major trend.
-
Introduce machine learning etc. to auto-optimize parameters.
-
Explore indexation methods based on this strategy to expand capacity.
Conclusion
This strategy makes multiple enhancements over the traditional Vortex Indicator and forms a relatively mature and reliable quantitative trading system. Combining trend filtering and risk control, it avoids overfit risks from scattered trades and utilizes the trend capture capabilities of the indicator itself. With further parameter optimization and combination techniques, the strategy can be made more stable and responsive. Overall, it holds practical value as an upgraded version of the Vortex Indicator strategy.
[/trans]
Strategy Arguments
| Argument | Default | Description |
|---|---|---|
| v_input_1 | 300 | Length |
| v_input_2 | 7 | EMA Length |
| v_input_3 | 16.2 | Threshold |
| v_input_4 | true | Do Short? |
| v_input_5 | true | Do Long? |
| v_input_6 | 2.5 | Stop Loss Long |
| v_input_7 | 1.5 | Take Profit Long |
| v_input_8 | 2.5 | Stop Loss Short |
| v_input_9 | 1.7 | Take Profit Short |
Source (PineScript)
/*backtest
start: 2023-10-14 00:00:00
end: 2023-11-13 00:00:00
period: 1h
basePeriod: 15m
exchanges: [{"eid":"Futures_Binance","currency":"BTC_USDT"}]
*/

// [Guz] Custom Vortex
// Custom version of the Vortex indicators that adds many features:
// -Triggers trades after a threshold is reached instead of the normal vortex lines cross (once the difference between the 2 lines is important enough)
// -Smooths the Vortex lines with an EMA
// -Adds Take Profit and Stop Loss selection
// -Adds the possibility to go Long only, Short only or both of them
// ! notice that it uses 10% position size and 0.04% trade fee, found on some crypto exchanges futures contracts
// Allows testing leverage with position size moddification (values above 100%, to be done with caution)
// Not an investment advice

//@version=4
strategy(title="%-[Guz] Vortex Indicator Custom", shorttitle="%-[Guz] Vortex Indicator Custom", overlay=true)

period_ = input(300, title="Length", minval=2)
VMP = sum( abs( high - low[1]), period_ )
VMM = sum( abs( low - high[1]), period_ )
STR = sum( atr(1), period_ )
ema_len = input(title="EMA Length", defval=7)
tresh= input(title="Threshold", defval=16.2, step=0.1)
VIP = ema(VMP / STR,ema_len)
VIM = ema(VMM / STR,ema_len)
//plot(VIP, title="VI +", color=#2962FF)
//plot(VIM, title="VI -", color=#E91E63)

condition_long = crossover(VIP-VIM, tresh/100)
condition_close = cross(VIP-VIM,0)
condition_short = crossunder(VIP-VIM, -tresh/100)

is_short=input(true,title="Do Short?")
is_long=input(true,title="Do Long?")


if (condition_long and is_long)
    strategy.entry("VortexLE", strategy.long, comment="Long Algo")
if (condition_short and is_short)
	strategy.entry("VortexSE", strategy.short, comment="Short Algo")
if (condition_close)
    strategy.close_all()

//plot(strategy.equity, title="equity", color=color.red, linewidth=2, style=plot.style_areabr)


stop_loss_long_percent = input(2.5, title="Stop Loss Long", minval=0.1, step=0.1)
stop_loss_long = (1-stop_loss_long_percent/100)*strategy.position_avg_price

take_profit_long_percent = input(1.5, title="Take Profit Long", minval=0.1, step=0.1)
take_profit_long = (1+take_profit_long_percent/100)*strategy.position_avg_price


stop_loss_short_percent = input(2.5,title="Stop Loss Short", minval=0.1, step=0.1)
stop_loss_short = (1+stop_loss_short_percent/100)*strategy.position_avg_price

take_profit_short_percent = input(1.7,title="Take Profit Short", minval=0.1, step=0.1)
take_profit_short = (1-take_profit_short_percent/100)*strategy.position_avg_price

strategy.exit("TP-SL Long", "VortexLE",  limit = take_profit_long , stop = stop_loss_long) //, trail_price = trail_price_long , trail_offset = trail_offset_long) //, trail_offset=tsl_offset_tick, trail_price=tsl_offset_tick)
strategy.exit("TP-SL Short", "VortexSE",  limit = take_profit_short , stop = stop_loss_short)
Detail
https://www.fmz.com/strategy/432100
Last Modified
2023-11-14 14:40:54