
22 KiB
Name
基于支撑阻力和动量指标的多时间框架趋势跟踪策略Trend-Following-Strategy-Based-on-Support-Resistance-and-Momentum-Indicators-Across-Multiple-Timeframes
Author
ChaoZhang
Strategy Description
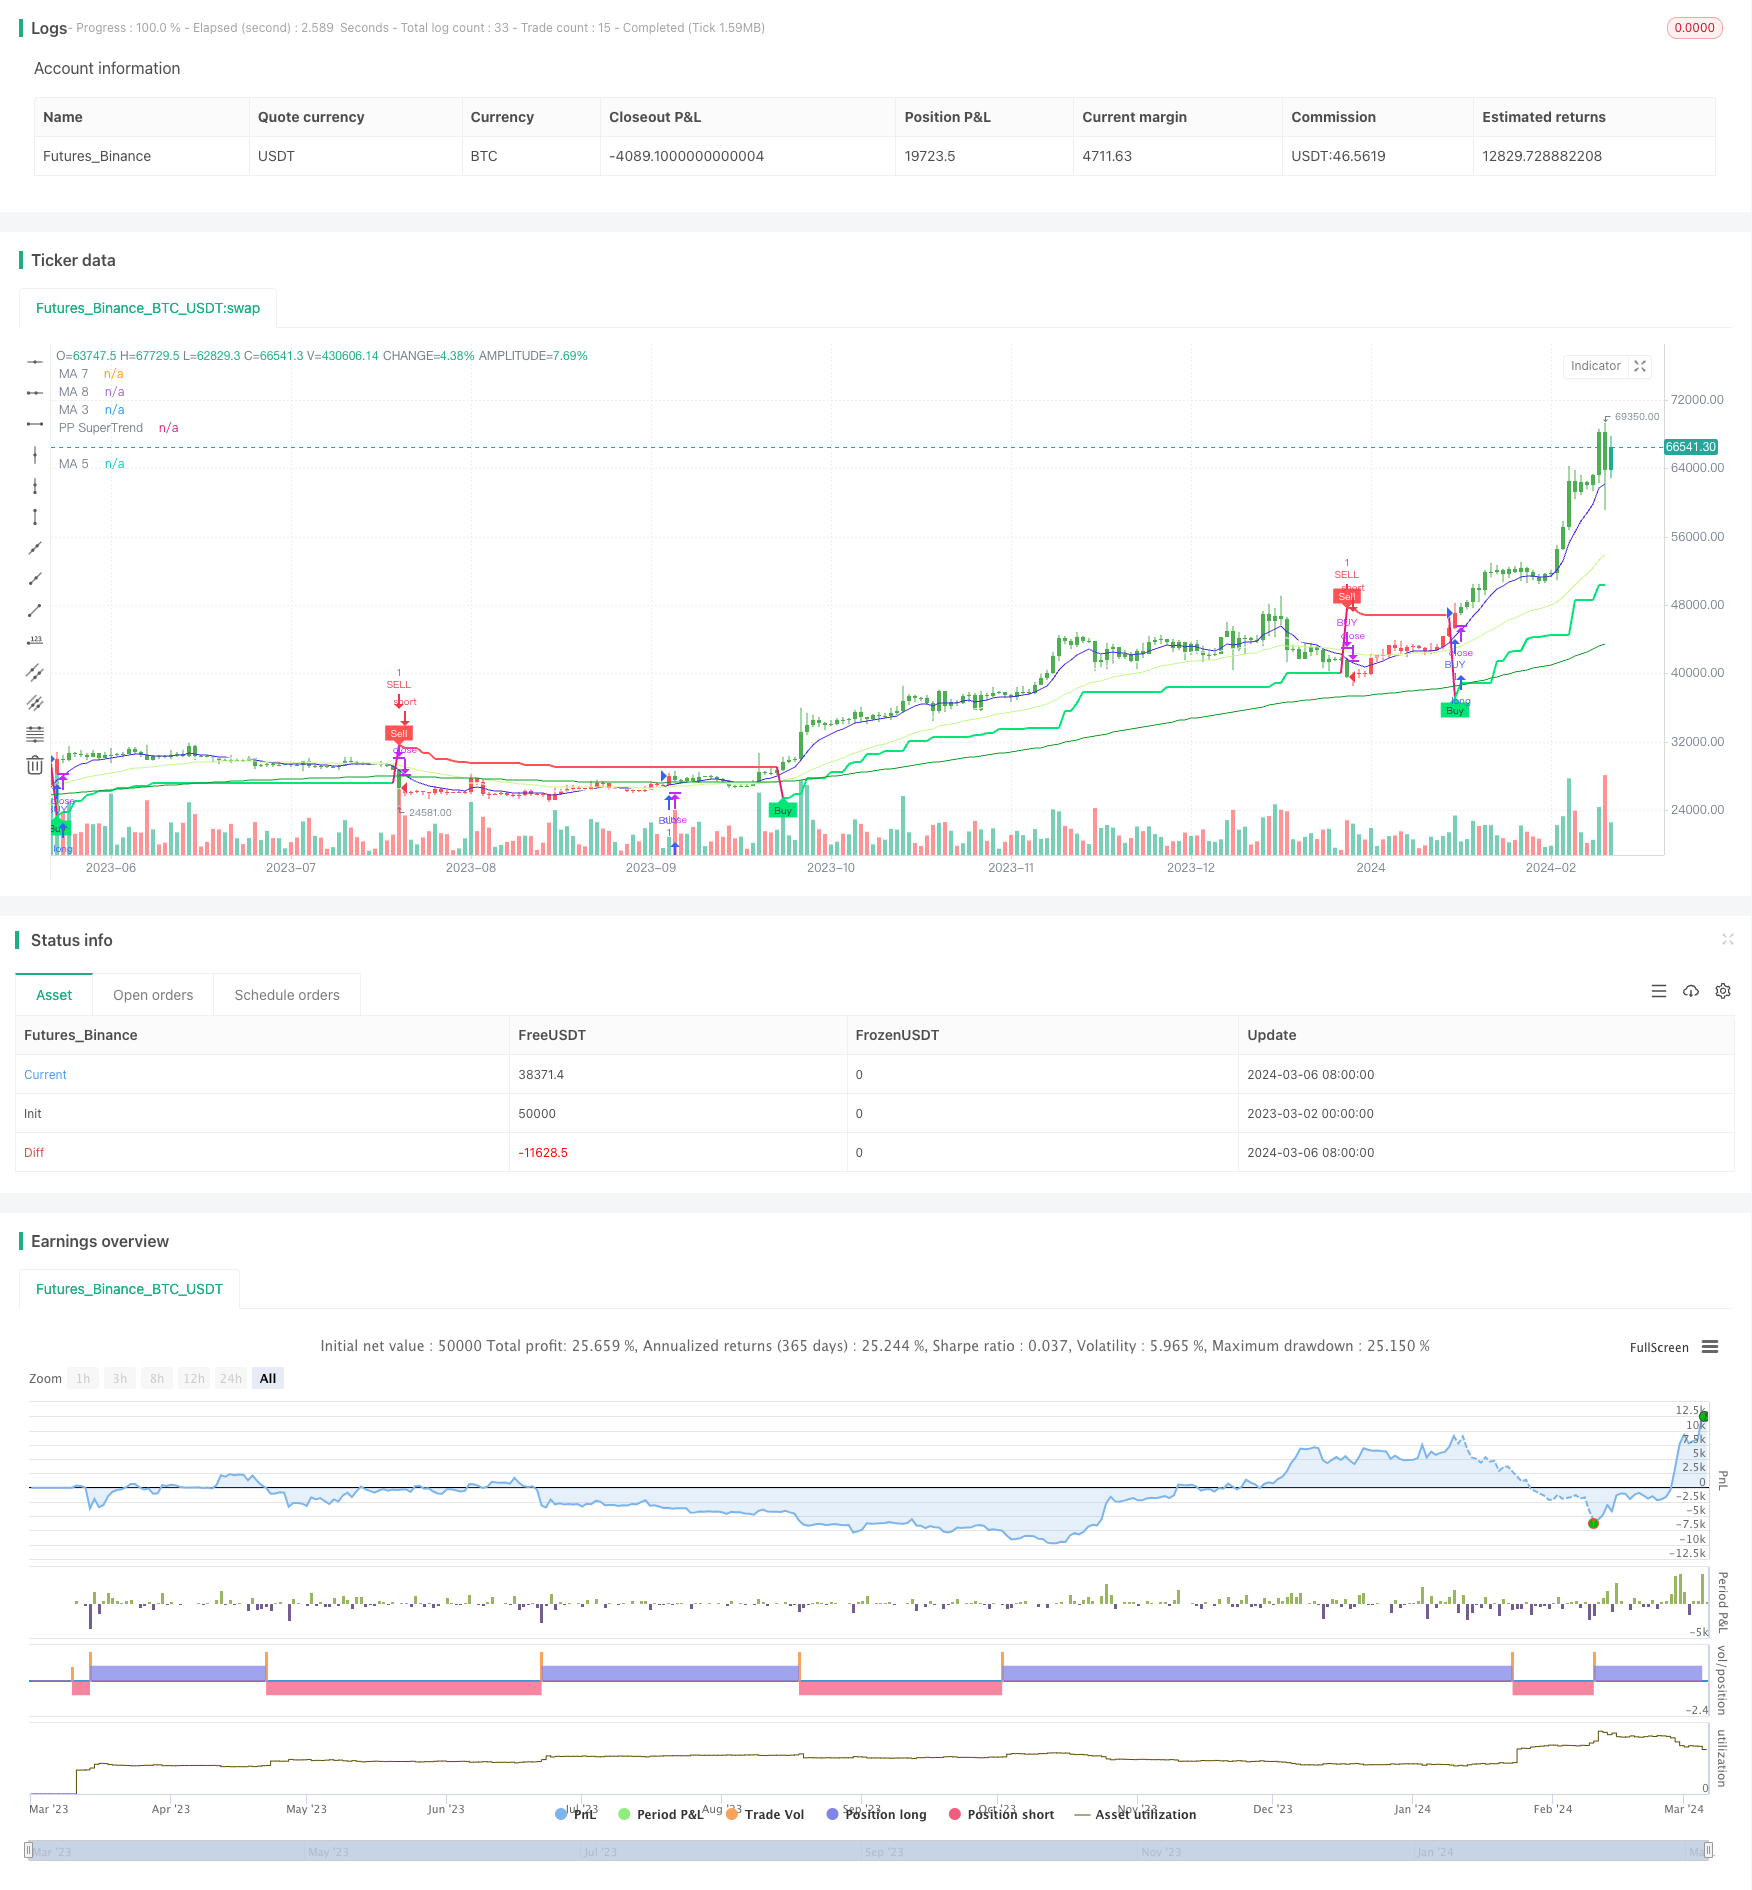 [trans]
策略概述
该策略综合利用支撑阻力位、超级趋势指标以及移动平均线等多个技术指标,在多个时间框架上综合判断趋势方向,实现了一个趋势跟踪交易系统。该策略的主要思想是:首先利用枢轴点来判断当前价格所处的支撑阻力位置,然后用超级趋势指标判断当前的趋势方向,最后用移动平均线过滤背离行情。同时,策略还支持风险控制,如设置交易时间窗口、限制最大仓位等。
策略原理
- 首先根据过去一定周期的最高最低价计算枢轴点,获得当前价格的支撑阻力位。
- 利用超级趋势指标(Supertrend)判断趋势。超级趋势由动态支撑阻力计算得到,是一个趋势跟踪指标。
- 使用ATR止损。该策略在原超级趋势基础上加入了ATR作为止损位。
- 以移动平均线作为趋势过滤。只有当趋势向上且价格在均线上方时做多,趋势向下且价格在均线下方时做空。
- 设置交易时间窗口。只在特定的时间区间内开仓,可避免在重要时间点交易。
- 多空仓位分别管理。多头和空头信号分别触发各自的开平仓逻辑。
综上,该策略在枢轴点支撑阻力、超级趋势方向、均线方向三个条件共振时开仓,任一条件失效则平仓。这有效地抓住了趋势行情,同时控制了风险。
优势分析
- 基于支撑阻力位交易的优势在于符合市场供需规律,枢轴点能动态反应市场平衡。
- 超级趋势能够有效捕捉趋势,并及时止损。ATR止损进一步控制了风险。
- 均线过滤避免了逆势交易。在趋势和均线共振时入场,胜率会更高。
- 自定义交易时间窗口在一定程度上避免了在重要时间点交易,如开盘和收盘前。
- 多头和空头信号各自独立运作,可同时持有多空仓位,更充分地利用了市场机会。
风险分析
- 频繁交易的风险。该策略可能会在震荡市频繁开平仓,造成过多的交易成本。
- 仍可能出现逆势交易。虽然该策略采取了均线过滤,但如果均线本身与大趋势相悖,仍可能出现逆势交易。
- 参数的最优化问题。策略含有诸多参数,如超级趋势的周期和乘数、均线周期等。不同参数将得到不同结果,如何选择最优参数组合是个挑战。
- 极端行情下可能失效。在极端行情下,如暴涨暴跌、流动性危机等,该策略可能无法及时止损。
优化方向
- 引入更多中长期均线,提高趋势判断的可靠性,减少频繁交易。
- 可以考虑引入波动率指标,如布林带,在高波动率市场减少交易。
- 对各项参数进行优化,找到最佳参数组合,提高策略稳定性。
- 在极端行情下设置硬止损,控制风险。此外,可考虑加入市场异常波动的判断,如价格跳空、成交量激增等,在异常时减少或停止交易。
总结
该策略综合了支撑阻力、趋势跟踪、动量过滤等多种技术分析方法,能够在趋势行情中有效获利,同时控制回撤风险。其优势在于信号明确简洁,逻辑清晰,适合在中长周期内运用。但是,该策略也存在频繁交易、参数优化难度大、极端行情下风险控制不足等问题。未来可以通过引入更多技术指标、优化参数、设置硬止损、判断异常行情等方式进一步改进。总的来说,该策略是一个较为成熟的趋势跟踪策略,经过适当优化和改进后,可以成为一个稳健的交易系统。策略思路可供借鉴,但仍需结合实际交易经验和市场特点,审慎运用。量化交易既需要数理逻辑,又离不开人的主观判断,只有二者有机结合,才能创造理想的回报。
||
Strategy Overview
This strategy combines multiple technical indicators including support/resistance levels, Supertrend, and moving averages across multiple timeframes to comprehensively determine the trend direction and implement a trend-following trading system. The main idea of this strategy is to: first, use pivot points to determine the current support/resistance levels; then, use the Supertrend indicator to identify the current trend direction; and finally, use moving averages to filter out divergence. At the same time, the strategy also supports risk control measures such as setting trading time windows and limiting maximum positions.
Strategy Principles
- First, calculate the pivot points based on the highest and lowest prices over a certain past period to obtain the current support/resistance levels.
- Use the Supertrend indicator to determine the trend. Supertrend is a trend following indicator calculated from dynamic support/resistance levels.
- Use ATR for stop loss. This strategy incorporates ATR as a stop loss level on top of the original Supertrend.
- Use moving averages as a trend filter. Only go long when the trend is up and the price is above the moving average, and only go short when the trend is down and the price is below the moving average.
- Set a trading time window. Only open positions within a specific time interval to avoid trading at important time points.
- Manage long and short positions separately. Long and short signals trigger their respective opening and closing logics independently.
In summary, this strategy enters a position when the pivot point support/resistance, Supertrend direction, and moving average direction are all in agreement, and closes the position when any one of these conditions becomes invalid. This effectively captures trending market movements while controlling risks.
Advantage Analysis
- The advantage of trading based on support/resistance levels is that it conforms to the law of supply and demand in the market, and pivot points can dynamically reflect market equilibrium.
- Supertrend can effectively capture trends and stop losses in a timely manner. ATR stop loss further controls risk.
- Moving average filtering avoids counter-trend trading. Entering the market when the trend and moving average are in sync will result in a higher win rate.
- The customizable trading time window avoids trading at important time points to a certain extent, such as before the market opens and closes.
- Long and short signals operate independently, allowing for simultaneous holding of long and short positions, thus more fully utilizing market opportunities.
Risk Analysis
- The risk of frequent trading. This strategy may frequently open and close positions in a oscillating market, resulting in excessive transaction costs.
- Counter-trend trading may still occur. Although this strategy adopts moving average filtering, if the moving average itself goes against the major trend, counter-trend trading may still occur.
- The problem of parameter optimization. The strategy contains many parameters, such as the period and multiplier of Supertrend, and the period of moving averages. Different parameters will yield different results, and choosing the optimal parameter combination is a challenge.
- May fail under extreme market conditions. In extreme market conditions, such as sharp rises and falls, liquidity crises, etc., this strategy may not be able to stop losses in a timely manner.
Optimization Directions
- Introduce more medium- and long-term moving averages to improve the reliability of trend judgment and reduce frequent trading.
- Consider introducing volatility indicators, such as Bollinger Bands, to reduce trading in high-volatility markets.
- Optimize the various parameters to find the best parameter combination and improve the stability of the strategy.
- Set a hard stop loss under extreme market conditions to control risk. In addition, consider adding judgment of abnormal market fluctuations, such as price gaps and surges in trading volume, and reduce or stop trading during abnormalities.
Summary
This strategy integrates various technical analysis methods such as support/resistance, trend tracking, and momentum filtering to effectively profit from trending markets while controlling drawdown risk. Its advantages lie in clear and concise signals, clear logic, and suitability for medium- to long-term application. However, this strategy also has problems such as frequent trading, difficulty in parameter optimization, and insufficient risk control under extreme market conditions. In the future, it can be further improved by introducing more technical indicators, optimizing parameters, setting hard stop losses, and judging abnormal market conditions. In general, this strategy is a relatively mature trend-following strategy that, with appropriate optimization and improvement, can become a robust trading system. The strategy ideas can be used for reference, but they still need to be used prudently in combination with actual trading experience and market characteristics. Quantitative trading requires both mathematical logic and human subjective judgment, and only when the two are organically combined can ideal returns be created.
[/trans]
Strategy Arguments
| Argument | Default | Description |
|---|---|---|
| v_input_1 | true | Pivot Point Period |
| v_input_2 | 4 | ATR Factor |
| v_input_3 | 72 | ATR Period |
| v_input_4 | false | Show Pivot Points |
| v_input_5 | true | Show Buy/Sell Labels |
| v_input_6 | false | Show PP Center Line |
| v_input_7 | false | Show Support/Resistance |
| v_input_8 | true | EMA |
| v_input_9 | false | Show MA 1 |
| v_input_10 | 13 | Length MA 1 |
| v_input_11 | 0 | Type MA 1: EMA |
| v_input_12_close | 0 | MA1 Source: close |
| v_input_13 | #eb9fee | Color MA 1 |
| v_input_14 | false | Show MA 2 |
| v_input_15 | 17 | Length MA 2 |
| v_input_16 | 0 | Type MA 2: EMA |
| v_input_17_close | 0 | MA2 Source: close |
| v_input_18 | #e6f141 | Color MA 2 |
| v_input_19 | true | Show MA 3 |
| v_input_20 | 34 | Length MA 3 |
| v_input_21 | 0 | Type MA 3: EMA |
| v_input_22_close | 0 | MA3 Source: close |
| v_input_23 | #c7f887 | Color MA 3 |
| v_input_24 | false | Show MA 4 |
| v_input_25 | 72 | Length MA 4 |
| v_input_26 | 0 | Type MA 4: EMA |
| v_input_27_close | 0 | MA4 Source: close |
| v_input_28 | #2f6999 | Color MA 4 |
| v_input_29 | true | Show MA 5 |
| v_input_30 | 144 | Length MA 5 |
| v_input_31 | 0 | Type MA 5: EMA |
| v_input_32_close | 0 | MA5 Source: close |
| v_input_33 | #0d9c25 | Color MA 5 |
| v_input_34 | true | Show MA 6 |
| v_input_35 | 610 | Length MA 6 |
| v_input_36 | 0 | Type MA 6: EMA |
| v_input_37_close | 0 | MA6 Source: close |
| v_input_38 | #ada198 | Color MA 6 |
| v_input_39 | true | Show MA 7 |
| v_input_40 | 8 | Length MA 7 |
| v_input_41 | 0 | Type MA 7: EMA |
| v_input_42_close | 0 | MA7 Source: close |
| v_input_43 | #4427e7 | Color MA 7 |
| v_input_44 | true | Show MA 8 |
| v_input_45 | 21 | Length MA 8 |
| v_input_46 | 0 | Type MA 8: EMA |
| v_input_47_close | 0 | MA8 Source: close |
| v_input_48 | white | Color MA 8 |
| v_input_49 | 3 | ATR Period |
| v_input_50_hlc3 | 0 | Source: hlc3 |
| v_input_51 | 4 | ATR Multiplier |
| v_input_52 | true | Change ATR Calculation Method ? |
| v_input_53 | 20 | Moving Average Period |
| v_input_54_close | 0 | Moving Average Source: close |
| v_input_55 | true | From Month |
| v_input_56 | true | From Day |
| v_input_57 | 2017 | From Year |
| v_input_58 | true | To Month |
| v_input_59 | true | To Day |
| v_input_60 | 9999 | To Year |
Source (PineScript)
/*backtest
start: 2023-03-02 00:00:00
end: 2024-03-07 00:00:00
period: 1d
basePeriod: 1h
exchanges: [{"eid":"Futures_Binance","currency":"BTC_USDT"}]
*/

//@rpcoelho
// Based on © Julien_Eche "Pivot Point Supertrend" with optional EMAs ploted
//@version=4

strategy("PPS w/ EMAs", overlay=true)

prd = input(defval = 1, title="Pivot Point Period", minval = 1, maxval = 50)
Factor=input(defval = 4, title = "ATR Factor", minval = 1, step = 0.1)
Pd=input(defval = 72, title = "ATR Period", minval=1)
showpivot = input(defval = false, title="Show Pivot Points")
showlabel = input(defval = true, title="Show Buy/Sell Labels")
showcl = input(defval = false, title="Show PP Center Line")
showsr = input(defval = false, title="Show Support/Resistance")

/////////////////////////////////////////////////////////////////////////
// Switch Board
////////////////////////////////////////////////////////////////////////
// Define the switch board title as a label (since grouping is not available)
//switchboard_group = "████ Switch Board (Turn On/Off Overlay Indicators) ████"
//label.new(bar_index, high, switchboard_group, color=color.red)
// Create input controls for EMA and VWAP switches
switch_ema = input(true, title="EMA")

/////////////////////////////////////////////////////////////////////////
// EMA Selection
////////////////////////////////////////////////////////////////////////

ma_function(source, length, type) =>
    float ma = na
    if type == 'RMA'
        ma := rma(source, length)
    else if type == 'SMA'
        ma := sma(source, length)
    else if type == 'EMA'
        ma := ema(source, length)
    else if type == 'WMA'
        ma := wma(source, length)
    else if type == 'HMA'
        ma := length < 2 ? hma(source, 2) : hma(source, length)
    else
        ma := vwma(source, length)
    ma

// Moving Averages Line Title
//ma_group = "██████████ MAs Line ██████████"

// Inputs for MA 1
len1bool = input(false, title="Show MA 1")
len1 = input(13, title="Length MA 1")
ma_1_type = input("EMA", title="Type MA 1", options=["RMA", "SMA", "EMA", "WMA", "HMA", "VWMA"])
src_ma1 = input(title="MA1 Source", type=input.source, defval=close)
ma_1_colour = input(color.rgb(235, 159, 238), title="Color MA 1")

// Inputs for MA 2
len2bool = input(false, title="Show MA 2")
len2 = input(17, title="Length MA 2")
ma_2_type = input("EMA", title="Type MA 2", options=["RMA", "SMA", "EMA", "WMA", "HMA", "VWMA"])
src_ma2 = input(title="MA2 Source", type=input.source, defval=close)
ma_2_colour = input(color.rgb(230, 241, 65), title="Color MA 2")

// Inputs for MA 3
len3bool = input(true, title="Show MA 3")
len3 = input(34, title="Length MA 3")
ma_3_type = input("EMA", title="Type MA 3", options=["RMA", "SMA", "EMA", "WMA", "HMA", "VWMA"])
src_ma3 = input(title="MA3 Source", type=input.source, defval=close)
ma_3_colour = input(#c7f887, title="Color MA 3")

// Inputs for MA 4
len4bool = input(false, title="Show MA 4")
len4 = input(72, title="Length MA 4")
ma_4_type = input("EMA", title="Type MA 4", options=["RMA", "SMA", "EMA", "WMA", "HMA", "VWMA"])
src_ma4 = input(title="MA4 Source", type=input.source, defval=close)
ma_4_colour = input(#2f6999, title="Color MA 4")

// Inputs for MA 5
len5bool = input(true, title="Show MA 5")
len5 = input(144, title="Length MA 5")
ma_5_type = input("EMA", title="Type MA 5", options=["RMA", "SMA", "EMA", "WMA", "HMA", "VWMA"])
src_ma5 = input(title="MA5 Source", type=input.source, defval=close)
ma_5_colour = input(color.rgb(13, 156, 37), title="Color MA 5")

// Inputs for MA 6
len6bool = input(true, title="Show MA 6")
len6 = input(610, title="Length MA 6")
ma_6_type = input("EMA", title="Type MA 6", options=["RMA", "SMA", "EMA", "WMA", "HMA", "VWMA"])
src_ma6 = input(title="MA6 Source", type=input.source, defval=close)
ma_6_colour = input(color.rgb(173, 161, 152), title="Color MA 6")

// Inputs for MA 7
len7bool = input(true, title="Show MA 7")
len7 = input(8, title="Length MA 7")
ma_7_type = input("EMA", title="Type MA 7", options=["RMA", "SMA", "EMA", "WMA", "HMA", "VWMA"])
src_ma7 = input(title="MA7 Source", type=input.source, defval=close)
ma_7_colour = input(color.rgb(68, 39, 231), title="Color MA 7")

// Inputs for MA 8
len8bool = input(true, title="Show MA 8")
len8 = input(21, title="Length MA 8")
ma_8_type = input("EMA", title="Type MA 8", options=["RMA", "SMA", "EMA", "WMA", "HMA", "VWMA"])
src_ma8 = input(title="MA8 Source", type=input.source, defval=close)
ma_8_colour = input(color.white, title="Color MA 8")

ema1 = security(syminfo.tickerid, timeframe.period, ma_function(src_ma1, len1, ma_1_type))
ema2 = security(syminfo.tickerid, timeframe.period, ma_function(src_ma2, len2, ma_2_type))
ema3 = security(syminfo.tickerid, timeframe.period, ma_function(src_ma3, len3, ma_3_type))
ema4 = security(syminfo.tickerid, timeframe.period, ma_function(src_ma4, len4, ma_4_type))
ema5 = security(syminfo.tickerid, timeframe.period, ma_function(src_ma5, len5, ma_5_type))
ema6 = security(syminfo.tickerid, timeframe.period, ma_function(src_ma6, len6, ma_6_type))
ema7 = security(syminfo.tickerid, timeframe.period, ma_function(src_ma7, len7, ma_7_type))
ema8 = security(syminfo.tickerid, timeframe.period, ma_function(src_ma8, len8, ma_8_type))

plot(len1bool and switch_ema ? ema1:na, color=ma_1_colour, linewidth=1, title='MA 1')
plot(len2bool and switch_ema? ema2:na, color=ma_2_colour, linewidth=1, title='MA 2')
plot(len3bool and switch_ema? ema3:na, color=ma_3_colour, linewidth=1, title='MA 3')
plot(len4bool and switch_ema? ema4:na, color=ma_4_colour, linewidth=1, title='MA 4')
plot(len5bool and switch_ema? ema5:na, color=ma_5_colour, linewidth=1, title='MA 5')
plot(len6bool and switch_ema? ema6:na, color=ma_6_colour, linewidth=2, title='MA 6')
plot(len7bool and switch_ema? ema7:na, color=ma_7_colour, linewidth=1, title='MA 7')
plot(len8bool and switch_ema? ema8:na, color=ma_8_colour, linewidth=1, title='MA 8')


// get Pivot High/Low
float ph = pivothigh(prd, prd)
float pl = pivotlow(prd, prd)

// drawl Pivot Points if "showpivot" is enabled
plotshape(ph and showpivot, text="H",  style=shape.labeldown, color=na, textcolor=color.red, location=location.abovebar, transp=0, offset = -prd)
plotshape(pl and showpivot, text="L",  style=shape.labeldown, color=na, textcolor=color.lime, location=location.belowbar, transp=0, offset = -prd)

// calculate the Center line using pivot points
var float center = na
float lastpp = ph ? ph : pl ? pl : na
if lastpp
    if na(center)
        center := lastpp
    else
        //weighted calculation
        center := (center * 2 + lastpp) / 3

// upper/lower bands calculation
Up = center - (Factor * atr(Pd))
Dn = center + (Factor * atr(Pd))

// get the trend
float TUp = na
float TDown = na
Trend = 0
TUp := close[1] > TUp[1] ? max(Up, TUp[1]) : Up
TDown := close[1] < TDown[1] ? min(Dn, TDown[1]) : Dn
Trend := close > TDown[1] ? 1: close < TUp[1]? -1: nz(Trend[1], 1)
Trailingsl = Trend == 1 ? TUp : TDown

// plot the trend
linecolor = Trend == 1 and nz(Trend[1]) == 1 ? color.lime : Trend == -1 and nz(Trend[1]) == -1 ? color.red : na
plot(Trailingsl, color = linecolor ,  linewidth = 2, title = "PP SuperTrend")

plot(showcl ? center : na, color = showcl ? center < hl2 ? color.blue : color.red : na)

// check and plot the signals
bsignal = Trend == 1 and Trend[1] == -1
ssignal = Trend == -1 and Trend[1] == 1
plotshape(bsignal and showlabel ? Trailingsl : na, title="Buy", text="Buy", location = location.absolute, style = shape.labelup, size = size.tiny, color = color.lime, textcolor = color.black, transp = 0)
plotshape(ssignal and showlabel ? Trailingsl : na, title="Sell", text="Sell", location = location.absolute, style = shape.labeldown, size = size.tiny, color = color.red, textcolor = color.white, transp = 0)

//get S/R levels using Pivot Points
float resistance = na
float support = na
support := pl ? pl : support[1]
resistance := ph ? ph : resistance[1]

// if enabled then show S/R levels
plot(showsr and support ? support : na, color = showsr and support ? color.lime : na, style = plot.style_circles, offset = -prd)
plot(showsr and resistance ? resistance : na, color = showsr and resistance ? color.red : na, style = plot.style_circles, offset = -prd)

// Trend Filter from SuperTrend Long Strategy
Periods = input(title="ATR Period", type=input.integer, defval=3)
src = input(hlc3, title="Source")
Multiplier = input(title="ATR Multiplier", type=input.float, step=0.1, defval=4.0)
changeATR = input(title="Change ATR Calculation Method ?", type=input.bool, defval=true)

// Combine the SuperTrend calculations
atr2 = sma(tr, Periods)
atr = changeATR ? atr(Periods) : atr2

up = src - (Multiplier * atr)
up1 = nz(up[1], up)
up := close[1] > up1 ? max(up, up1) : up

dn = src + (Multiplier * atr)
dn1 = nz(dn[1], dn)
dn := close[1] < dn1 ? min(dn, dn1) : dn

trend = 1
trend := nz(trend[1], trend)
trend := trend == -1 and close > dn1 ? 1 : trend == 1 and close < up1 ? -1 : trend

// Moving Average as Trend Filter
periodes_ma = input(title="Moving Average Period", type=input.integer, defval=20)
src_ma = input(title="Moving Average Source", type=input.source, defval=close)
ma = sma(src_ma, periodes_ma)

// Strategy Entry Conditions
FromMonth = input(defval = 1, title = "From Month", minval = 1, maxval = 12)
FromDay   = input(defval = 1, title = "From Day", minval = 1, maxval = 31)
FromYear  = input(defval = 2017, title = "From Year", minval = 999)
ToMonth   = input(defval = 1, title = "To Month", minval = 1, maxval = 12)
ToDay     = input(defval = 1, title = "To Day", minval = 1, maxval = 31)
ToYear    = input(defval = 9999, title = "To Year", minval = 999)

start     = timestamp(FromYear, FromMonth, FromDay, 00, 00)
finish    = timestamp(ToYear, ToMonth, ToDay, 23, 59)

window()  => true

// Combined entry conditions
longCondition = (trend == 1 and trend[1] == -1 and close > ma) or (bsignal and window())
shortCondition = (trend == -1 and trend[1] == 1 and close < ma) or (ssignal and window())

if (longCondition)
    strategy.entry("BUY", strategy.long)

if (shortCondition)
    strategy.close("BUY")
    strategy.entry("SELL", strategy.short)

buy1 = barssince((trend == 1 and trend[1] == -1 and close > ma) or (bsignal and window()))
sell1 = barssince((trend == -1 and trend[1] == 1 and close < ma) or (ssignal and window()))
color1 = buy1[1] < sell1[1] ? color.green : buy1[1] > sell1[1] ? color.red : na
barcolor(color1)
Detail
https://www.fmz.com/strategy/444042
Last Modified
2024-03-08 17:41:26