
8.0 KiB
Name
基于支持位和趋势EMA的多空策略-Support-Level-and-Trend-EMA-Based-Long-Strategy
Author
ianzeng123
Strategy Description
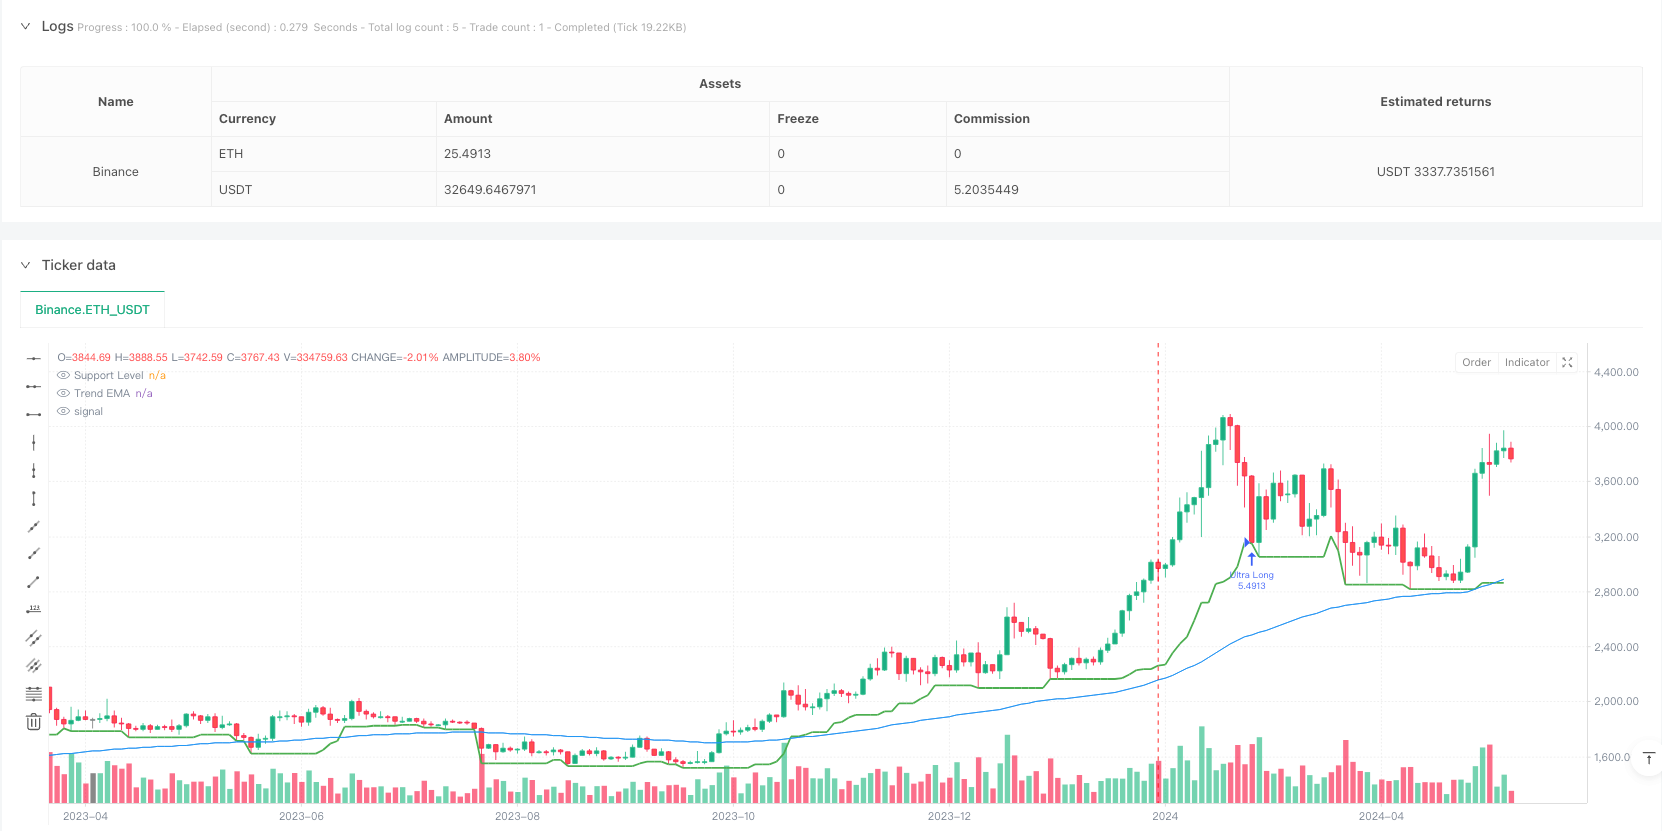
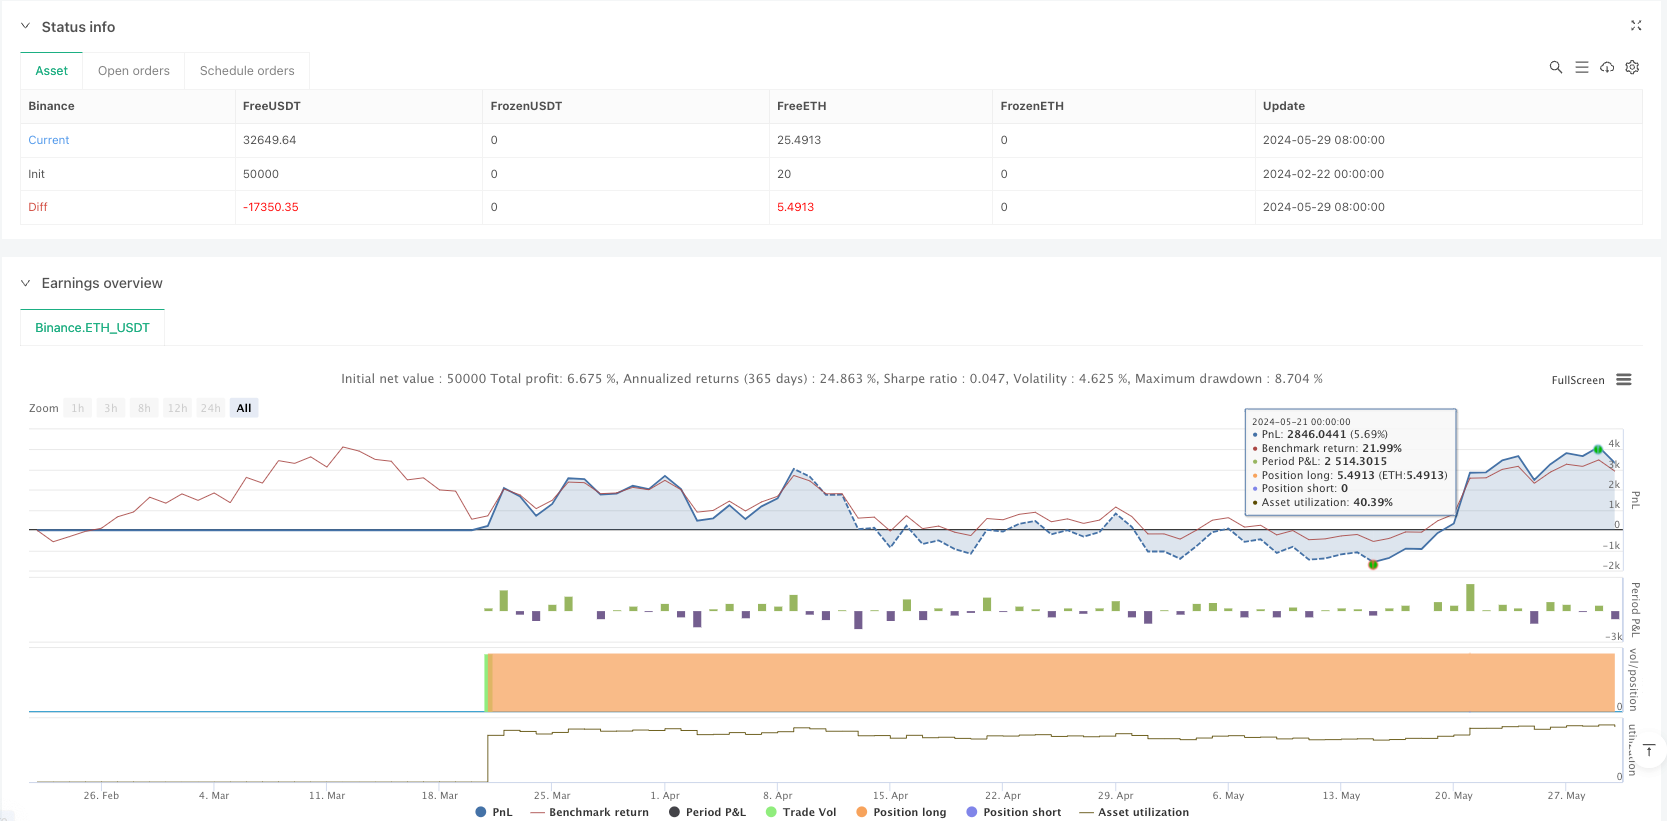
[trans]
概述
这是一个基于支撑位和趋势EMA的多头策略。策略通过识别市场趋势和关键支撑位来寻找最佳入场机会,结合ATR动态止损和分段获利来实现风险管理。该策略主要关注价格在上升趋势中回调到支撑位的情况,通过设定合理的风险回报比来提高交易的成功率。
策略原理
策略使用100周期EMA作为趋势判断指标,当价格位于EMA之上时确认上升趋势。同时计算10个周期的最低价作为短期支撑位,当价格回调到支撑位附近(支撑位+0.5*ATR)时寻找入场机会。入场后采用分段获利方式,在5倍ATR处获利了结50%仓位,剩余仓位在10倍ATR处完全了结,同时设置1倍ATR作为动态止损。每笔交易风险控制在账户总值的3%以内,通过动态计算仓位大小来实现风险管理。
策略优势
- 趋势跟随特性:通过EMA判断趋势,避免逆势交易
- 动态支撑位:使用最近10周期低点作为支撑,能更好地反映市场当前状态
- 灵活的风险管理:基于ATR的动态止损和获利目标,适应市场波动
- 分段获利机制:在不同价格水平分批了结,既保证盈利又不错过大行情
- 精确的仓位控制:根据止损距离动态计算仓位,实现风险的量化管理
策略风险
- 假突破风险:支撑位附近可能出现假突破,建议增加确认指标
- 趋势反转风险:EMA指标存在滞后性,在趋势转折点容易造成损失
- 过度交易风险:频繁的支撑位触发可能导致过度交易
- 滑点风险:在剧烈波动时可能面临较大滑点 解决方案:
- 增加趋势确认指标
- 优化入场条件
- 设置交易间隔限制
- 调整止损范围
策略优化方向
- 多维度趋势判断:结合多个时间周期的趋势指标,提高趋势判断准确性
- 入场条件优化:增加成交量、波动率等辅助指标作为入场过滤条件
- 动态参数优化:根据市场状态自适应调整各项参数
- 增加市场情绪指标:引入VIX等市场情绪指标,优化交易时机
- 完善止盈机制:根据市场波动情况动态调整获利目标
总结
该策略通过结合趋势跟随和支撑位回调建立了一个完整的交易系统,并通过分段获利和动态止损实现了风险管理。策略的核心优势在于其完善的风险控制机制和清晰的交易逻辑,但仍需要在实践中不断优化参数和入场条件,以适应不同的市场环境。建议交易者在实盘使用时先进行充分的回测,并结合市场经验对策略进行个性化调整。 ||
Overview
This is a long-only strategy based on support levels and trend EMA. The strategy identifies optimal entry points by recognizing market trends and key support levels, combining ATR-based dynamic stop-loss and staged profit-taking for risk management. It focuses on price pullbacks to support levels during uptrends and aims to achieve high success rates through reasonable risk-reward ratios.
Strategy Principle
The strategy uses a 100-period EMA as a trend indicator, confirming an uptrend when price is above EMA. It calculates 10-period lows as short-term support levels and looks for entry opportunities when price pulls back near support (support + 0.5*ATR). After entry, it implements staged profit-taking, closing 50% position at 5x ATR and the remainder at 10x ATR, with a 1x ATR dynamic stop-loss. Risk is controlled within 3% of account equity per trade through dynamic position sizing.
Strategy Advantages
- Trend-following characteristics: Uses EMA for trend identification, avoiding counter-trend trades
- Dynamic support levels: Uses recent 10-period lows as support, better reflecting current market conditions
- Flexible risk management: ATR-based dynamic stop-loss and profit targets, adapting to market volatility
- Staged profit-taking: Gradual position closure at different price levels, securing profits while maintaining upside potential
- Precise position sizing: Dynamic calculation based on stop-loss distance, achieving quantified risk management
Strategy Risks
- False breakout risk: Potential false signals near support levels, additional confirmation indicators recommended
- Trend reversal risk: EMA lag may cause losses at trend turning points
- Overtrading risk: Frequent support level triggers may lead to excessive trading
- Slippage risk: Significant slippage possible during volatile periods Solutions:
- Add trend confirmation indicators
- Optimize entry conditions
- Set trading interval restrictions
- Adjust stop-loss ranges
Strategy Optimization Directions
- Multi-dimensional trend analysis: Incorporate multiple timeframe trend indicators for improved accuracy
- Entry condition optimization: Add volume, volatility, and other auxiliary indicators as entry filters
- Dynamic parameter optimization: Adaptive parameter adjustment based on market conditions
- Market sentiment integration: Include VIX and other sentiment indicators to optimize timing
- Enhanced profit-taking: Dynamic adjustment of profit targets based on market volatility
Summary
The strategy establishes a complete trading system by combining trend following and support level pullbacks, implementing risk management through staged profit-taking and dynamic stop-loss. Its core strengths lie in comprehensive risk control mechanisms and clear trading logic, but continuous optimization of parameters and entry conditions is needed for different market environments. Traders are advised to conduct thorough backtesting before live implementation and make personalized adjustments based on market experience.[/trans]
Source (PineScript)
/*backtest
start: 2024-02-22 00:00:00
end: 2024-05-30 00:00:00
period: 2d
basePeriod: 2d
exchanges: [{"eid":"Binance","currency":"ETH_USDT"}]
*/

//@version=5
strategy("Ultra-Profitable SMC Long-Only Strategy", shorttitle="Ultra_Profit_SMC", overlay=true)

// User Inputs
emaTrendLength = input.int(100, title="Trend EMA Length")  // Faster EMA to align with aggressive trends
supportLookback = input.int(10, title="Support Lookback Period")  // Short-term support zones
atrLength = input.int(14, title="ATR Length")
atrMultiplierSL = input.float(1.0, title="ATR Multiplier for Stop-Loss")
atrMultiplierTP1 = input.float(5.0, title="ATR Multiplier for TP1")
atrMultiplierTP2 = input.float(10.0, title="ATR Multiplier for TP2")
riskPercent = input.float(3.0, title="Risk per Trade (%)", step=0.1)

// Calculate Indicators
emaTrend = ta.ema(close, emaTrendLength)  // Trend EMA
supportLevel = ta.lowest(low, supportLookback)  // Support Level
atr = ta.atr(atrLength)  // ATR

// Entry Conditions
isTrendingUp = close > emaTrend  // Price above Trend EMA
nearSupport = close <= supportLevel + (atr * 0.5)  // Price near support zone
longCondition = isTrendingUp and nearSupport

// Dynamic Stop-Loss and Take-Profit Levels
longStopLoss = supportLevel - (atr * atrMultiplierSL)
takeProfit1 = close + (atr * atrMultiplierTP1)  // Partial Take-Profit at 5x ATR
takeProfit2 = close + (atr * atrMultiplierTP2)  // Full Take-Profit at 10x ATR

// Position Sizing
capital = strategy.equity
tradeRisk = riskPercent / 100 * capital
positionSize = tradeRisk / (close - longStopLoss)

// Execute Long Trades
if (longCondition)
    strategy.entry("Ultra Long", strategy.long, qty=positionSize)

// Exit Conditions
strategy.exit("Partial Exit", from_entry="Ultra Long", limit=takeProfit1, qty_percent=50)  // Exit 50% at TP1
strategy.exit("Full Exit", from_entry="Ultra Long", limit=takeProfit2, qty_percent=100, stop=longStopLoss)  // Exit the rest at TP2

// Plot Indicators
plot(emaTrend, color=color.blue, title="Trend EMA")
plot(supportLevel, color=color.green, title="Support Level", linewidth=2)
Detail
https://www.fmz.com/strategy/483049
Last Modified
2025-02-21 10:56:01