
11 KiB
Name
基于抛物线指标和移动平均线的多空趋势判断策略EMA-Parabolic-Trend-Following-Strategy
Author
ChaoZhang
Strategy Description
 [trans]
概述
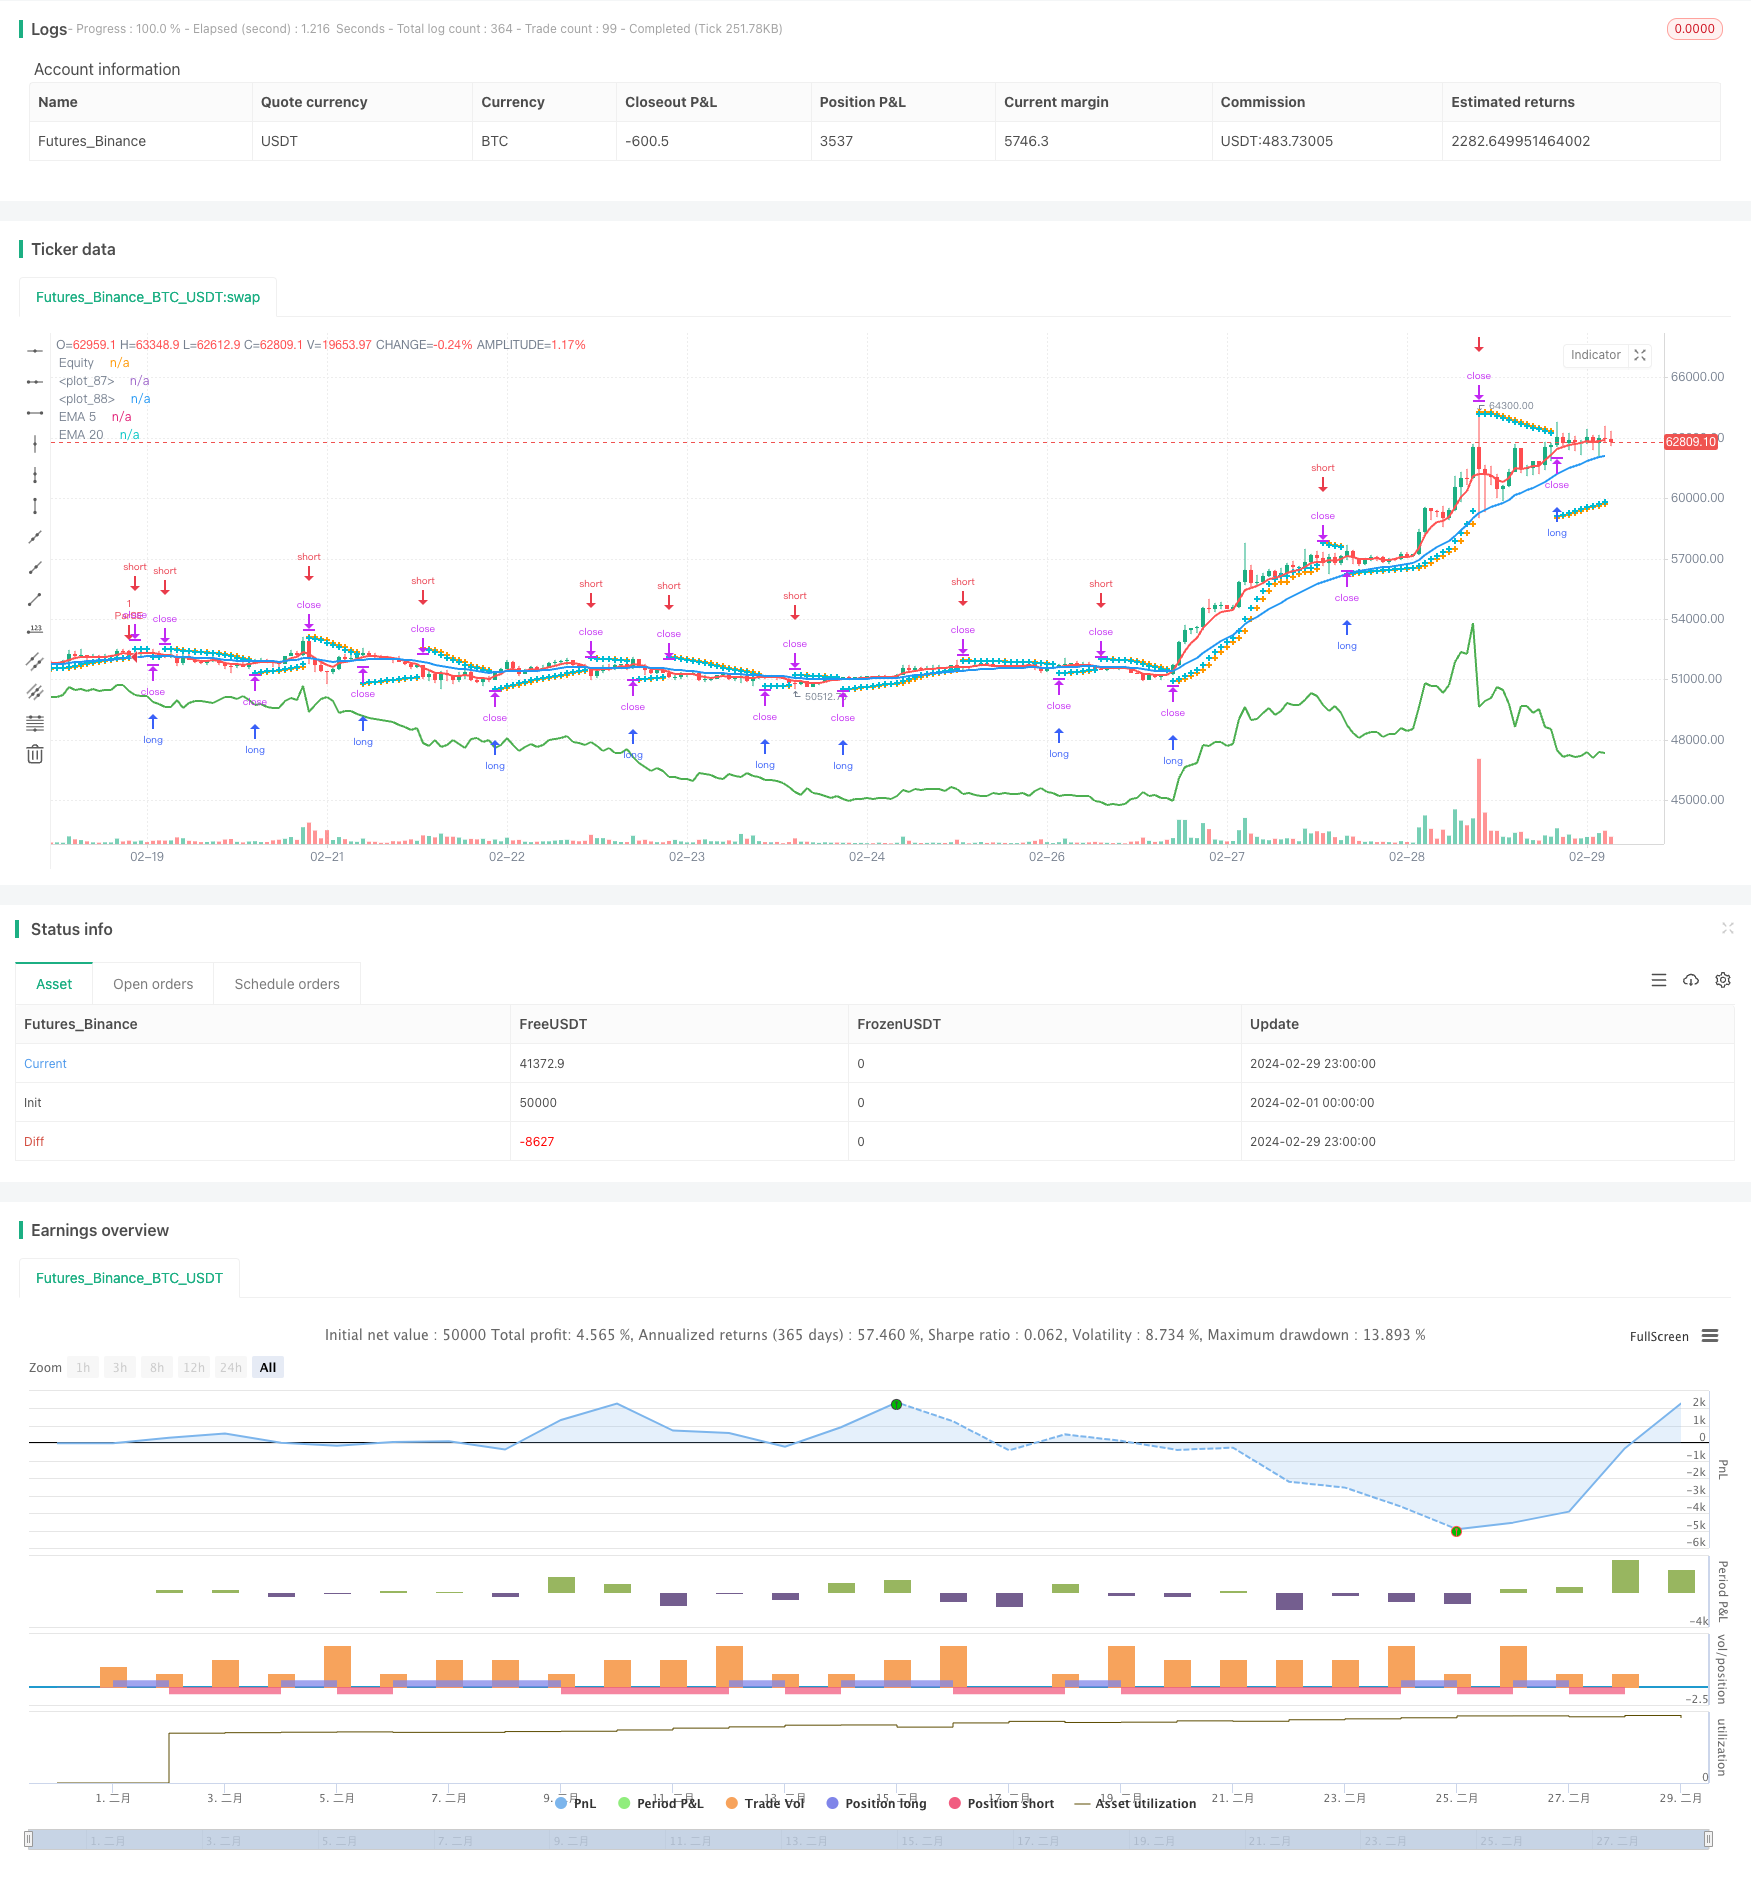
EPTS策略是一种基于抛物线指标(Parabolic SAR)和两条不同周期移动平均线(EMA)的趋势跟踪策略。该策略利用抛物线指标判断当前市场的趋势方向,同时结合快慢两条移动平均线的相对位置关系,产生开仓信号。策略的主要思想是"趋势跟随",即在上升趋势中做多,在下降趋势中做空,以期获得稳定的收益。
策略原理
-
抛物线指标(Parabolic SAR)用于判断当前市场趋势的方向。当抛物线在K线上方时,市场处于下降趋势;当抛物线在K线下方时,市场处于上升趋势。
-
两条不同周期的指数移动平均线(EMA)用于确认趋势和产生开仓信号。本策略使用5日EMA和20日EMA。当5日EMA在20日EMA上方时,认为市场处于上升趋势;反之,则认为市场处于下降趋势。
-
开仓条件:当抛物线和EMA均显示上升趋势时,产生做多信号;当抛物线和EMA均显示下降趋势时,产生做空信号。
-
平仓条件:当抛物线突破K线时,平掉当前持仓,等待下一个开仓信号。
-
止损:开仓时,将止损价格设置为当前抛物线的位置。随着抛物线的移动,动态调整止损位置,实现移动止损。
通过抛物线指标和EMA的结合使用,EPTS策略能够较好地捕捉市场趋势,并在趋势反转时及时平仓,控制风险。同时,动态止损的设置进一步降低了策略的回撤风险。
优势分析
-
趋势跟踪:EPTS策略基于趋势跟随的思想,能够有效捕捉市场的主要趋势,获取稳定收益。
-
动态止损:策略采用抛物线作为动态止损位,随着趋势的发展不断调整止损位置,有效控制了风险。
-
双重确认:通过抛物线和EMA的双重确认,提高了开仓信号的可靠性,减少了假信号。
-
简单易用:策略逻辑清晰,参数设置简单,易于理解和实施。
风险分析
-
震荡市:在震荡市场中,趋势不明显,可能会产生较多的假信号,导致频繁交易和较大回撤。
-
趋势反转:当市场趋势突然反转时,策略可能会延迟平仓,承受一定的损失。
-
参数设置:策略的表现受到参数设置的影响,不同的参数可能会导致不同的结果。
优化方向
-
引入更多指标:在现有的抛物线和EMA基础上,引入其他趋势类指标,如MACD、ADX等,提高趋势判断的准确性。
-
优化入场条件:对开仓条件进行优化,如考虑价格与EMA的距离、交易量等因素,提高开仓信号的质量。
-
动态参数优化:根据市场状况的变化,动态调整策略参数,如抛物线的步长、EMA的周期等,以适应不同的市场环境。
-
加入仓位管理:根据市场趋势的强度和账户风险,动态调整仓位大小,在控制风险的同时提高收益。
总结
EPTS策略是一个基于抛物线指标和移动平均线的趋势跟踪策略,通过捕捉市场主要趋势,并及时平仓以控制风险,从而获取稳定收益。该策略逻辑清晰,易于实施,适合趋势明显的市场环境。但在震荡市中,策略可能面临较大回撤风险,需要结合其他指标和优化方法来提高策略的适应性和稳健性。此外,合理的参数设置和仓位管理也是策略成功运行的关键。总的来说,EPTS策略为趋势跟踪提供了一个简单有效的思路,但仍需根据实际市场状况进行优化和改进,以期获得更好的策略表现。
||
Overview
The EPTS strategy is a trend-following strategy based on the Parabolic SAR indicator and two exponential moving averages (EMAs) with different periods. The strategy uses the Parabolic SAR indicator to determine the current market trend direction and generates entry signals by considering the relative positions of the fast and slow EMAs. The main idea behind the strategy is "trend following," which means going long in an uptrend and short in a downtrend to achieve stable returns.
Strategy Principles
-
The Parabolic SAR indicator is used to determine the direction of the current market trend. When the parabolic is above the candlesticks, the market is in a downtrend; when the parabolic is below the candlesticks, the market is in an uptrend.
-
Two exponential moving averages (EMAs) with different periods are used to confirm the trend and generate entry signals. This strategy uses a 5-day EMA and a 20-day EMA. When the 5-day EMA is above the 20-day EMA, the market is considered to be in an uptrend; otherwise, it is considered to be in a downtrend.
-
Entry conditions: When both the Parabolic SAR and EMAs indicate an uptrend, a long signal is generated; when both the Parabolic SAR and EMAs indicate a downtrend, a short signal is generated.
-
Exit conditions: When the Parabolic SAR crosses the candlesticks, the current position is closed, and the strategy waits for the next entry signal.
-
Stop-loss: When entering a position, the stop-loss price is set at the current position of the Parabolic SAR. As the Parabolic SAR moves, the stop-loss position is dynamically adjusted, implementing a trailing stop-loss.
By combining the Parabolic SAR indicator and EMAs, the EPTS strategy can effectively capture market trends and close positions in a timely manner when the trend reverses, controlling risk. Additionally, the dynamic stop-loss setting further reduces the strategy's drawdown risk.
Advantages
-
Trend following: The EPTS strategy is based on the idea of trend following, which can effectively capture the main trends in the market and achieve stable returns.
-
Dynamic stop-loss: The strategy uses the Parabolic SAR as a dynamic stop-loss, adjusting the stop-loss position as the trend develops, effectively controlling risk.
-
Dual confirmation: By using dual confirmation from the Parabolic SAR and EMAs, the reliability of entry signals is improved, reducing false signals.
-
Simple and easy to use: The strategy logic is clear, and parameter settings are simple, making it easy to understand and implement.
Risk Analysis
-
Choppy markets: In choppy markets where trends are not obvious, the strategy may generate more false signals, leading to frequent trades and larger drawdowns.
-
Trend reversals: When market trends suddenly reverse, the strategy may delay closing positions, incurring some losses.
-
Parameter settings: The performance of the strategy is influenced by parameter settings, and different parameters may lead to different results.
Optimization Directions
-
Introduce more indicators: In addition to the existing Parabolic SAR and EMAs, introduce other trend-related indicators such as MACD and ADX to improve the accuracy of trend identification.
-
Optimize entry conditions: Optimize the entry conditions by considering factors such as the distance between the price and EMAs, trading volume, etc., to improve the quality of entry signals.
-
Dynamic parameter optimization: Dynamically adjust strategy parameters based on changes in market conditions, such as the step size of the Parabolic SAR and the periods of the EMAs, to adapt to different market environments.
-
Incorporate position sizing: Dynamically adjust position sizes based on the strength of market trends and account risk to control risk while improving returns.
Summary
The EPTS strategy is a trend-following strategy based on the Parabolic SAR indicator and moving averages. By capturing the main market trends and closing positions in a timely manner to control risk, it aims to achieve stable returns. The strategy logic is clear and easy to implement, suitable for market environments with clear trends. However, in choppy markets, the strategy may face significant drawdown risks and needs to be combined with other indicators and optimization methods to improve its adaptability and robustness. In addition, reasonable parameter settings and position sizing are also key to the successful operation of the strategy. Overall, the EPTS strategy provides a simple and effective approach to trend following, but still requires optimization and improvement based on actual market conditions to achieve better strategy performance. [/trans]
Strategy Arguments
| Argument | Default | Description |
|---|---|---|
| v_input_1 | 0.02 | start |
| v_input_2 | 0.02 | increment |
| v_input_3 | 0.2 | maximum |
| v_input_4 | 20 | EMA 20 Length |
| v_input_5 | 5 | EMA 5 Length |
Source (PineScript)
/*backtest
start: 2024-02-01 00:00:00
end: 2024-02-29 23:59:59
period: 1h
basePeriod: 15m
exchanges: [{"eid":"Futures_Binance","currency":"BTC_USDT"}]
*/

//@version=5
strategy("febin2024", overlay=true)

// Parabolic SAR Parameters
start = input(0.02)
increment = input(0.02)
maximum = input(0.2)

// EMA Parameters
ema20_length = input(20, title="EMA 20 Length")
ema5_length = input(5, title="EMA 5 Length")

// Calculate EMAs
ema20 = ta.ema(close, ema20_length)
ema5 = ta.ema(close, ema5_length)

// Parabolic SAR Logic
var bool uptrend = na
var float EP = na
var float SAR = na
var float AF = start
var float nextBarSAR = na

if bar_index > 0
    firstTrendBar = false
    SAR := nextBarSAR
    if bar_index == 1
        float prevSAR = na
        float prevEP = na
        lowPrev = low[1]
        highPrev = high[1]
        closeCur = close
        closePrev = close[1]
        if closeCur > closePrev
            uptrend := true
            EP := high
            prevSAR := lowPrev
            prevEP := high
        else
            uptrend := false
            EP := low
            prevSAR := highPrev
            prevEP := low
        firstTrendBar := true
        SAR := prevSAR + start * (prevEP - prevSAR)
    if uptrend
        if SAR > low
            firstTrendBar := true
            uptrend := false
            SAR := math.max(EP, high)
            EP := low
            AF := start
    else
        if SAR < high
            firstTrendBar := true
            uptrend := true
            SAR := math.min(EP, low)
            EP := high
            AF := start
    if not firstTrendBar
        if uptrend
            if high > EP
                EP := high
                AF := math.min(AF + increment, maximum)
        else
            if low < EP
                EP := low
                AF := math.min(AF + increment, maximum)
    if uptrend
        SAR := math.min(SAR, low[1])
        if bar_index > 1
            SAR := math.min(SAR, low[2])
    else
        SAR := math.max(SAR, high[1])
        if bar_index > 1
            SAR := math.max(SAR, high[2])
    nextBarSAR := SAR + AF * (EP - SAR)
    if barstate.isconfirmed
        if uptrend
            strategy.entry("ParSE", strategy.short, stop=nextBarSAR, comment="ParSE")
            strategy.cancel("ParLE")
        else
            strategy.entry("ParLE", strategy.long, stop=nextBarSAR, comment="ParLE")
            strategy.cancel("ParSE")

// Plot Parabolic SAR
plot(SAR, style=plot.style_cross, linewidth=3, color=color.orange)
plot(nextBarSAR, style=plot.style_cross, linewidth=3, color=color.aqua)

// Plot EMAs
plot(ema20, color=color.blue, linewidth=2, title="EMA 20")
plot(ema5, color=color.red, linewidth=2, title="EMA 5")

// Equity Plot
plot(strategy.equity, title="Equity", color=color.green, linewidth=2)
Detail
https://www.fmz.com/strategy/446334
Last Modified
2024-03-27 17:59:11