
12 KiB
Name
基于成交量变化率的多空交替周期震荡器策略Volume-Difference-Delta-Cycle-Oscillator-Trading-Strategy
Author
ChaoZhang
Strategy Description
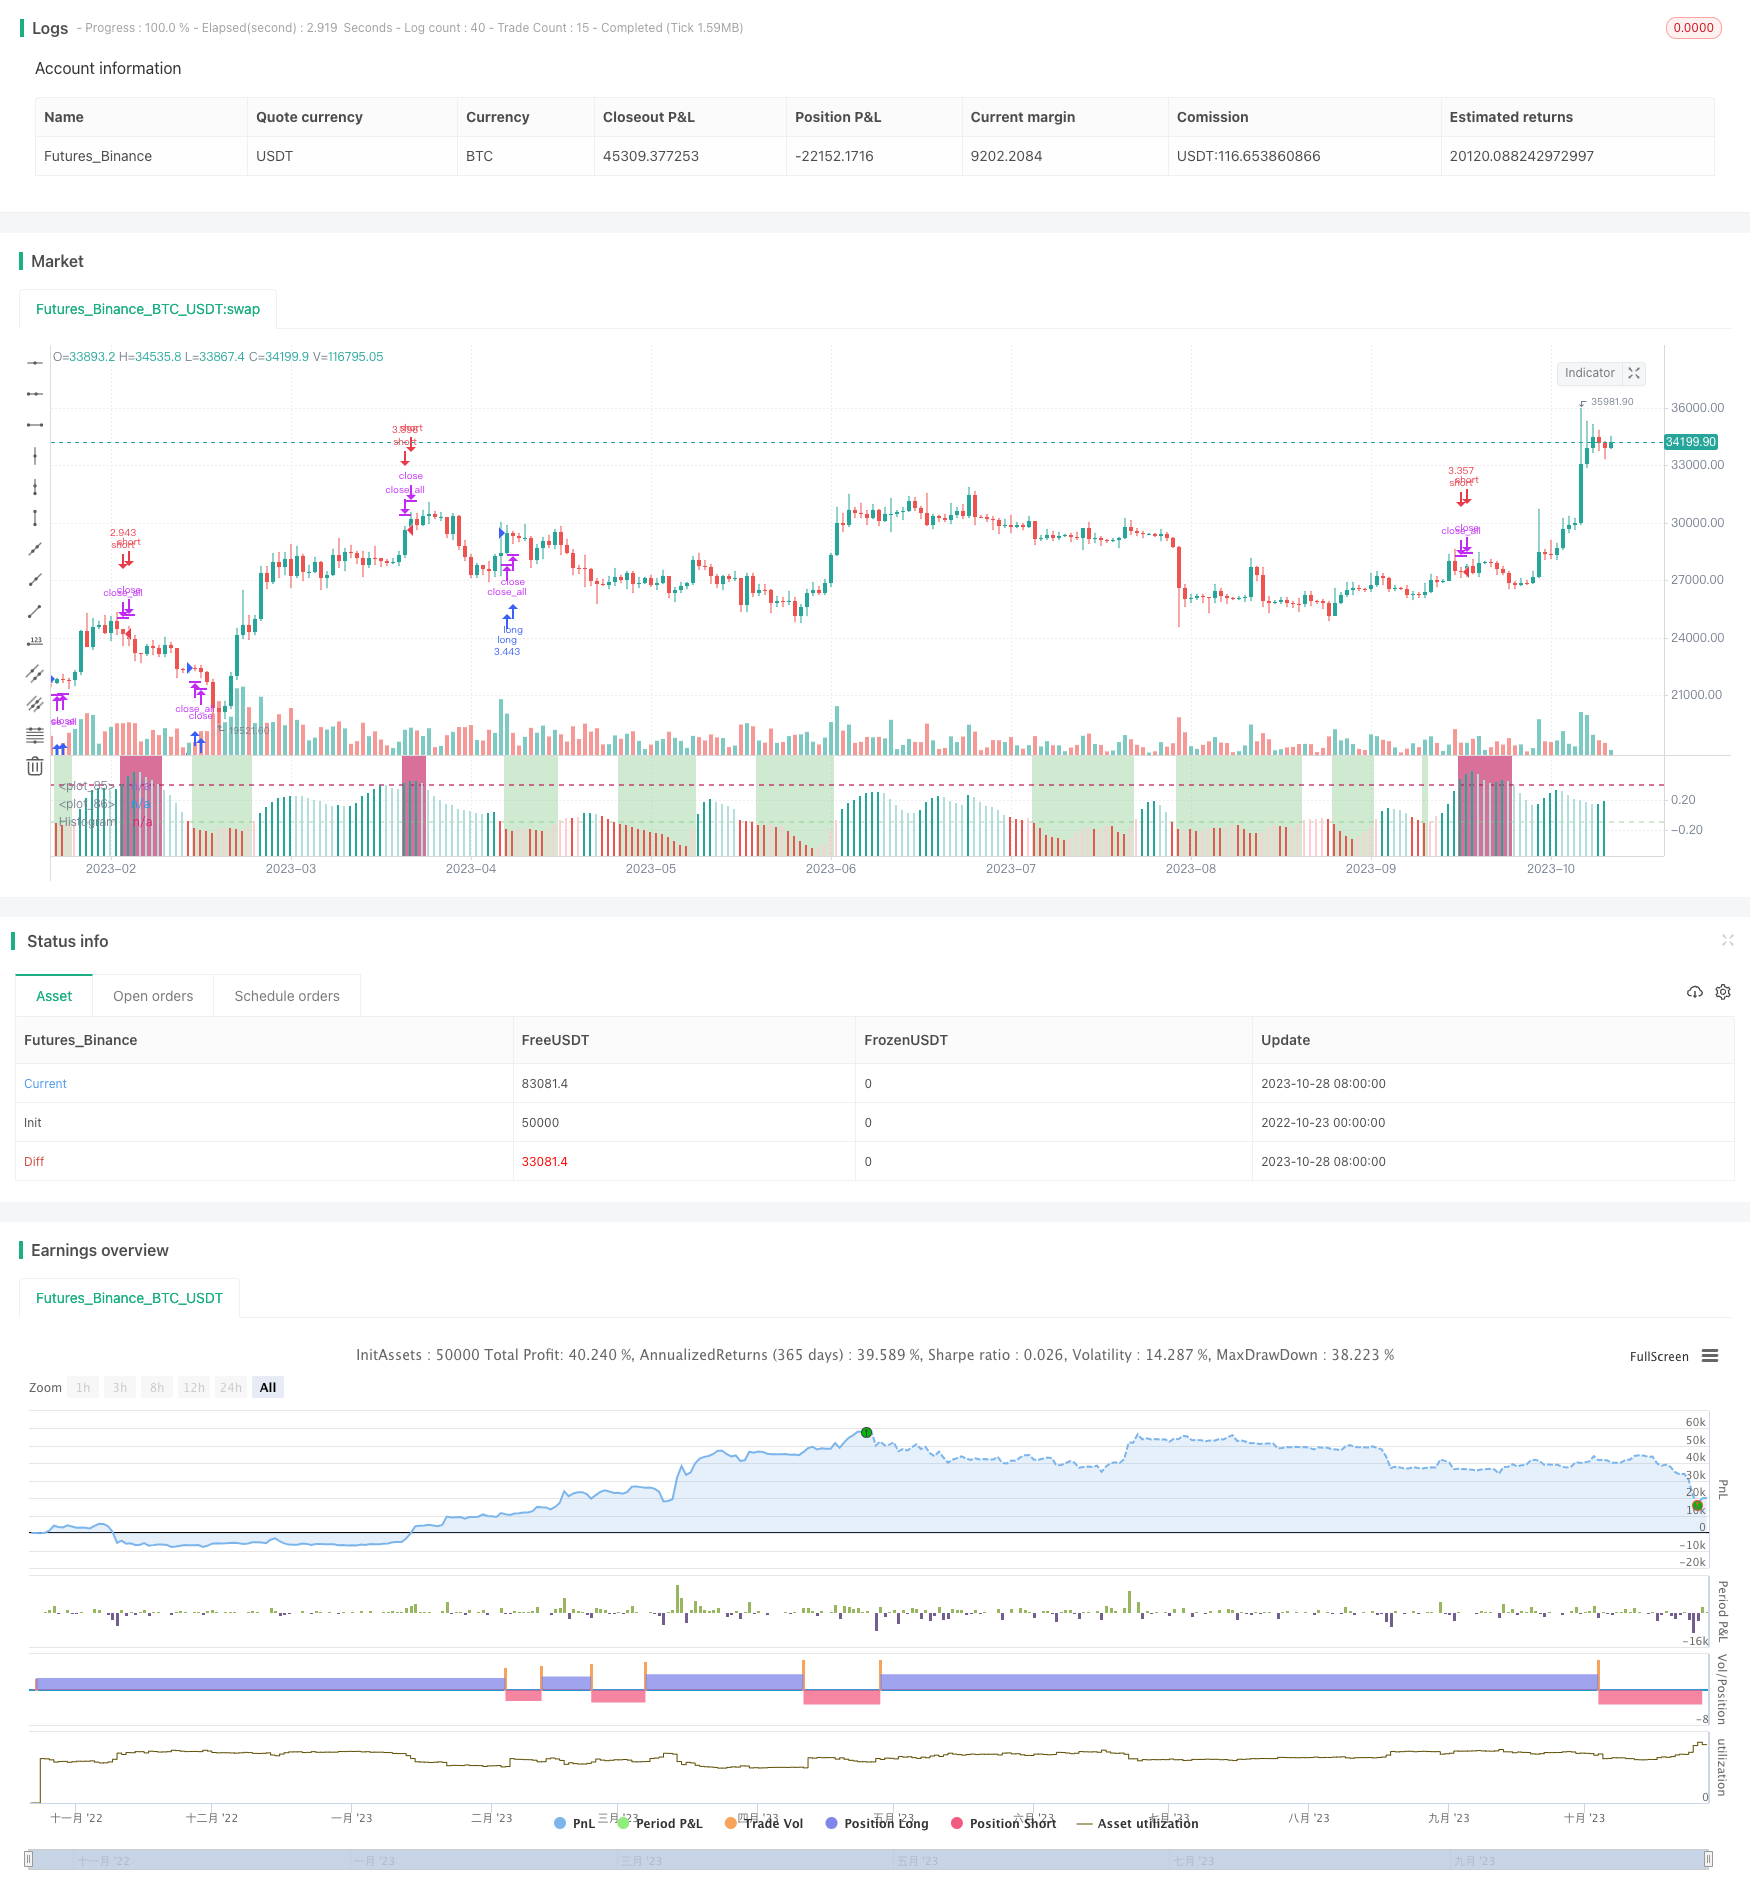 [trans]
概述
该策略通过计算成交量变化率的变化率,来判断多空周期的转换,属于量价背离类策略。它结合成交量的动量指标和价格的布林带,判断成交量变化对价格的领先效应,以捕捉趋势的转折点。
策略原理
-
计算成交量变化率的变化率(成交量差值指标的变化率),得到基于成交量动量的指标nresult。
-
对nresult计算布林带,得到代表成交量动量标准差的bbr。
-
对收盘价计算布林带,得到代表价格标准差的bbr1。
-
计算两者的差值hist,即成交量动量标准差减去价格标准差,作为最终指标。
-
当hist上穿0时为空头入场点,下穿0时为多头入场点。
该策略通过计算成交量变化率的变化率,放大了成交量变化对价格的领先效应。当成交量出现反转,而价格还没有反转时,hist会上穿或下穿0,产生交易信号。它能提前判断价格趋势的转折点。
策略优势
-
该策略是基于成交量变化率的量价背离策略,能够提前反映价格趋势的转折点。
-
计算成交量变化率的变化率,放大了成交量变化对价格的领先效应,交易效果更优。
-
结合成交量动量指标与价格指标的布林带,使交易信号更可靠。
-
采用三次指数平滑处理Hist数据,使信号更准确、平滑。
-
设置超买超卖线,并配合长空停损限价单,可有效控制风险。
-
可自定义的参数较多,如布林带长度、标准差倍数、Hist数据平滑参数等,可进行策略优化。
策略风险
-
成交量数据不一定能真实反映市场交易情况,可能被操纵。
-
量价背离不一定持续,价格可能出现突破不反转的情况。
-
参数设置不当可能导致交易频繁或信号不准。
-
需注意防止成交量异常的假信号。
-
需警惕趋势坚强时的反转信号产生错误交易。
可通过优化参数,结合其他指标进行过滤,设置止损止盈确保风险可控。
策略优化方向
-
优化布林带参数,使信号更稳定。
-
结合趋势指标过滤信号,避免逆势交易。
-
增加其他指标确认,如MACD等,防止假信号。
-
利用AI技术对参数进行自适应优化。
-
增加止损止盈动态调整模块,优化资金管理。
-
结合机器学习判断量价背离成功率,提高信号质量。
总结
该策略通过计算成交量变化率的变化率,放大成交量变化对价格的领先效应,能够提前判断价格趋势的转折点。相比单一的成交量指标,具有更高的可靠性和准确性。但也需要注意防范成交量被操纵和量价背离突破的风险,通过参数优化、指标过滤等手段控制风险。未来可运用AI技术进行自适应参数优化,进一步提升策略的稳定性和收益率。
||
Overview
This strategy judges the conversion of bull and bear cycles by calculating the rate of change of volume change, which belongs to volume-price divergence strategies. It combines the momentum indicator of volume and Bollinger Bands of price to determine the leading effect of volume change on price and capture turning points of trends.
Trading Logic
-
Calculate the rate of change of volume change (the rate of change of Volume Difference Indicator), to get the volume momentum based indicator nresult.
-
Calculate Bollinger Bands of nresult to get bbr representing the standard deviation of volume momentum.
-
Calculate Bollinger Bands of close price to get bbr1 representing the standard deviation of price.
-
Calculate the difference hist between the two, which is the standard deviation of volume momentum minus the standard deviation of price, as the final indicator.
-
When hist crosses above 0, it is the short entry signal, and when crossing below 0, it is the long entry signal.
By calculating the rate of change of volume change, the leading effect of volume change on price is amplified. When volume reverses while price has not reversed yet, hist will cross above or below 0, generating trading signals. It can predict the turning points of price trends in advance.
Advantages
-
This strategy is a volume-price divergence strategy based on the rate of change of volume, which can reflect the turning points of price trends in advance.
-
Calculating the rate of change of volume change amplifies the leading effect of volume change on price, resulting in better trading performance.
-
Combining volume momentum indicators with Bollinger Bands of price makes trading signals more reliable.
-
Using triple exponential smoothing on Hist data makes signals more accurate and smooth.
-
Setting overbought/oversold lines and long/short stop loss/take profit orders helps control risks effectively.
-
Many customizable parameters like Bollinger Bands length, standard deviation multiplier and Hist smoothing factors enable strategy optimization.
Risks
-
Volume data may not truly reflect market trading and could be manipulated.
-
Volume-price divergence may not persist, and price may breakout without reversing.
-
Improper parameter settings may cause over-trading or inaccurate signals.
-
Beware of false signals from abnormal volume data.
-
Reversal signals should be avoided when the trend is strong.
Risks can be mitigated by optimizing parameters, adding other filters, and setting stop loss/take profit.
Enhancement Opportunities
-
Optimize Bollinger Bands parameters for more stable signals.
-
Add trend filter to avoid trading against the trend.
-
Incorporate other indicators like MACD for signal confirmation.
-
Utilize AI to auto-optimize parameters adaptively.
-
Add dynamic stop loss/take profit to optimize risk management.
-
Apply machine learning to determine volume-price divergence success rate for higher signal quality.
Conclusion
This strategy amplifies the leading effect of volume change on price by calculating the rate of change of volume change, enabling early detection of trend turning points. Compared to single volume indicators, it has higher reliability and accuracy. But risks like volume manipulation and divergence breakout should be guarded against via parameter optimization, indicator filters etc. In the future, AI can be leveraged for adaptive parameter optimization to further improve strategy stability and profitability.
[/trans]
Strategy Arguments
| Argument | Default | Description |
|---|---|---|
| v_input_int_1 | true | Start Date |
| v_input_int_2 | true | Start Month |
| v_input_int_3 | 2010 | Start Year |
| v_input_int_4 | 31 | End Date |
| v_input_int_5 | 12 | End Month |
| v_input_int_6 | 2021 | End Year |
| v_input_1 | 2 | Long Stop Loss % |
| v_input_2 | 4 | Long Take Profit % |
| v_input_3 | 2 | Short Stop Loss % |
| v_input_4 | 4 | Short Take Profit % |
| v_input_int_7 | 20 | Volume Bands Length |
| v_input_float_1 | 2 | Volume Bands StdDev |
| v_input_int_8 | 20 | Bollinger Bands Length |
| v_input_float_2 | 2 | Bollinger Bands StdDev |
| v_input_5 | 2 | Hist Smoothing Factor #1 |
| v_input_6 | 2 | Hist Smoothing Factor #2 |
| v_input_7 | 2 | Hist Smoothing Factor #3 |
| v_input_8 | -0.1 | oversold |
| v_input_9 | 0.4 | overbought |
Source (PineScript)
/*backtest
start: 2022-10-23 00:00:00
end: 2023-10-29 00:00:00
period: 1d
basePeriod: 1h
exchanges: [{"eid":"Futures_Binance","currency":"BTC_USDT"}]
*/

//// This source code is subject to the terms of the Mozilla Public License 2.0 at https://mozilla.org/MPL/2.0/
// © tathal and special thanks to oakwhiz for his porting of my custom volume indicator

//@version=5
strategy('Volume Difference Delta Cycle Oscillator', 'VDDC Osc', default_qty_type=strategy.percent_of_equity, default_qty_value=100, max_bars_back=5000)

startDate = input.int(title='Start Date', defval=1, minval=1, maxval=31)
startMonth = input.int(title='Start Month', defval=1, minval=1, maxval=12)
startYear = input.int(title='Start Year', defval=2010, minval=1800, maxval=2100)

endDate = input.int(title='End Date', defval=31, minval=1, maxval=31)
endMonth = input.int(title='End Month', defval=12, minval=1, maxval=12)
endYear = input.int(title='End Year', defval=2021, minval=1800, maxval=2100)

// Normalize Function
normalize(_src, _min, _max) =>
    // Normalizes series with unknown min/max using historical min/max.
    // _src      : series to rescale.
    // _min, _min: min/max values of rescaled series.
    var _historicMin = 10e10
    var _historicMax = -10e10
    _historicMin := math.min(nz(_src, _historicMin), _historicMin)
    _historicMax := math.max(nz(_src, _historicMax), _historicMax)
    _min + (_max - _min) * (_src - _historicMin) / math.max(_historicMax - _historicMin, 10e-10)


// STEP 2:
// Look if the close time of the current bar
// falls inside the date range
inDateRange = true

// Stop loss & Take Profit Section
l_sl_inp = input(2.0, title='Long Stop Loss %') / 100
l_tp_inp = input(4.0, title='Long Take Profit %') / 100

l_stop_level = strategy.position_avg_price * (1 - l_sl_inp)
l_take_level = strategy.position_avg_price * (1 + l_tp_inp)

s_sl_inp = input(2.0, title='Short Stop Loss %') / 100
s_tp_inp = input(4.0, title='Short Take Profit %') / 100

s_stop_level = strategy.position_avg_price * (1 + s_sl_inp)
s_take_level = strategy.position_avg_price * (1 - s_tp_inp)

src = close

//  Volume Differnce Indicator Delta

float change_src = ta.change(src)
float i_obv = ta.cum(change_src > 0 ? volume : change_src < 0 ? -volume : 0 * volume)
float i_pvt = ta.pvt

float result = ta.change(i_obv - i_pvt)

float nresult = ta.ema(normalize(result, -1, 1), 20)


// Volume Differnce Indicator Delta %B
length = input.int(20, minval=1, title='Volume Bands Length')
mult = input.float(2.0, minval=0.001, maxval=50, title='Volume Bands StdDev')
basis = ta.ema(nresult, length)
dev = mult * ta.stdev(nresult, length)
upper = basis + dev
lower = basis - dev
bbr = (nresult - lower) / (upper - lower)

// Normal %B, Based on close

l1 = input.int(20, minval=1, title='Bollinger Bands Length')
src2 = close
mult1 = input.float(2.0, minval=0.001, maxval=50, title='Bollinger Bands StdDev')
basis1 = ta.sma(src2, l1)
dev1 = mult1 * ta.stdev(src2, l1)
upper1 = basis1 + dev1
lower1 = basis1 - dev1
bbr1 = (src - lower1) / (upper1 - lower1)

/// Final Output Line

hist = ta.ema(ta.ema(ta.ema(bbr1 - bbr, input(2, title='Hist Smoothing Factor #1')), input(2, title='Hist Smoothing Factor #2')), input(2, title='Hist Smoothing Factor #3'))

/// Overbought / Oversold Line Creation
oversold = input(-.1)
overbought = input(.4)
hline(oversold, linewidth=2, color=color.new(#81c784, 62))
hline(overbought, linewidth=2, color=color.new(#c2185b, 38))

/// Long & Short Conditions

short = hist > overbought
long = hist < oversold

/// Colors & Plotting
histColor = hist >= 0 ? hist[1] < hist ? #26A69A : #B2DFDB : hist[1] < hist ? #FFCDD2 : #EF5350
plot(hist, title='Histogram', style=plot.style_columns, color=color.new(histColor, 0))

CrossBgColor = long ? color.new(#81c784, 62) : short ? color.new(#c2185b, 38) : na
bgcolor(color.new(CrossBgColor, 90))

/// Strategy Methodology

if inDateRange
    strategy.entry('long', strategy.long, when=long, stop=l_stop_level, limit=l_take_level)

if inDateRange and strategy.position_size > 0
    strategy.close_all(when=short)

if inDateRange
    strategy.entry('short', strategy.short, when=short, stop=s_stop_level, limit=s_take_level)

if inDateRange and strategy.position_size < 0
    strategy.close_all(when=long)
Detail
https://www.fmz.com/strategy/430554
Last Modified
2023-10-30 11:45:42