
10 KiB
Name
基于态势的Karobein均值回归策略Scaled-Normalized-Vector-Strategy-with-Karobein-Mean-Reversion
Author
ChaoZhang
Strategy Description
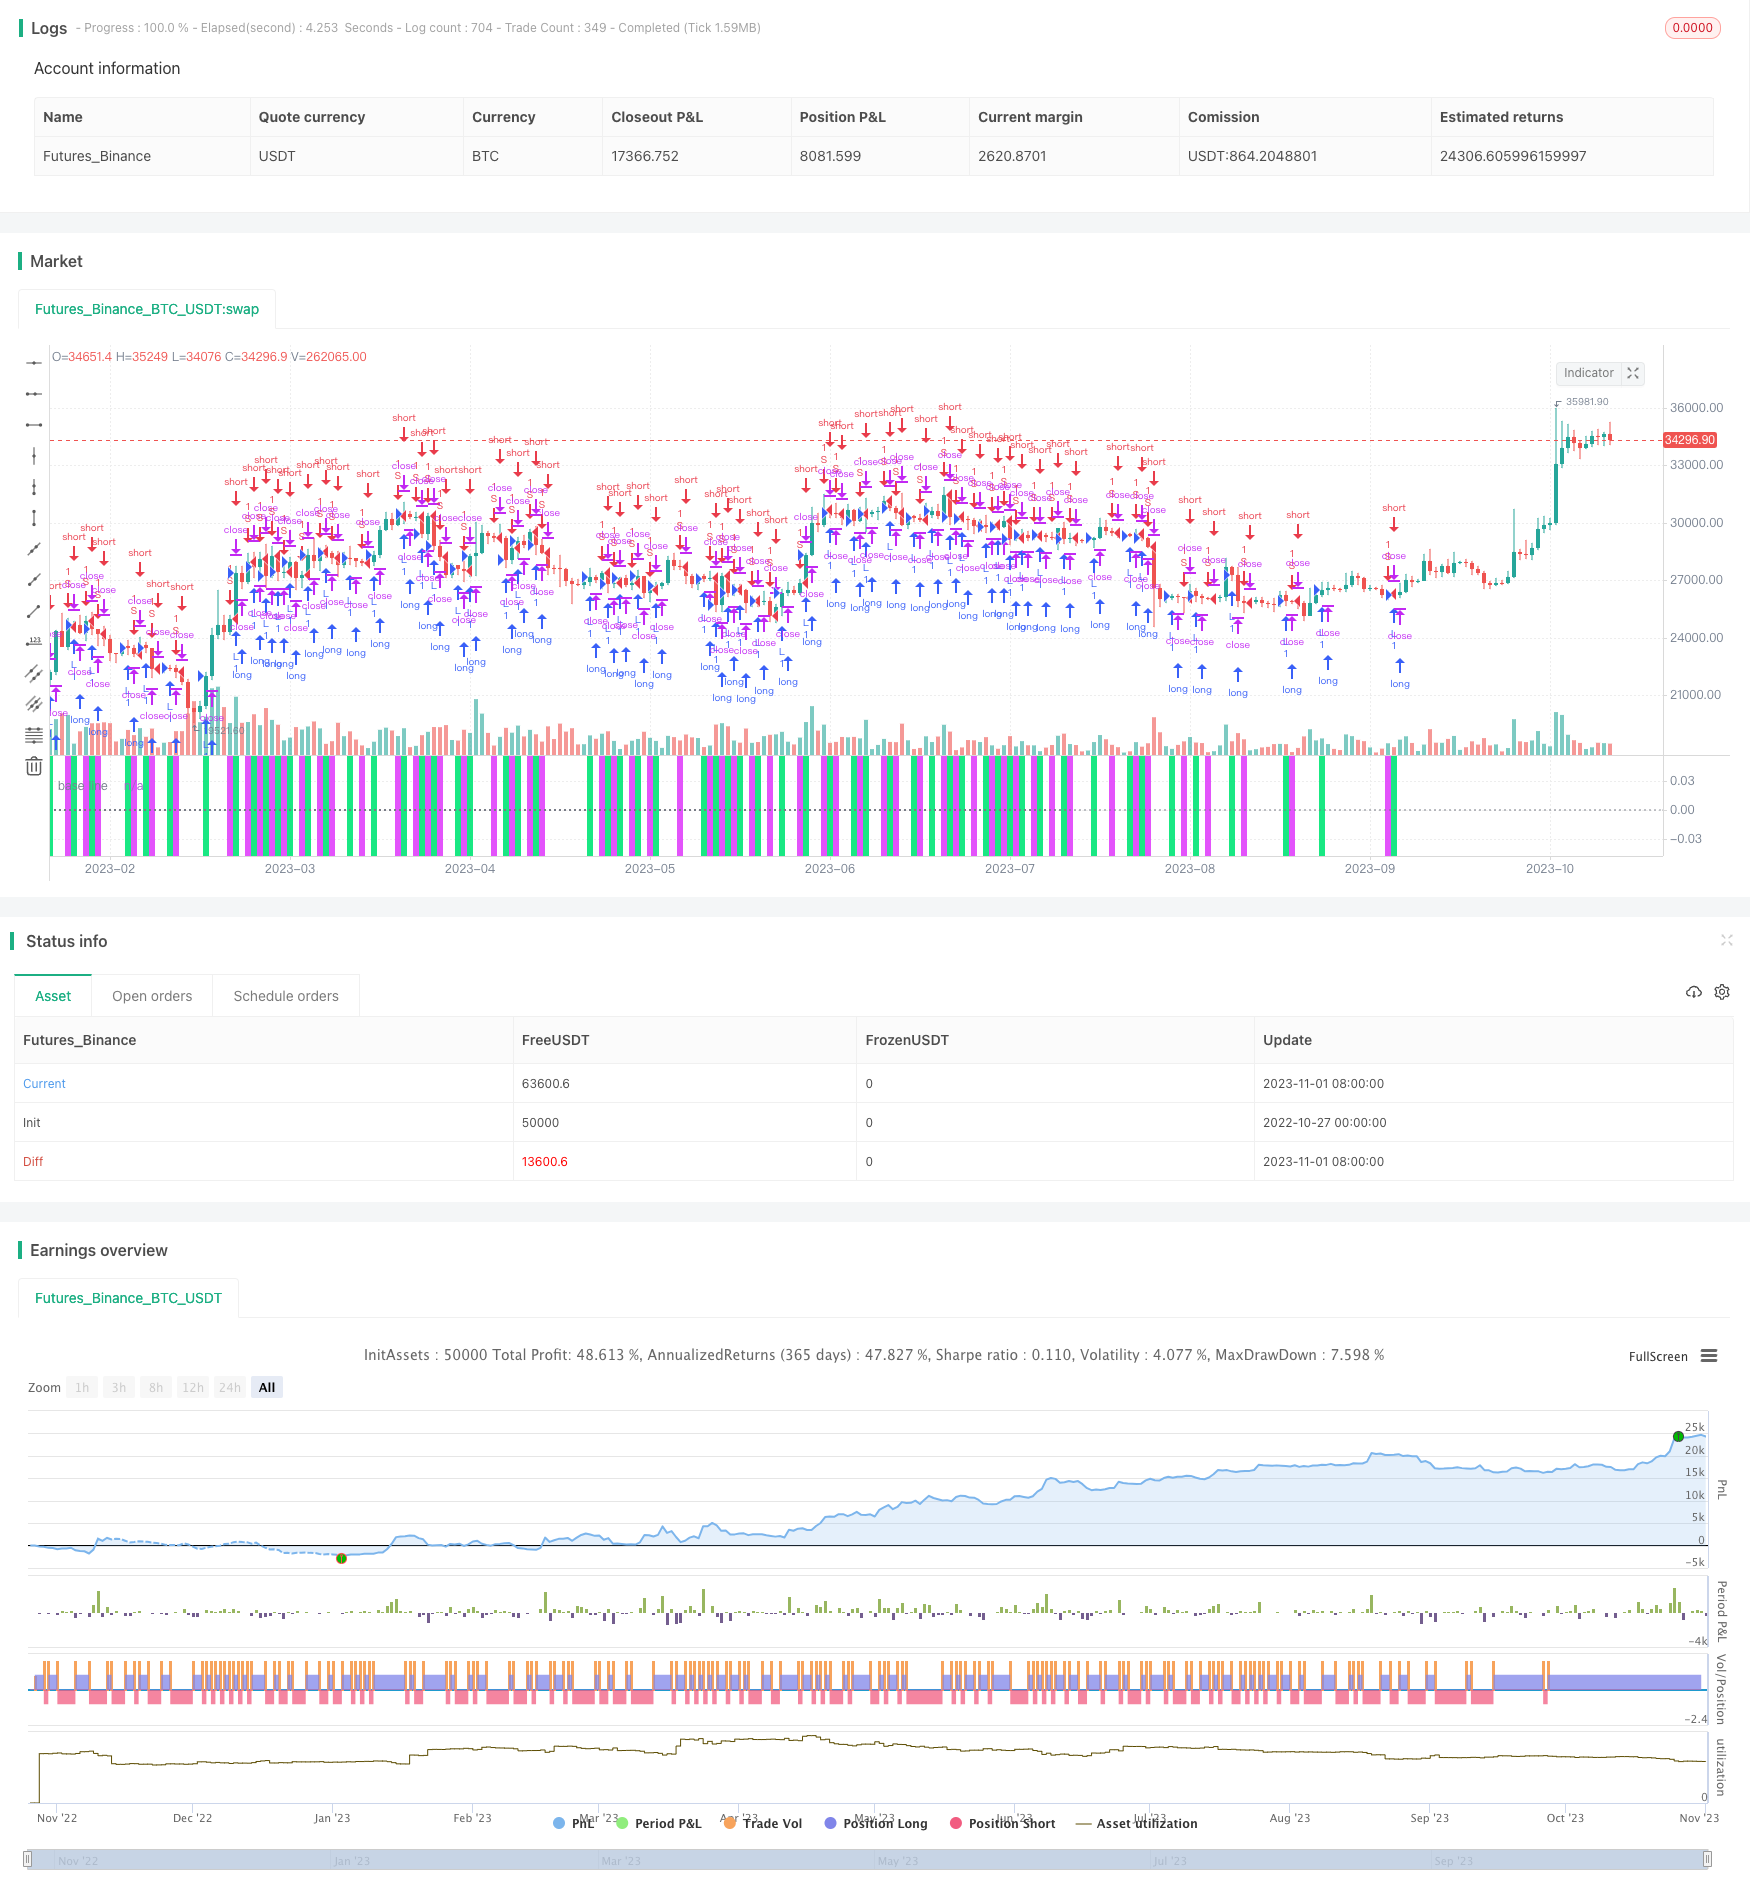 [trans]
概述
该策略基于Karobein均值回归指标和价格动量。它利用价格动量辅助指标进行趋势判断,并结合Karobein均值回归指标进行具体入场。该策略适用于中长线交易。
策略原理
该策略首先通过计算不同周期价格的变化率,得到价格动量指标。当价格动量指标上穿动态阈值线时产生多头信号,下穿时产生空头信号。
然后结合Karobein均值回归指标确定具体入场时机。Karobein均值回归指标基于价格的均线回归性质计算得到,它能反映价格的波动加速度和路径。该指标具有内在的正弦波特征,有助于判断价格走势方向和时间节点。
当价格动量指标发出信号时,若Karobein均值回归指标处于对应的方向区域,则产生入场信号。
策略优势
-
该策略综合考虑了价格动量和均值回归两个因素,具有较强的趋势判断能力。
-
Karobein均值回归指标可准确定位价格转折点位,提高入场时机精确度。
-
可通过参数调整自由控制持仓周期,适用于不同时间周期。
-
可实时调整动态阈值参数,对市场变化进行自适应。
策略风险
-
该策略为趋势跟踪策略,在震荡趋势中容易被套。
-
Karobein均值回归指标存在一定程度的滞后,可能错过价格转折节点。
-
需关注持仓周期参数设置,过长持仓时间可能导致亏损扩大。
-
应适当调整动态阈值参数,不宜设置过大,否则将错过进场时机。
对应风险的解决方法:
-
可通过趋势判断指标提前判断震荡来临,及时平仓止损。
-
选择合适周期Karobein均值回归指标,不能过于滞后。
-
测试不同持仓时间参数,选择适合自己的持仓时间。
-
调整动态阈值范围,不能过宽以避免漏入场点。
策略优化方向
-
可测试不同价格动量计算周期,优化参数。
-
可加入波动率指标,判断震荡来临,可设置止损。
-
可优化Karobein均值回归指标参数,使其更加灵敏。
-
可加入附加过滤条件,如交易量指标等,提高信号质量。
-
可采用机器学习算法动态优化参数。
总结
本策略综合考虑价格动量因素和均值回归因素,具有较强的趋势判断和信号产生能力。可通过参数调整自适应不同市场环境。下一步可从入场时机、止损方面进行进一步优化,使策略更加稳定和强大。该策略值得进一步研究和应用。
||
Overview
This strategy is based on the Karobein Mean Reversion indicator and price momentum. It uses price momentum auxiliary indicators for trend judgment and combines the Karobein Mean Reversion indicator for specific entry. This strategy is suitable for medium and long term trading.
Strategy Principle
Firstly, the strategy calculates the rate of change of prices at different periods to obtain the price momentum indicator. When the price momentum indicator crosses above the dynamic threshold line, a long signal is generated. When it crosses below, a short signal is generated.
Then it combines the Karobein Mean Reversion indicator to determine the specific entry timing. The Karobein Mean Reversion indicator is calculated based on the mean reversion nature of prices, which can reflect the acceleration and path of price fluctuations. This indicator has an intrinsic sinusoidal characteristic that helps determine the direction and timing of the trend.
When the price momentum indicator generates a signal, if the Karobein Mean Reversion indicator is in the corresponding directional area, an entry signal is generated.
Advantages
-
The strategy comprehensively considers price momentum and mean reversion factors, with strong trend judgment capability.
-
The Karobein Mean Reversion indicator can accurately locate price turning points and improve entry timing accuracy.
-
The holding period can be freely controlled by parameter adjustment, suitable for different time frames.
-
The dynamic threshold can be adjusted in real time for adaptive response to market changes.
Risks
-
As a trend following strategy, it is prone to being trapped in range-bound trends.
-
The Karobein Mean Reversion indicator has a certain lag, which may miss price turning points.
-
The holding period parameter should be monitored to avoid expanding losses from excessive holding periods.
-
The dynamic threshold should be set appropriately not too wide, otherwise entry opportunities may be missed.
Corresponding risk management methods:
-
Trend judgment indicators can be used to foresee ranging markets and exit positions in time.
-
Choose reasonable lags for the Karobein Mean Reversion indicator to reduce delays.
-
Test different holding period parameters and choose suitable ones.
-
Adjust the dynamic threshold range to avoid missing entries.
Enhancement Directions
-
Test different periods for price momentum calculation to optimize parameters.
-
Add volatility indicators to detect ranging markets and set stop loss.
-
Optimize parameters of the Karobein Mean Reversion indicator to make it more sensitive.
-
Add additional filters like volume to improve signal quality.
-
Use machine learning algorithms to dynamically optimize parameters.
Conclusion
This strategy comprehensively utilizes price momentum and mean reversion factors, with strong capabilities in trend judgment and signal generation. It can adapt to different market environments through parameter tuning. Further optimizations can be done regarding entry timing and stop loss to make the strategy more robust. This strategy deserves further research and application.
[/trans]
Strategy Arguments
| Argument | Default | Description |
|---|---|---|
| v_input_1_close | 0 | Price Data: close |
| v_input_2 | 34 | Timeframe |
| v_input_3 | 14 | Threshold |
| v_input_4 | 0 | Divisor: 1000000 |
| v_input_5 | false | Volume |
| v_input_6 | true | Use Old System |
| v_input_7 | 8 | Karobein Osc Lookback |
Source (PineScript)
/*backtest
start: 2022-10-27 00:00:00
end: 2023-11-02 00:00:00
period: 1d
basePeriod: 1h
exchanges: [{"eid":"Futures_Binance","currency":"BTC_USDT"}]
*/

//@version=4
// author: capissimo
strategy("Normalized Vector Strategy, ver.3 (sc)", precision=2, overlay=false)
// This is a scaled Normalized Vector Strategy with a Karobein Oscillator
// original: Drkhodakarami (https://www.tradingview.com/script/Fxv2xFWe-Normalized-Vector-Strategy-By-Drkhodakarami-Opensource/)

// Repainting: in general there two types of repainting:
// * when the last candle is constantly being redrawn
// * when the indicator draws a different configuration after it has been deactivated/reactivated, i.e. refreshed

// The former is a natural behaviour, which presents a constant source of frustration,
// when a signal directly depends on the current market situation and can be overcome
// with various indirect techniques like divergence.

// The latter suggests a flaw in the indicator design.
// Unfortunately, the Normalized Vector Strategy is repainting in the latter sense, although being
// really promising. Would be nice if our community suggests a solution to this problem ))

// This strat consistently performs with high accuracy, showing up to 96% scores
// Here are some of the best parameters:
// TF     Lookback   Performance (ca.)
// 1m     13         92%
// 3m     34         92%
// 5m     85         92%
// 15m    210        90%
// 30m    360        89%
// 1H     1440,720   94%, 87%

// The Karobein Oscillator has an intrinsic sinusoidal behaviour that helps in determining direction and timing.
// It does not repaint.
// original: alexgrover (https://www.tradingview.com/script/JiNi0f62-Karobein-Oscillator/)

scaleMinimax(X, p, min, max) =>
    hi = highest(X, p), lo = lowest(X, p)
    (max - min) * (X - lo)/(hi - lo) + min

price    = input(close,  "Price Data")
tf       = input(34,     "Timeframe", minval=1, maxval=1440)
thresh   = input(14.,    "Threshold", minval=.1, step=.1)
div      = input(1000000,"Divisor", options=[1,10,100,1000,10000,100000,1000000,10000000,100000000])
showVol  = input(false,  "Volume")
useold   = input(true,   "Use Old System")

lime  = color.new(color.lime, 10), fuchsia = color.new(color.fuchsia, 10),
black = color.new(color.black, 100), gray = color.new(color.gray, 50)

vol  = useold ? security(syminfo.tickerid, tostring(tf), volume, barmerge.gaps_off, barmerge.lookahead_on)
              : security(syminfo.tickerid, tostring(tf), volume)
obv  = cum(change(price) > 0 ? vol : change(price) < 0 ? -vol : 0*vol)
prix = showVol ? obv : price

getdiff(prc, tf) =>
    prev  = useold ? security(syminfo.tickerid, tostring(tf), prc[1], barmerge.gaps_off, barmerge.lookahead_on) :
                     security(syminfo.tickerid, tostring(tf), prc[1])
    curr  = useold ? security(syminfo.tickerid, tostring(tf), prc, barmerge.gaps_off, barmerge.lookahead_on) :
                     security(syminfo.tickerid, tostring(tf), prc)
    (curr/prev) - 1

p  = getdiff(prix, tf)
up = thresh/div, dn = -thresh/div
longCondition  = crossover(p, up)
shortCondition = crossunder(p, dn)

bg = longCondition ? lime : shortCondition ? fuchsia : black
cl = p > up ? color.green : p < dn ? color.red : color.silver

bgcolor(bg, editable=false)
plot(scaleMinimax(up, 2500, -1, 1), color=lime, editable=false, transp=0)
hline(0, linestyle=hline.style_dotted, title="base line", color=gray, editable=false)
plot(scaleMinimax(dn, 2500, -1, 1), color=fuchsia, editable=false, transp=0)
plot(scaleMinimax(p, 2500, -1, 1), color=cl, style=plot.style_histogram, transp=70, editable=false)
plot(scaleMinimax(p, 2500, -1, 1), color=cl, style=plot.style_linebr, title="prediction", transp=0, editable=false)

strategy.entry("L", true, 1, when=longCondition)
strategy.entry("S", false, 1, when=shortCondition)

alertcondition(longCondition, title='Long', message='Long Signal!')
alertcondition(shortCondition, title='Short', message='Short Signal!')

//*** Karobein Oscillator
per  = input(8, "Karobein Osc Lookback")

prix2  = ema(price, per)
a = ema(prix2 < prix2[1] ? prix2/prix2[1] : 0, per)
b = ema(prix2 > prix2[1] ? prix2/prix2[1] : 0, per)
c = (prix2/prix2[1])/(prix2/prix2[1] + b)
d = 2*((prix2/prix2[1])/(prix2/prix2[1] + c*a)) - 1

plot(scaleMinimax(d, 2500, -1, 1), color=color.orange, transp=0)
Detail
https://www.fmz.com/strategy/431004
Last Modified
2023-11-03 16:56:13