
9.2 KiB
Name
基于布林带突破的三连阳阳线高点趋势跟踪策略-Triple-Candlestick-Bollinger-Bands-Breakout-Trend-Following-Strategy-with-High-Low-Point-Confirmation
Author
ChaoZhang
Strategy Description
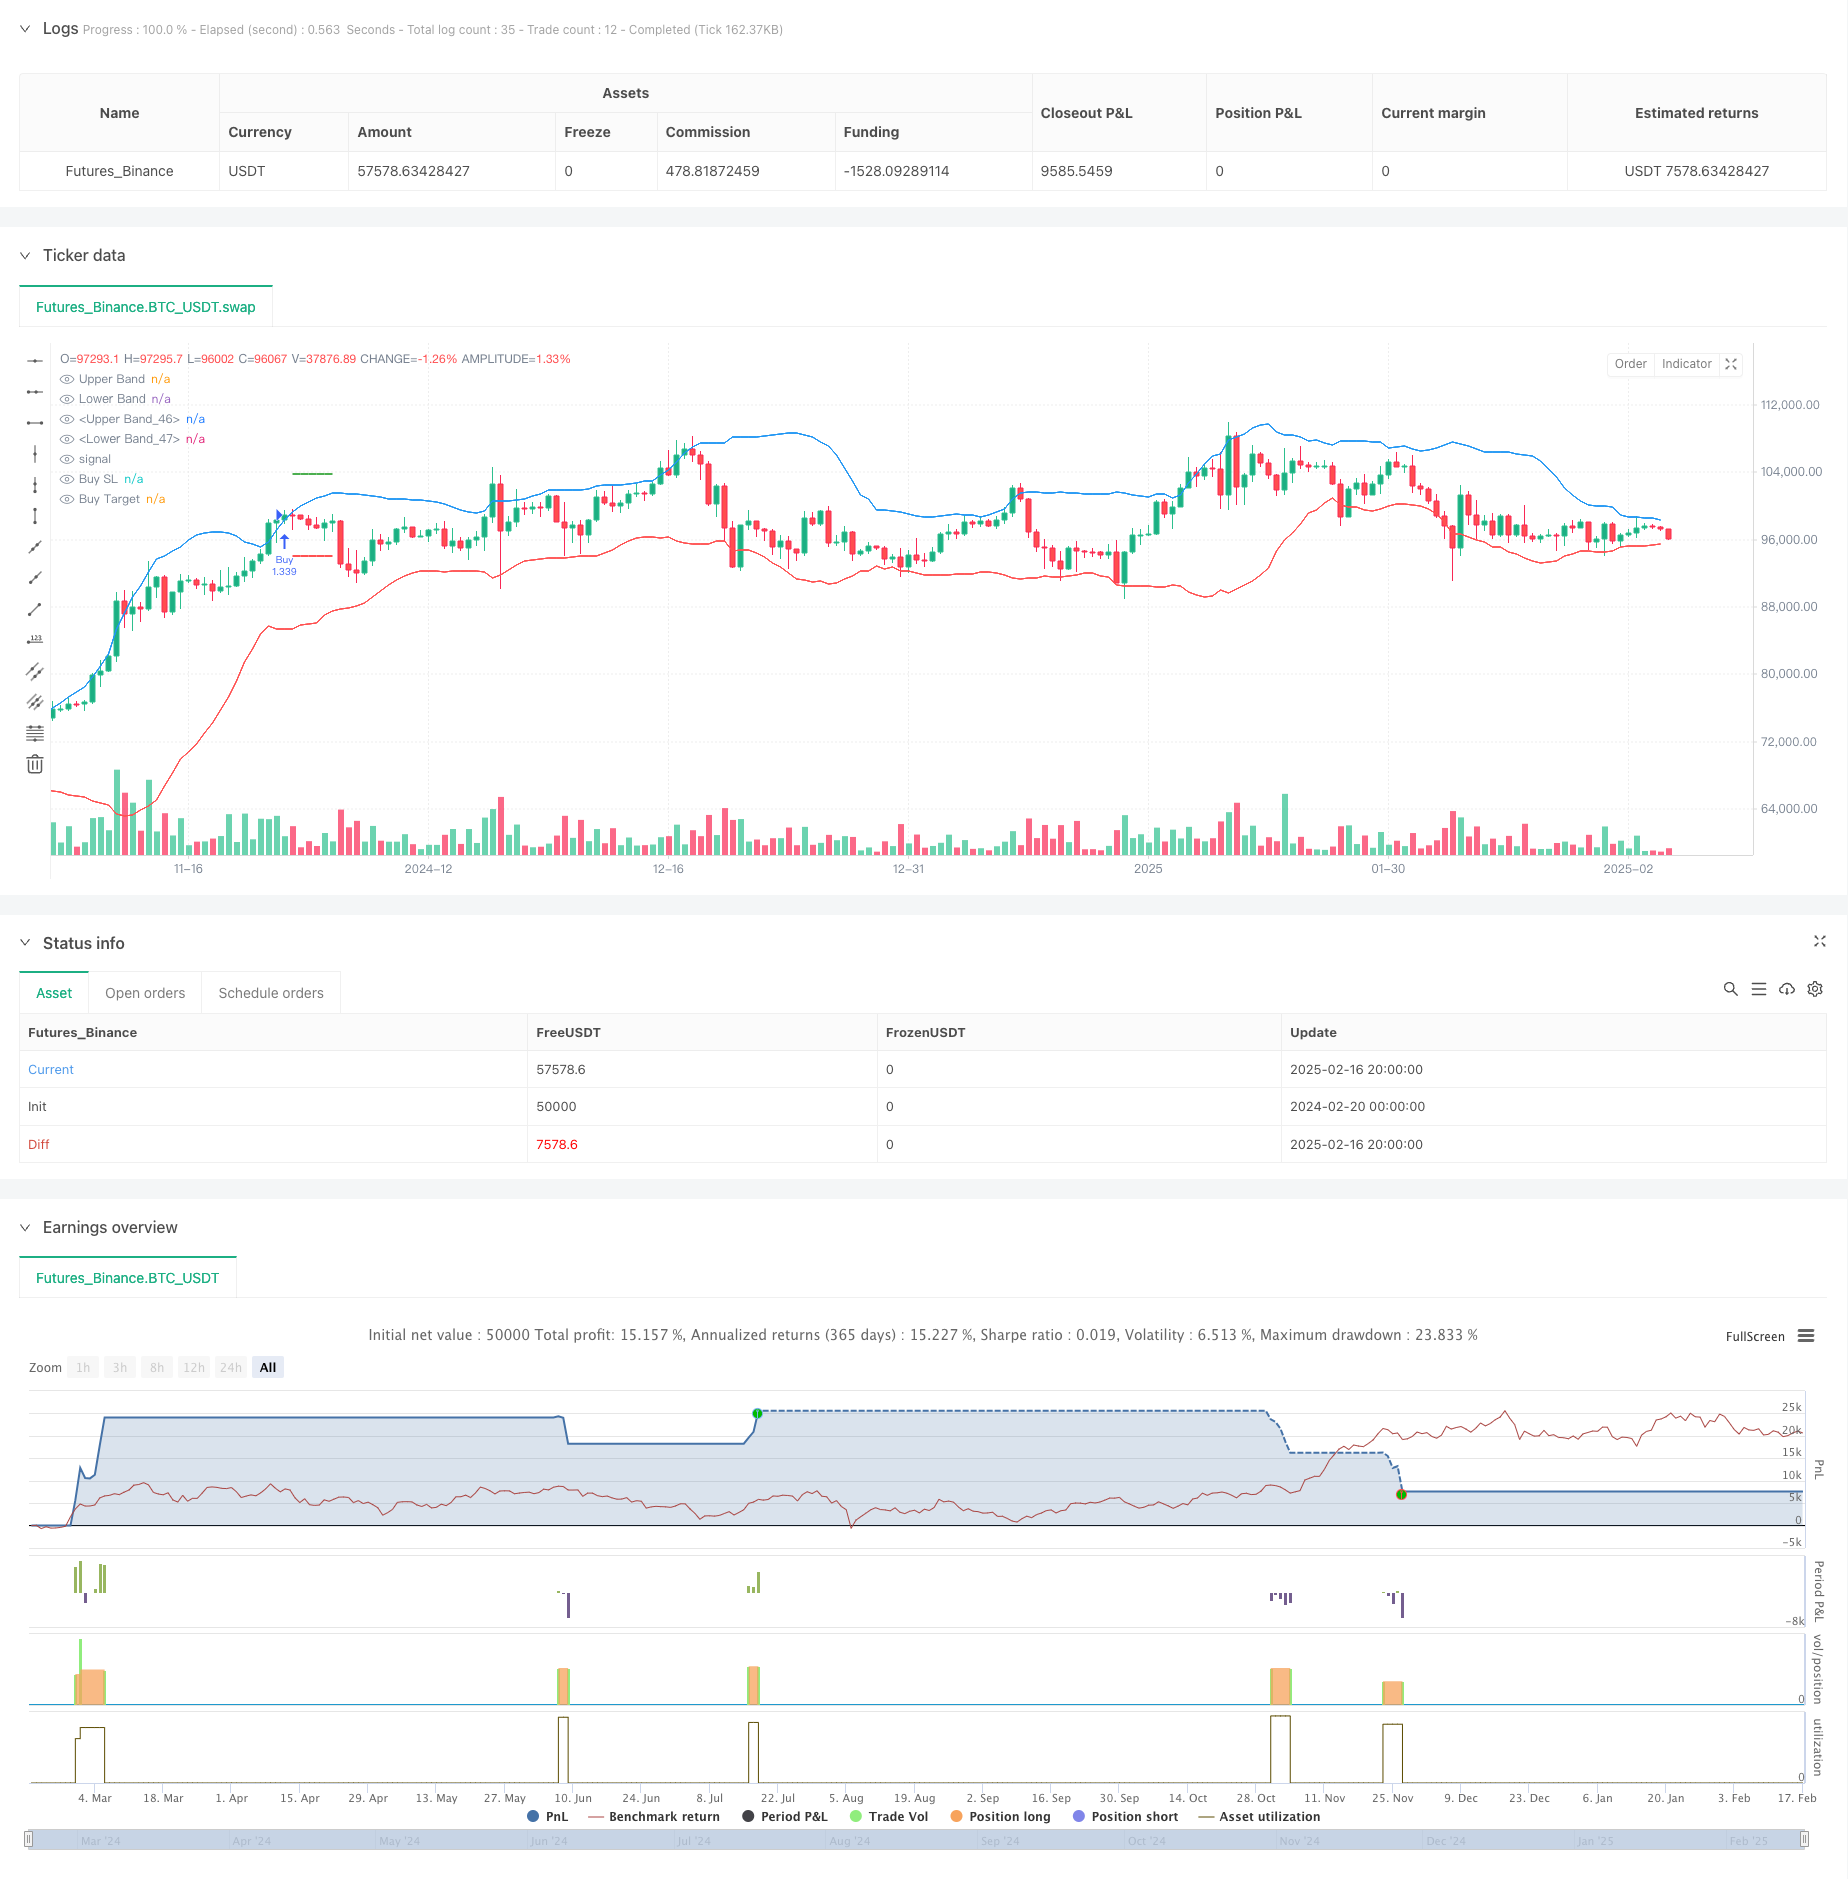
[trans]
概述
该策略是一个基于布林带突破和蜡烛线形态的趋势跟踪交易系统。策略通过识别连续三根突破布林带的蜡烛线,并结合收盘价在蜡烛线实体中的位置来确定交易信号。系统采用了固定的1:1风险收益比来管理每笔交易的止损和止盈。
策略原理
策略的核心逻辑基于以下几个关键要素:
- 使用20周期的布林带作为主要指标,标准差倍数为2.0
- 多头入场条件:连续三根K线收盘价突破上轨,且这三根K线都是阳线,收盘价都位于实体上半部分
- 空头入场条件:连续三根K线收盘价突破下轨,且这三根K线都是阴线,收盘价都位于实体下半部分
- 止损设置在最早那根信号K线的极值处
- 基于1:1的风险收益比设置止盈位置
策略优势
- 采用多重确认机制,通过连续三根突破K线的形态要求,有效降低假突破的风险
- 结合收盘价在K线实体中的位置判断,增强了趋势确认的可靠性
- 使用固定的风险收益比进行仓位管理,便于风险控制
- 策略逻辑清晰,易于理解和执行
- 通过标记功能直观显示交易信号,便于回测分析
策略风险
- 在震荡市场中可能产生频繁的假信号
- 固定的风险收益比可能无法充分把握强趋势行情
- 连续三根K线的严格要求可能错过一些潜在的好机会
- 止损设置在信号K线极值处,在波动较大时止损位置可能过远 建议通过以下方式管理风险:
- 结合市场波动周期调整布林带参数
- 根据市场特征动态调整风险收益比
- 增加趋势确认指标
- 优化止损位置设置方法
策略优化方向
- 参数优化:
- 可以根据不同市场特征动态调整布林带周期和标准差倍数
- 考虑将三根K线的要求改为动态判断
- 信号优化:
- 增加趋势确认指标如ADX或趋势线
- 引入成交量确认机制
- 考虑加入摆动指标作为辅助
- 仓位管理优化:
- 实现动态的风险收益比设置
- 增加资金管理模块
- 考虑分批建仓和平仓机制
- 止损优化:
- 引入跟踪止损机制
- 基于ATR设置止损距离
- 考虑时间止损
总结
这是一个结构完整、逻辑清晰的趋势跟踪策略。通过布林带突破和蜡烛线形态的多重确认机制,有效降低了假信号风险。固定的风险收益比设置简化了交易管理,但也限制了策略的灵活性。通过优化参数设置、增加确认指标、改进仓位管理等方式,策略仍有较大的改进空间。整体而言,这是一个具有实用价值的基础策略框架,可以根据具体需求进行进一步完善。 ||
Overview
This strategy is a trend-following trading system based on Bollinger Bands breakouts and candlestick patterns. It identifies trading signals through three consecutive candles breaking the Bollinger Bands, combined with the position of closing prices within the candlestick bodies. The system employs a fixed 1:1 risk-reward ratio for managing stop-loss and take-profit levels.
Strategy Principles
The core logic is based on the following key elements:
- Uses 20-period Bollinger Bands as the primary indicator with a standard deviation multiplier of 2.0
- Long entry conditions: three consecutive candles closing above the upper band, all being bullish with closes in the upper half of their ranges
- Short entry conditions: three consecutive candles closing below the lower band, all being bearish with closes in the lower half of their ranges
- Stop-loss is set at the extreme point of the earliest signal candle
- Take-profit is set based on a 1:1 risk-reward ratio
Strategy Advantages
- Employs multiple confirmation mechanisms through consecutive breakout candles, effectively reducing false breakout risks
- Enhances trend confirmation reliability by considering closing price positions within candle bodies
- Uses fixed risk-reward ratio for position management, facilitating risk control
- Clear and easy-to-understand strategy logic
- Intuitive signal visualization through markers for backtest analysis
Strategy Risks
- May generate frequent false signals in ranging markets
- Fixed risk-reward ratio might not fully capture strong trends
- Strict three-candle requirement may miss potential opportunities
- Stop-loss placement at signal candle extremes may be too wide in volatile conditions Risk management suggestions:
- Adjust Bollinger Bands parameters based on market volatility cycles
- Dynamically adjust risk-reward ratio according to market characteristics
- Add trend confirmation indicators
- Optimize stop-loss placement method
Strategy Optimization Directions
- Parameter Optimization:
- Dynamically adjust Bollinger Bands period and standard deviation multiplier based on market characteristics
- Consider changing three-candle requirement to dynamic judgment
- Signal Optimization:
- Add trend confirmation indicators like ADX or trendlines
- Introduce volume confirmation mechanism
- Consider adding oscillators as auxiliary indicators
- Position Management Optimization:
- Implement dynamic risk-reward ratio settings
- Add money management module
- Consider scaled entry and exit mechanisms
- Stop-Loss Optimization:
- Introduce trailing stop mechanism
- Set stop-loss distance based on ATR
- Consider time-based stops
Summary
This is a well-structured trend-following strategy with clear logic. Through multiple confirmation mechanisms using Bollinger Bands breakouts and candlestick patterns, it effectively reduces false signal risks. The fixed risk-reward ratio simplifies trade management but limits strategy flexibility. There is significant room for improvement through parameter optimization, additional confirmation indicators, and improved position management. Overall, it provides a practical basic strategy framework that can be further refined based on specific requirements.[/trans]
Source (PineScript)
/*backtest
start: 2024-02-20 00:00:00
end: 2025-02-17 08:00:00
period: 12h
basePeriod: 12h
exchanges: [{"eid":"Futures_Binance","currency":"BTC_USDT"}]
*/

//@version=6
strategy("Bollinger Band Strategy (Close Near High/Low Relative to Half Range)", overlay=true, default_qty_type=strategy.percent_of_equity, default_qty_value=200, pyramiding=0)

// Bollinger Bands
length = input.int(20, "BB Length")
mult = input.float(2.0, "BB StdDev")
basis = ta.sma(close, length)
upper_band = basis + mult * ta.stdev(close, length)
lower_band = basis - mult * ta.stdev(close, length)

// Plot Bollinger Bands
plot(upper_band, "Upper Band", color.blue)
plot(lower_band, "Lower Band", color.red)

// Buy Condition:
// 1. Last 3 candles close above upper band AND close > open for all 3 candles
// 2. Close is in the top half of the candle's range (close > (high + low) / 2)
buyCondition =    close[2] > upper_band[2] and     close[1] > upper_band[1] and     close > upper_band and    close[2] > open[2] and close[2] > (high[2] + low[2]) / 2 and    close[1] > open[1] and close[1] > (high[1] + low[1]) / 2 and    close > open and close > (high + low) / 2

// Sell Condition:
// 1. Last 3 candles close below lower band AND close < open for all 3 candles
// 2. Close is in the bottom half of the candle's range (close < (high + low) / 2)
sellCondition =    close[2] < lower_band[2] and    close[1] < lower_band[1] and   close < lower_band and   close[2] < open[2] and close[2] < (high[2] + low[2]) / 2 and    close[1] < open[1] and close[1] < (high[1] + low[1]) / 2 and    close < open and close < (high + low) / 2

// Initialize variables
var float stop_loss = na
var float target_price = na

// Buy Logic
if buyCondition and strategy.position_size == 0
    stop_loss := low[2] // Low of the earliest candle in the 3-candle sequence
    target_price := close + (close - stop_loss) // Risk-to-reward 1:1
    strategy.entry("Buy", strategy.long)
    strategy.exit("Exit Buy", "Buy", stop=stop_loss, limit=target_price)
    label.new(bar_index, low, "▲", color=color.green, style=label.style_label_up, yloc=yloc.belowbar)

// Sell Logic
if sellCondition and strategy.position_size == 0
    stop_loss := high[2] // High of the earliest candle in the 3-candle sequence
    target_price := close - (stop_loss - close) // Risk-to-reward 1:1
    strategy.entry("Sell", strategy.short)
    strategy.exit("Exit Sell", "Sell", stop=stop_loss, limit=target_price)
    label.new(bar_index, high, "▼", color=color.red, style=label.style_label_down, yloc=yloc.abovebar)

// Plotting
plot(upper_band, "Upper Band", color.blue)
plot(lower_band, "Lower Band", color.red)
plot(strategy.position_size > 0 ? stop_loss : na, "Buy SL", color.red, 2, plot.style_linebr)
plot(strategy.position_size > 0 ? target_price : na, "Buy Target", color.green, 2, plot.style_linebr)
plot(strategy.position_size < 0 ? stop_loss : na, "Sell SL", color.red, 2, plot.style_linebr)
plot(strategy.position_size < 0 ? target_price : na, "Sell Target", color.green, 2, plot.style_linebr)
Detail
https://www.fmz.com/strategy/482595
Last Modified
2025-02-19 11:05:11