
16 KiB
Name
基于布林带均值回归策略The-Bollinger-Bands-Mean-Reversion-Strategy
Author
ChaoZhang
Strategy Description
 [trans]
概述
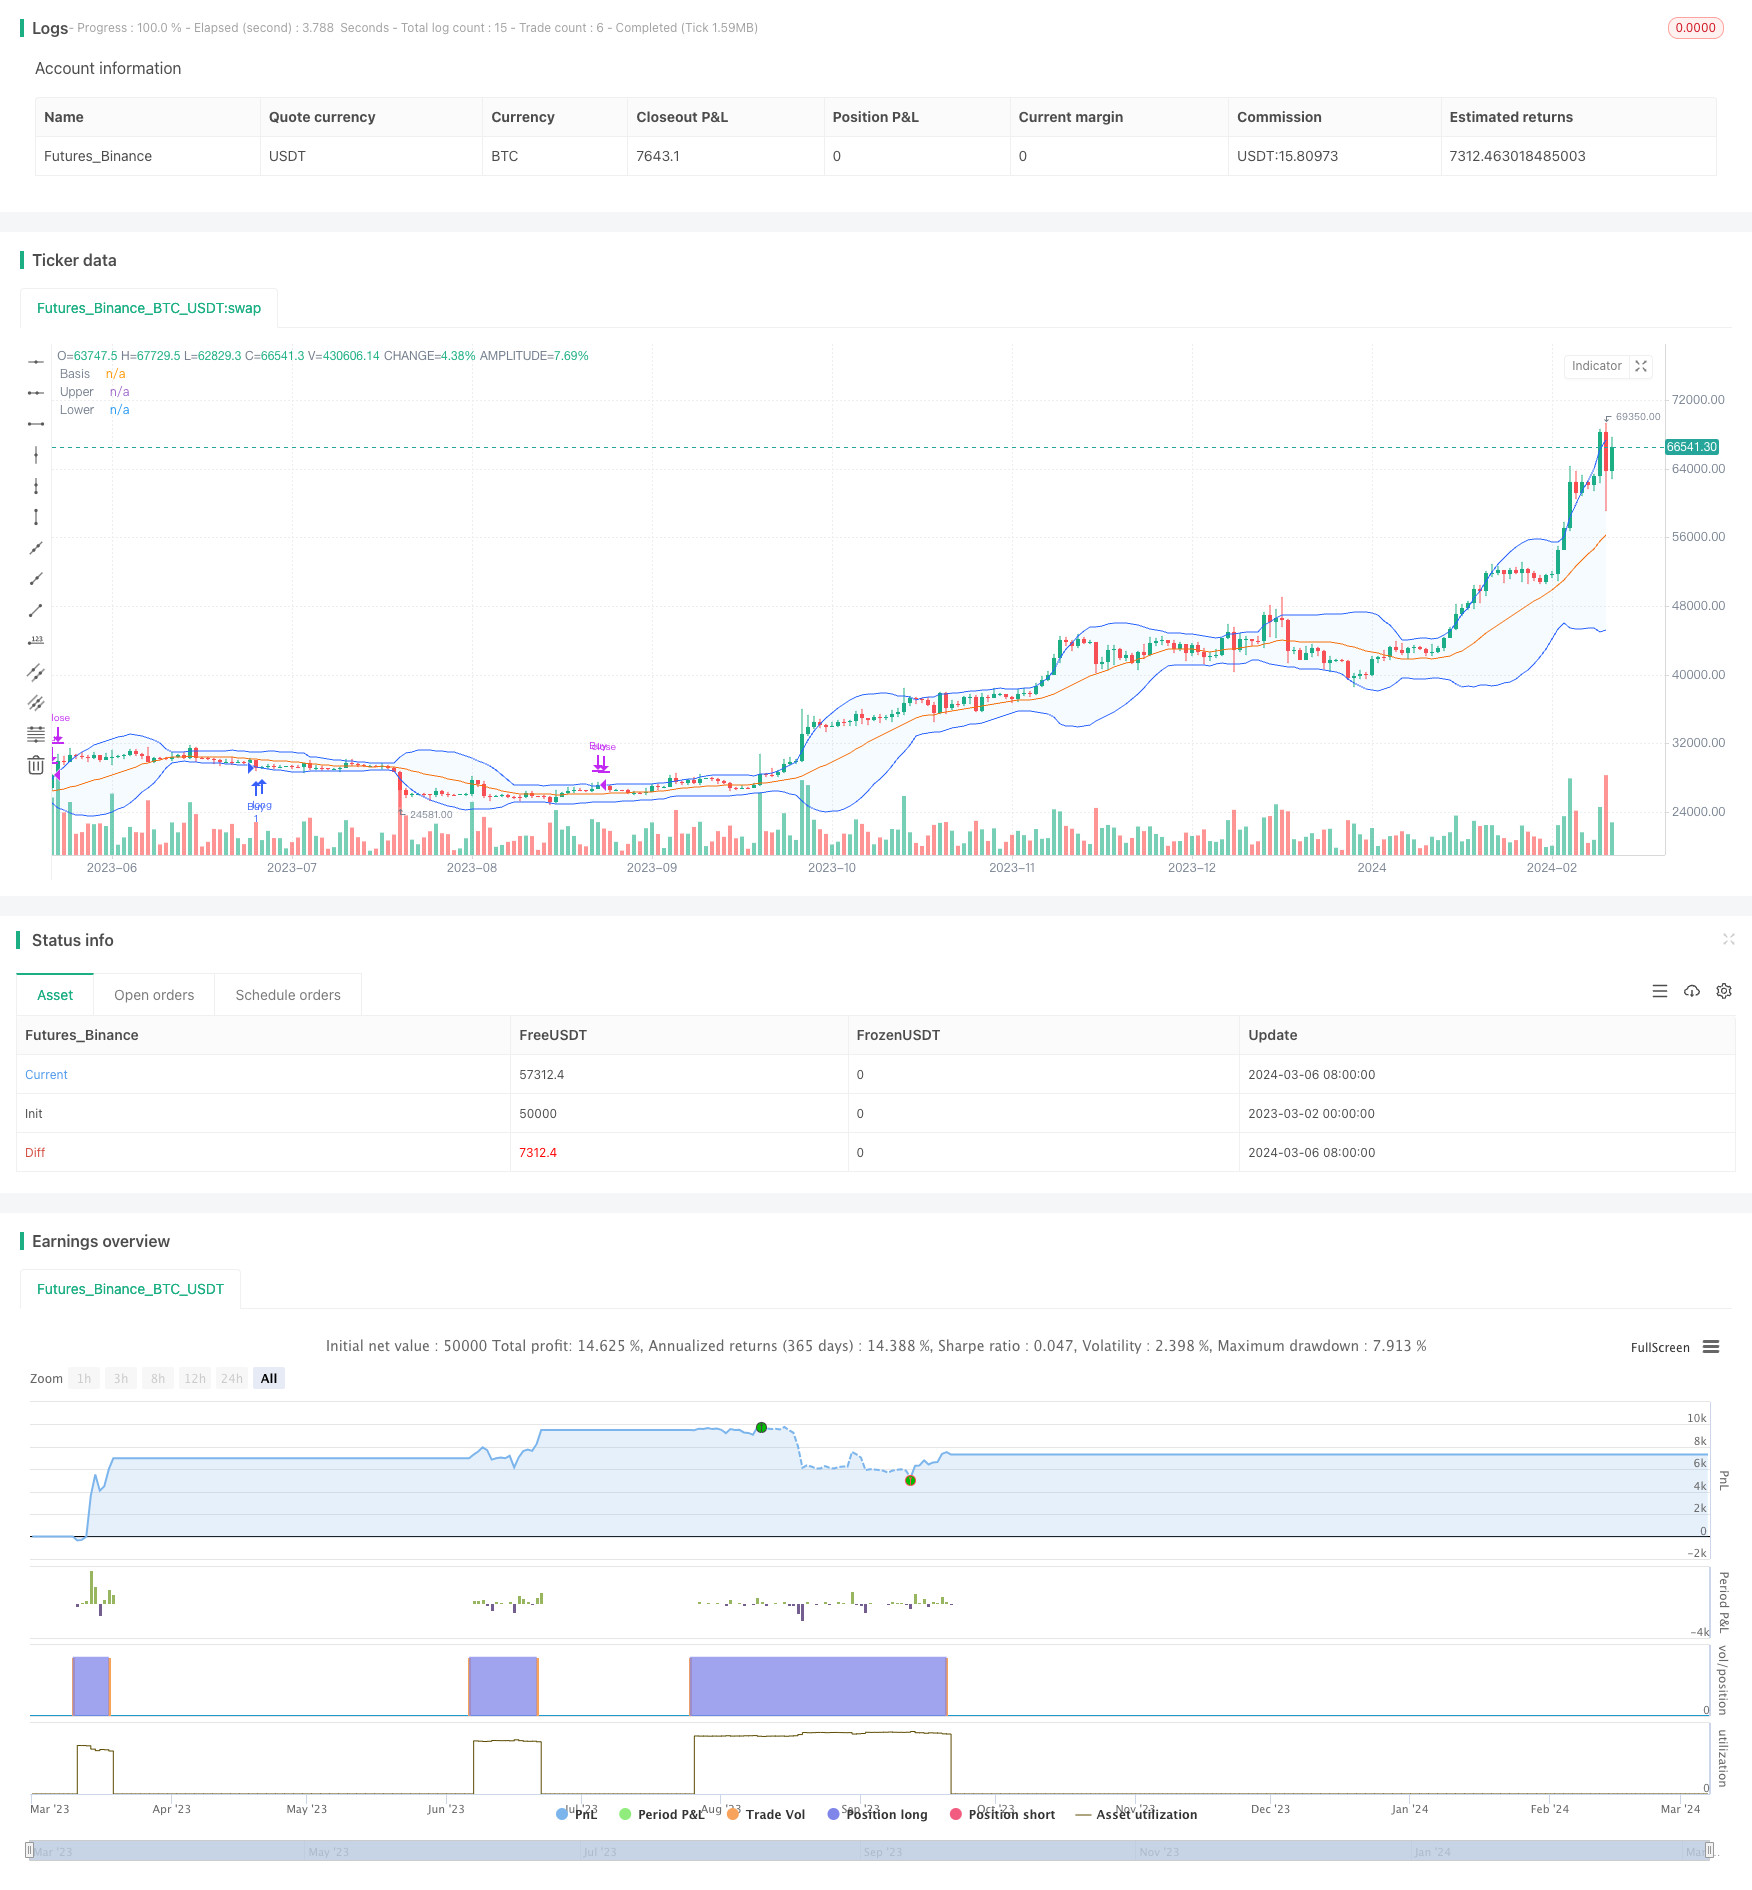
布林带均值回归策略是一个基于布林带指标的量化交易策略。该策略利用了价格围绕均线波动的统计规律,通过在价格偏离布林带上下轨时进行反向操作,以期获得价格回归均值时的利润。
策略原理
布林带由三条线组成:中轨是移动平均线,上下轨是在中轨基础上加减一定倍数的标准差。根据统计学原理,在正态分布的情况下,约有95%的数值会分布在距离平均值正负两个标准差的范围内。
布林带均值回归策略正是利用了这一原理。当价格上穿布林带上轨,表明价格可能过高,存在回落风险;当价格下穿布林带下轨,表明价格可能过低,存在反弹机会。因此,该策略在价格触及布林带上轨时做空,在触及下轨时做多,以期捕捉价格回归均值的利润空间。
该策略代码的主要逻辑如下:
-
计算指定周期的移动平均线,作为布林带的中轨。可选择SMA、EMA、SMMA、WMA、VWMA等不同类型的均线。
-
计算价格在该周期内的标准差,并结合用户设定的倍数参数,得到布林带的上下轨。
-
当收盘价上穿布林带上轨时,触发卖出信号;当收盘价下穿布林带下轨时,触发买入信号。
-
策略执行交易:买入信号触发时开多仓,直到卖出信号出现时平仓。
通过以上过程,策略能够在价格显著偏离均线时建立反向头寸,并在价格回归均值时获利了结。
优势分析
布林带均值回归策略具有以下优势:
-
逻辑简单,易于理解和实现。该策略基于统计学的基本原理,通过布林带对价格的波动范围进行刻画,入场和出场条件清晰明确。
-
适应性强,可应用于多个市场和品种。布林带是一个通用性很强的技术指标,对于趋势性和震荡性的市场都有一定的适应能力。用户可以灵活调整参数,以适应不同的市场特征。
-
捕捉价格波动的机会。布林带扩张和收缩体现了价格的波动情况,该策略通过在价格达到相对高位或低位时建仓,力图获取价格回归均值的收益。
-
止盈止损相对明确。由于布林带对应了一定的置信区间,因此该策略的止盈止损位置相对容易确定,有助于控制风险。
风险分析
尽管布林带均值回归策略有其优势,但同时也存在一定的风险:
-
趋势性市场中表现欠佳。如果市场出现连续的单边趋势,价格持续在布林带上轨或下轨附近运行,该策略可能会频繁出现亏损交易。
-
参数设置敏感。布林带的周期和倍数参数对策略表现有显著影响,不同的参数组合可能导致截然不同的结果。如果参数设置不当,策略的有效性会大打折扣。
-
面临频繁震荡的风险。当市场波动率较大,价格在布林带上下轨之间频繁震荡时,该策略可能会出现连续的小额亏损,导致整体收益率下降。
-
未考虑交易成本。该示例代码并未考虑点差、手续费等交易成本因素,在实际应用中,这些因素会一定程度上影响策略的净收益。
针对以上风险,可以考虑采取以下措施来优化策略:
-
结合趋势指标进行过滤。在判断信号时,可以辅助使用如移动平均线等趋势指标,以避免在单边趋势中频繁交易。
-
优化参数选择。通过对历史数据进行回测,分析不同参数组合下策略的表现,选择适合当前市场的最优参数。定期进行参数评估和调整。
-
引入其他过滤条件。如考虑ATR等波动率指标,在波动率过高时暂停交易;或参考交易量等其他指标,进一步确认信号的可靠性。
-
纳入交易成本因素。在回测和实盘中,应将点差、手续费等交易成本计算在内,以更准确地评估策略的实际表现。
优化方向
除了上述提到的风险应对措施外,还可以从以下方面对布林带均值回归策略进行优化:
-
动态调整参数。根据市场的变化,动态调整布林带的周期和倍数参数。可以考虑使用适应性均线(如KAMA)作为中轨,或根据ATR等指标动态调整倍数参数,以适应当前的市场节奏。
-
引入多空仓位管理。在开仓时,可以根据价格与布林带中轨的距离,动态调整仓位大小。离中轨越远,开仓比例可以适当减小,以控制风险;离中轨越近,开仓比例可以适当增加,以抓住更多机会。
-
结合其他技术指标。将布林带与其他技术指标(如RSI、MACD等)结合使用,形成更加稳健的信号确认机制。只有在多个指标共振时才进行交易,提高信号的可靠性。
-
考虑多头寸管理。在适当的条件下,可以同时持有多个头寸,分散风险。例如,可以在不同的时间周期上应用该策略,或在不同的交易品种上同时开仓,以获得更加稳健的收益。
这些优化措施的目的是提高策略的适应性、稳健性和盈利能力。通过动态调整、多指标结合、仓位管理等手段,可以更好地应对市场变化,控制风险,捕捉更多的交易机会。
总结
布林带均值回归策略是一个基于统计原理的量化交易策略,通过布林带对价格的波动范围进行刻画,在价格偏离上下轨时进行反向操作,以期获得均值回归的收益。该策略逻辑简单,适应性强,能够捕捉价格波动的机会,但同时也面临趋势性市场表现欠佳、参数设置敏感、频繁震荡等风险。
针对这些风险,可以通过结合趋势指标、优化参数选择、引入其他过滤条件、纳入交易成本等措施来进行优化。此外,还可以通过动态调整参数、多空仓位管理、结合其他技术指标、多头寸管理等方式,进一步提升策略的适应性和稳健性。
总的来说,布林带均值回归策略为量化交易提供了一种简单而有效的思路。在实际应用中,需要根据具体的市场特点和交易需求,对策略进行适当的优化和改进。通过不断的测试和调整,寻找最适合自己的交易方式,才能在量化交易的道路上取得长期的成功。
||
Overview
The Bollinger Bands Mean Reversion Strategy is a quantitative trading strategy based on the Bollinger Bands indicator. The strategy utilizes the statistical regularity of prices fluctuating around the moving average, aiming to profit from price reversals towards the mean by taking opposite positions when prices deviate from the upper or lower bands.
Strategy Principle
Bollinger Bands consist of three lines: the middle band is the moving average, while the upper and lower bands are a certain number of standard deviations above and below the middle band. According to statistical principles, in a normal distribution, approximately 95% of values will fall within two standard deviations of the mean.
The Bollinger Bands Mean Reversion Strategy leverages this principle. When the price crosses above the upper band, it suggests that the price may be overbought and at risk of a pullback; when the price crosses below the lower band, it indicates that the price may be oversold and has a potential for a rebound. Therefore, this strategy goes short when the price hits the upper band and goes long when it hits the lower band, aiming to capture the profit potential as the price reverts to the mean.
The main logic of the strategy code is as follows:
-
Calculate the moving average of the specified period as the middle band of the Bollinger Bands. Various types of moving averages can be selected, such as SMA, EMA, SMMA, WMA, VWMA, etc.
-
Calculate the standard deviation of the price over the same period, and combine it with the user-defined multiple parameter to obtain the upper and lower bands.
-
When the closing price crosses above the upper band, a sell signal is triggered; when the closing price crosses below the lower band, a buy signal is triggered.
-
The strategy executes trades: open a long position when a buy signal is triggered, and close the position when a sell signal appears.
Through this process, the strategy establishes opposite positions when prices significantly deviate from the moving average, and profits when prices revert to the mean.
Advantages
The Bollinger Bands Mean Reversion Strategy has the following advantages:
-
Simple logic and easy to understand and implement. The strategy is based on basic statistical principles, using Bollinger Bands to characterize the range of price fluctuations, with clear entry and exit conditions.
-
High adaptability and applicability to multiple markets and instruments. Bollinger Bands are a versatile technical indicator with a certain level of adaptability to both trending and oscillating markets. Users can flexibly adjust parameters to adapt to different market characteristics.
-
Captures opportunities from price volatility. The expansion and contraction of Bollinger Bands reflect the volatility of prices. By establishing positions when prices reach relative highs or lows, the strategy seeks to profit from the reversion of prices to the mean.
-
Relatively clear take-profit and stop-loss levels. Since Bollinger Bands correspond to a certain confidence interval, the take-profit and stop-loss levels of this strategy are relatively easy to determine, which helps control risk.
Risk Analysis
Although the Bollinger Bands Mean Reversion Strategy has its advantages, it also carries certain risks:
-
Underperformance in trending markets. If the market exhibits a continuous unilateral trend, with prices persistently running near the upper or lower bands, the strategy may frequently incur losing trades.
-
Sensitivity to parameter settings. The period and multiple parameters of the Bollinger Bands have a significant impact on the strategy's performance. Different parameter combinations may lead to drastically different results. If the parameters are not set properly, the effectiveness of the strategy will be greatly diminished.
-
Risk of frequent oscillations. When market volatility is high and prices frequently oscillate between the upper and lower bands, the strategy may experience consecutive small losses, leading to a decline in overall profitability.
-
Lack of consideration for trading costs. The example code does not take into account factors such as spreads and commissions. In practical applications, these factors will impact the strategy's net profitability to a certain extent.
To address these risks, the following measures can be considered to optimize the strategy:
-
Incorporate trend indicators for filtering. When judging signals, auxiliary trend indicators such as moving averages can be used to avoid frequent trading in unilateral trends.
-
Optimize parameter selection. By backtesting historical data and analyzing the strategy's performance under different parameter combinations, select the optimal parameters suitable for the current market. Regularly evaluate and adjust parameters.
-
Introduce other filtering conditions. For example, consider volatility indicators like ATR and suspend trading when volatility is too high; or reference other indicators like trading volume to further confirm the reliability of signals.
-
Incorporate trading cost factors. In backtesting and live trading, spreads, commissions, and other trading costs should be included in calculations to more accurately assess the strategy's actual performance.
Optimization Directions
In addition to the risk mitigation measures mentioned above, the Bollinger Bands Mean Reversion Strategy can be optimized in the following aspects:
-
Dynamic parameter adjustment. Dynamically adjust the period and multiple parameters of the Bollinger Bands based on changes in the market. Consider using adaptive moving averages (such as KAMA) as the middle band or dynamically adjust the multiple parameter based on indicators like ATR to adapt to the current market rhythm.
-
Introduce long-short position management. When opening positions, dynamically adjust the position size based on the distance between the price and the middle band. The further away from the middle band, the smaller the position size to control risk; the closer to the middle band, the larger the position size to capture more opportunities.
-
Combine with other technical indicators. Use Bollinger Bands in conjunction with other technical indicators (such as RSI, MACD, etc.) to form a more robust signal confirmation mechanism. Only trade when multiple indicators resonate, improving the reliability of signals.
-
Consider multi-position management. Under appropriate conditions, multiple positions can be held simultaneously to diversify risk. For example, apply the strategy on different time frames or simultaneously open positions on different trading instruments to obtain more stable returns.
The purpose of these optimization measures is to improve the adaptability, robustness, and profitability of the strategy. Through dynamic adjustments, multi-indicator combinations, position management, and other means, the strategy can better cope with market changes, control risks, and capture more trading opportunities.
Summary
The Bollinger Bands Mean Reversion Strategy is a quantitative trading strategy based on statistical principles. It characterizes the range of price fluctuations using Bollinger Bands and takes opposite positions when prices deviate from the upper or lower bands, aiming to profit from mean reversion. The strategy has simple logic, strong adaptability, and the ability to capture opportunities from price volatility. However, it also faces risks such as underperformance in trending markets, sensitivity to parameter settings, and frequent oscillations.
To address these risks, optimization measures can be taken, such as incorporating trend indicators, optimizing parameter selection, introducing other filtering conditions, and considering trading costs. Furthermore, the strategy's adaptability and robustness can be enhanced through dynamic parameter adjustments, long-short position management, combining with other technical indicators, and multi-position management.
Overall, the Bollinger Bands Mean Reversion Strategy provides a simple yet effective approach to quantitative trading. In practical applications, the strategy needs to be appropriately optimized and refined based on specific market characteristics and trading requirements. Through continuous testing and adjustment, finding the most suitable trading method for oneself is the key to long-term success in quantitative trading.
[/trans]
Strategy Arguments
| Argument | Default | Description |
|---|---|---|
| v_input_int_1 | 20 | length |
| v_input_string_1 | 0 | Basis MA Type: SMA |
| v_input_1_close | 0 | Source: close |
| v_input_float_1 | 2 | StdDev |
Source (PineScript)
/*backtest
start: 2023-03-02 00:00:00
end: 2024-03-07 00:00:00
period: 1d
basePeriod: 1h
exchanges: [{"eid":"Futures_Binance","currency":"BTC_USDT"}]
*/

//@version=5
strategy("BB Strategy", shorttitle="BB", overlay=true)

length = input.int(20, minval=1)
maType = input.string("SMA", "Basis MA Type", options = ["SMA", "EMA", "SMMA (RMA)", "WMA", "VWMA"])
src = input(close, title="Source")
mult = input.float(2.0, minval=0.001, maxval=50, title="StdDev")

// Calculate moving average based on selected type
ma(source, length, _type) =>
    switch _type
        "SMA" => ta.sma(source, length)
        "EMA" => ta.ema(source, length)
        "SMMA (RMA)" => ta.rma(source, length)
        "WMA" => ta.wma(source, length)
        "VWMA" => ta.vwma(source, length)

// Calculate Bollinger Bands
basis = ma(src, length, maType)
dev = mult * ta.stdev(src, length)
upper = basis + dev
lower = basis - dev

// Plot Bollinger Bands
plot(basis, "Basis", color=#FF6D00)
p1 = plot(upper, "Upper", color=#2962FF)
p2 = plot(lower, "Lower", color=#2962FF)
fill(p1, p2, title = "Background", color=color.rgb(33, 150, 243, 95))

// Buy condition: Price below lower Bollinger Band
buy_condition = close < lower
// Sell condition: Price above upper Bollinger Band
sell_condition = close > upper

// Execute trades
strategy.entry("Buy", strategy.long, when=buy_condition)
strategy.close("Buy", when=sell_condition)
Detail
https://www.fmz.com/strategy/443997
Last Modified
2024-03-08 14:46:15