
8.1 KiB
Name
基于布林带和赫尔指标的交叉策略Crossing-Strategy-Between-Bollinger-Bands-and-Hull-Indicator
Author
ChaoZhang
Strategy Description
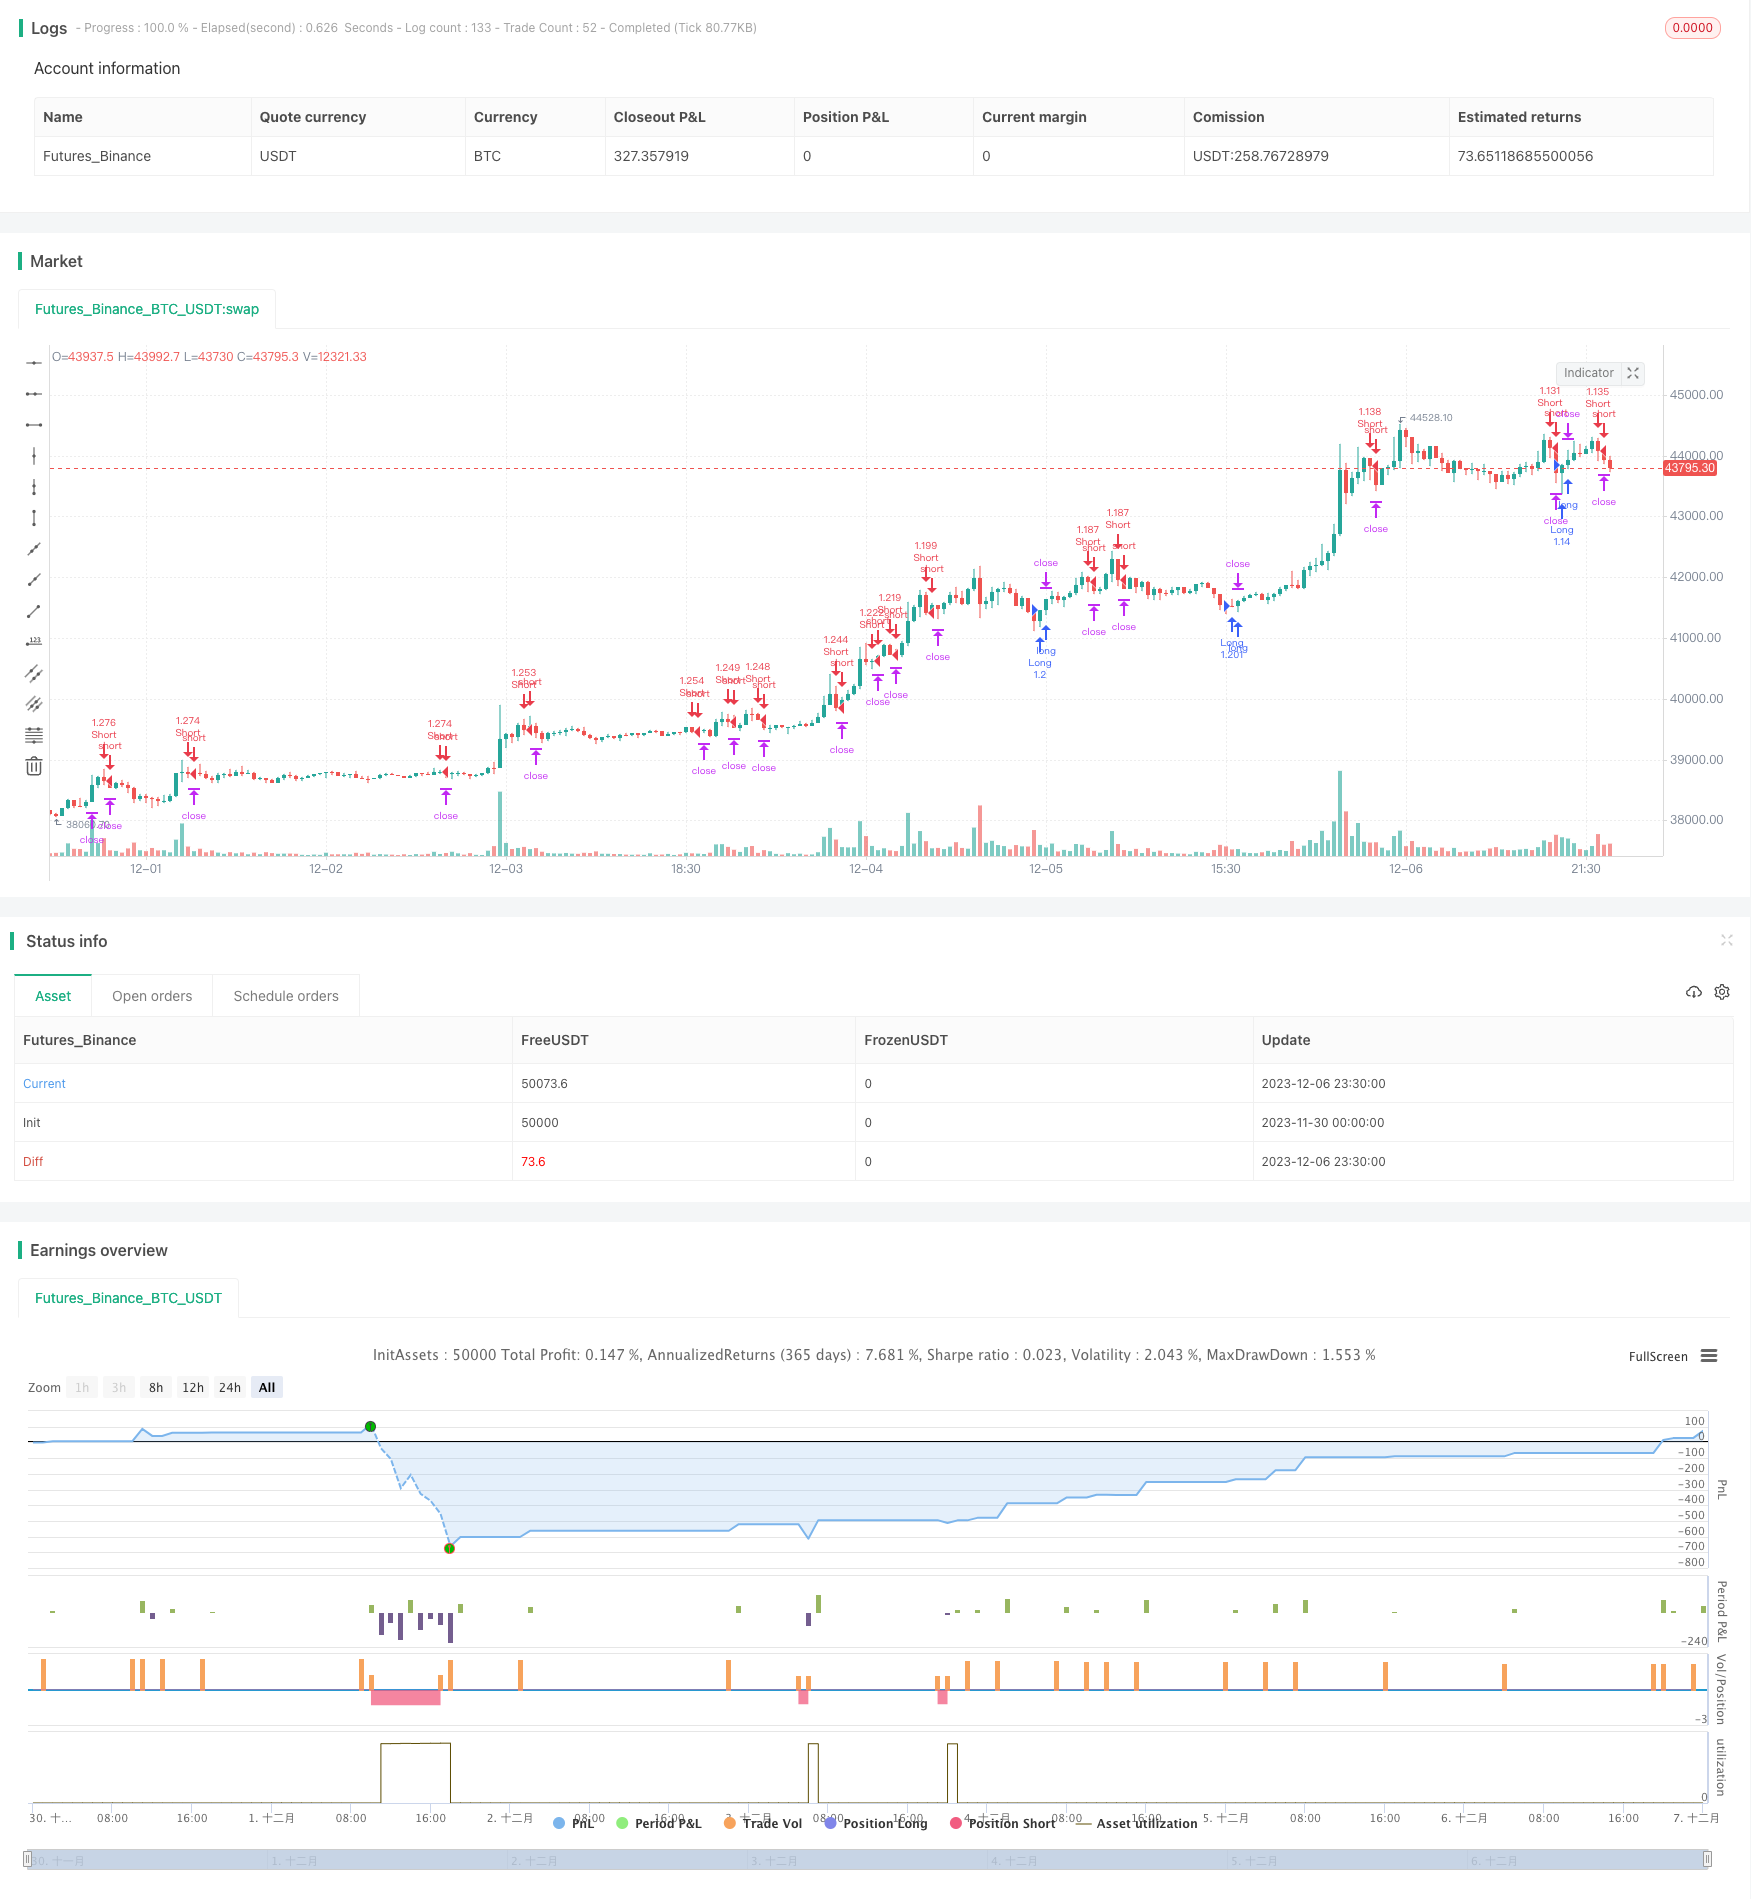 [trans]
概述
该策略是基于布林带和赫尔指标的交叉来生成交易信号的。当赫尔指标上穿布林带下轨时做多,当赫尔指标下穿布林带上轨时做空。该策略结合了布林带的突破策略和赫尔指标的趋势跟踪策略,从而利用两者的优点。
策略原理
该策略主要基于布林带和赫尔指标的交叉来产生交易信号。
首先,布林带包含三条线:中轨线、上轨线和下轨线。中轨线是n日移动平均线,上下轨线分别是中轨线上下各加一个标准差。如果价格突破上轨,代表有突破的机会;如果价格跌破下轨,代表有回调的机会。
其次,赫尔指标是一种趋势跟踪指标。它利用两个不同周期的加权移动平均线之间的差值,来判断目前的走势。如果短期平均线高于长期平均线就属于多头向上,反之就属于空头向下。
该策略就是结合这两个指标的优点。当赫尔指标上穿布林带下轨时,认为股价可能进入趋势向上阶段,这时做多;当赫尔指标下穿布林带上轨时,认为股价可能进入回调向下阶段,这时做空。
策略优势
-
结合布林带和赫尔指标两个指标的优点,使交易信号更加可靠。
-
利用赫尔指标判断趋势方向,以及布林带判断支撑阻力位置,形成交叉信号,可以提高盈利概率。
-
通过调整布林带和赫尔指标的参数,可以针对不同周期的股票进行优化,适用面更广。
风险及解决方法
-
当股价处于横盘整理时,该策略可能会产生更多假信号,带来亏损。可以通过优化参数或增加过滤条件来减少假信号。
-
股价剧烈波动时,布林带和赫尔指标可能同时发出交易信号,需要确保信号顺序性,避免交叉信号判断错误。可以考虑加入止损来控制亏损。
-
代码中直接设置了开仓数量为100%。实际部署时,需要调整仓位管理,不能全仓开仓,可能导致亏损扩大。
优化方向
-
可以测试优化布林带和赫尔指标的参数,适应更多周期的股票。
-
增加交易量或波动率的过滤器,避免在盘整时出现错误信号。
-
优化止损策略,设置移动止损或挂单止损。
-
调整仓位管理规则,加入重新进入场内的条件,避免亏损扩大。
总结
本策略综合利用布林带的突破策略和赫尔指标的趋势跟踪策略,通过二者的交叉形成交易信号,实现趋势跟踪和突破的双重效果。该策略在基本面不发生重大变化的前提下,对中短线股票具有较强的适应性。但实际部署时,仍需要针对个股特点进行参数优化,并适当调整仓位管理、止损策略等,从而使策略更加稳健。
||
Summary
This strategy generates trading signals based on the crossover between Bollinger Bands and the Hull indicator. It goes long when the Hull indicator crosses above the lower band of Bollinger Bands, and goes short when the Hull indicator crosses below the upper band of Bollinger Bands. The strategy combines the breakout strategy of Bollinger Bands and the trend-following strategy of the Hull indicator to utilize the advantages of both.
Principles
The strategy mainly uses the crossover between Bollinger Bands and the Hull indicator to generate trading signals.
Bollinger Bands contain three lines: middle line, upper line and lower line. The middle line is the N-day moving average, while the upper and lower lines are middle line ± standard deviation. If price breaks through the upper line, it indicates a breakthrough opportunity; if price breaks through the lower line, it indicates a callback opportunity.
The Hull indicator is a trend-following indicator. It uses the difference between two weighted moving averages of different periods to determine the current trend. If the short period moving average is above the long period one, it indicates an uptrend, and vice versa.
The strategy combines the strengths of both indicators. When the Hull indicator crosses above the lower band of Bollinger Bands, it is considered that stock price may enter an uptrend, so go long. When the Hull indicator crosses below the upper band, it is considered that stock price may enter a downward callback, so go short.
Advantages
-
Combines the strengths of Bollinger Bands and Hull indicator to make trading signals more reliable.
-
Uses Hull indicator to determine trend direction and Bollinger Bands to determine support/resistance levels, generating crossover signals to improve profitability.
-
Parameters of both indicators can be optimized for stocks of different cycles to expand applicability.
Risks and Solutions
-
The strategy may generate more false signals during range-bound movements, causing losses. Parameters can be optimized or filters can be added to reduce false signals.
-
Prices may fluctuate violently, causing both indicators to issue signals simultaneously. Ensure signal sequencing to avoid erroneous crossover signal judgment. Consider adding stop loss to control losses.
-
Strategy sets position size to 100% directly. In actual deployment, position sizing needs to be adjusted to avoid magnified losses due to full position opening.
Optimization Directions
-
Test and optimize parameters of both indicators to adapt to more stock cycles.
-
Add filters like trading volume or volatility to avoid wrong signals during consolidation.
-
Optimize stop loss strategies by setting trailing stop loss or stop limit orders.
-
Adjust position sizing rules by adding re-entry conditions to avoid loss magnification.
Conclusion
This strategy combines the breakout strategy of Bollinger Bands and trend-following strategy of the Hull indicator by using crossover signals between them to achieve both trend-following and breakout effects. The strategy has strong adaptability to medium- and short-term stocks given no major fundamental changes. But parameters, position sizing, stop loss strategies still need optimization during actual deployment to make the strategy more robust.
[/trans]
Strategy Arguments
| Argument | Default | Description |
|---|---|---|
| v_input_1 | 3 | period |
| v_input_2 | true | i |
| v_input_3 | 20 | length1 |
| v_input_4_close | 0 | Source: close |
| v_input_5 | 2 | mult |
| v_input_6 | 500 | TP |
| v_input_7 | 500 | SL |
| v_input_8 | 20 | TS |
| v_input_9 | 10 | TO |
Source (PineScript)
/*backtest
start: 2023-11-30 00:00:00
end: 2023-12-07 00:00:00
period: 30m
basePeriod: 15m
exchanges: [{"eid":"Futures_Binance","currency":"BTC_USDT"}]
*/


//@version=3
strategy(title="Strategy Hull Bollinger", shorttitle="Hull bollinger",overlay=true, calc_on_order_fills=true, default_qty_type=strategy.percent_of_equity, default_qty_value=100, overlay=false)

n=input(title="period",defval=3)


n2ma=2*wma(close,round(n/2))
nma=wma(close,n)
diff=n2ma-nma
sqn=round(sqrt(n))


n2ma1=2*wma(close[1],round(n/2))
nma1=wma(close[1],n)
diff1=n2ma1-nma1
sqn1=round(sqrt(n))


n1=wma(diff,sqn)
n2=wma(diff1,sqn)
c=n1>n2?green:red

i = input(1)
PP = close[i]

length1 = input(20, minval=1)
src = input(close, title="Source")
mult = input(2.0, minval=0.001, maxval=10, step=0.2)
basis = sma(src, length1)
dev = mult * stdev(src, length1)
upper = basis + dev
lower = basis - dev


TP = input(500) * 10
SL = input(500) * 10
TS = input(20) * 10
TO = input(10) * 10
CQ = 100

TPP = (TP > 0) ? TP : na
SLP = (SL > 0) ? SL : na
TSP = (TS > 0) ? TS : na
TOP = (TO > 0) ? TO : na

longCondition = crossover(n1,lower)
if (longCondition)
    strategy.entry("Long", strategy.long)


shortCondition = crossunder(n1,upper)
if (shortCondition)
    strategy.entry("Short", strategy.short)

strategy.exit("Close Short", "Short", qty_percent=CQ, profit=TPP, loss=SLP, trail_points=TSP, trail_offset=TOP)
strategy.exit("Close Long", "Long", qty_percent=CQ, profit=TPP, loss=SLP, trail_points=TSP, trail_offset=TOP)
Detail
https://www.fmz.com/strategy/434681
Last Modified
2023-12-08 11:58:07