
8.7 KiB
Name
基于布林带和指数移动平均线的趋势追踪策略Trend-Tracking-Strategy-Based-on-Bollinger-Bands-and-Exponential-Moving-Average
Author
ChaoZhang
Strategy Description
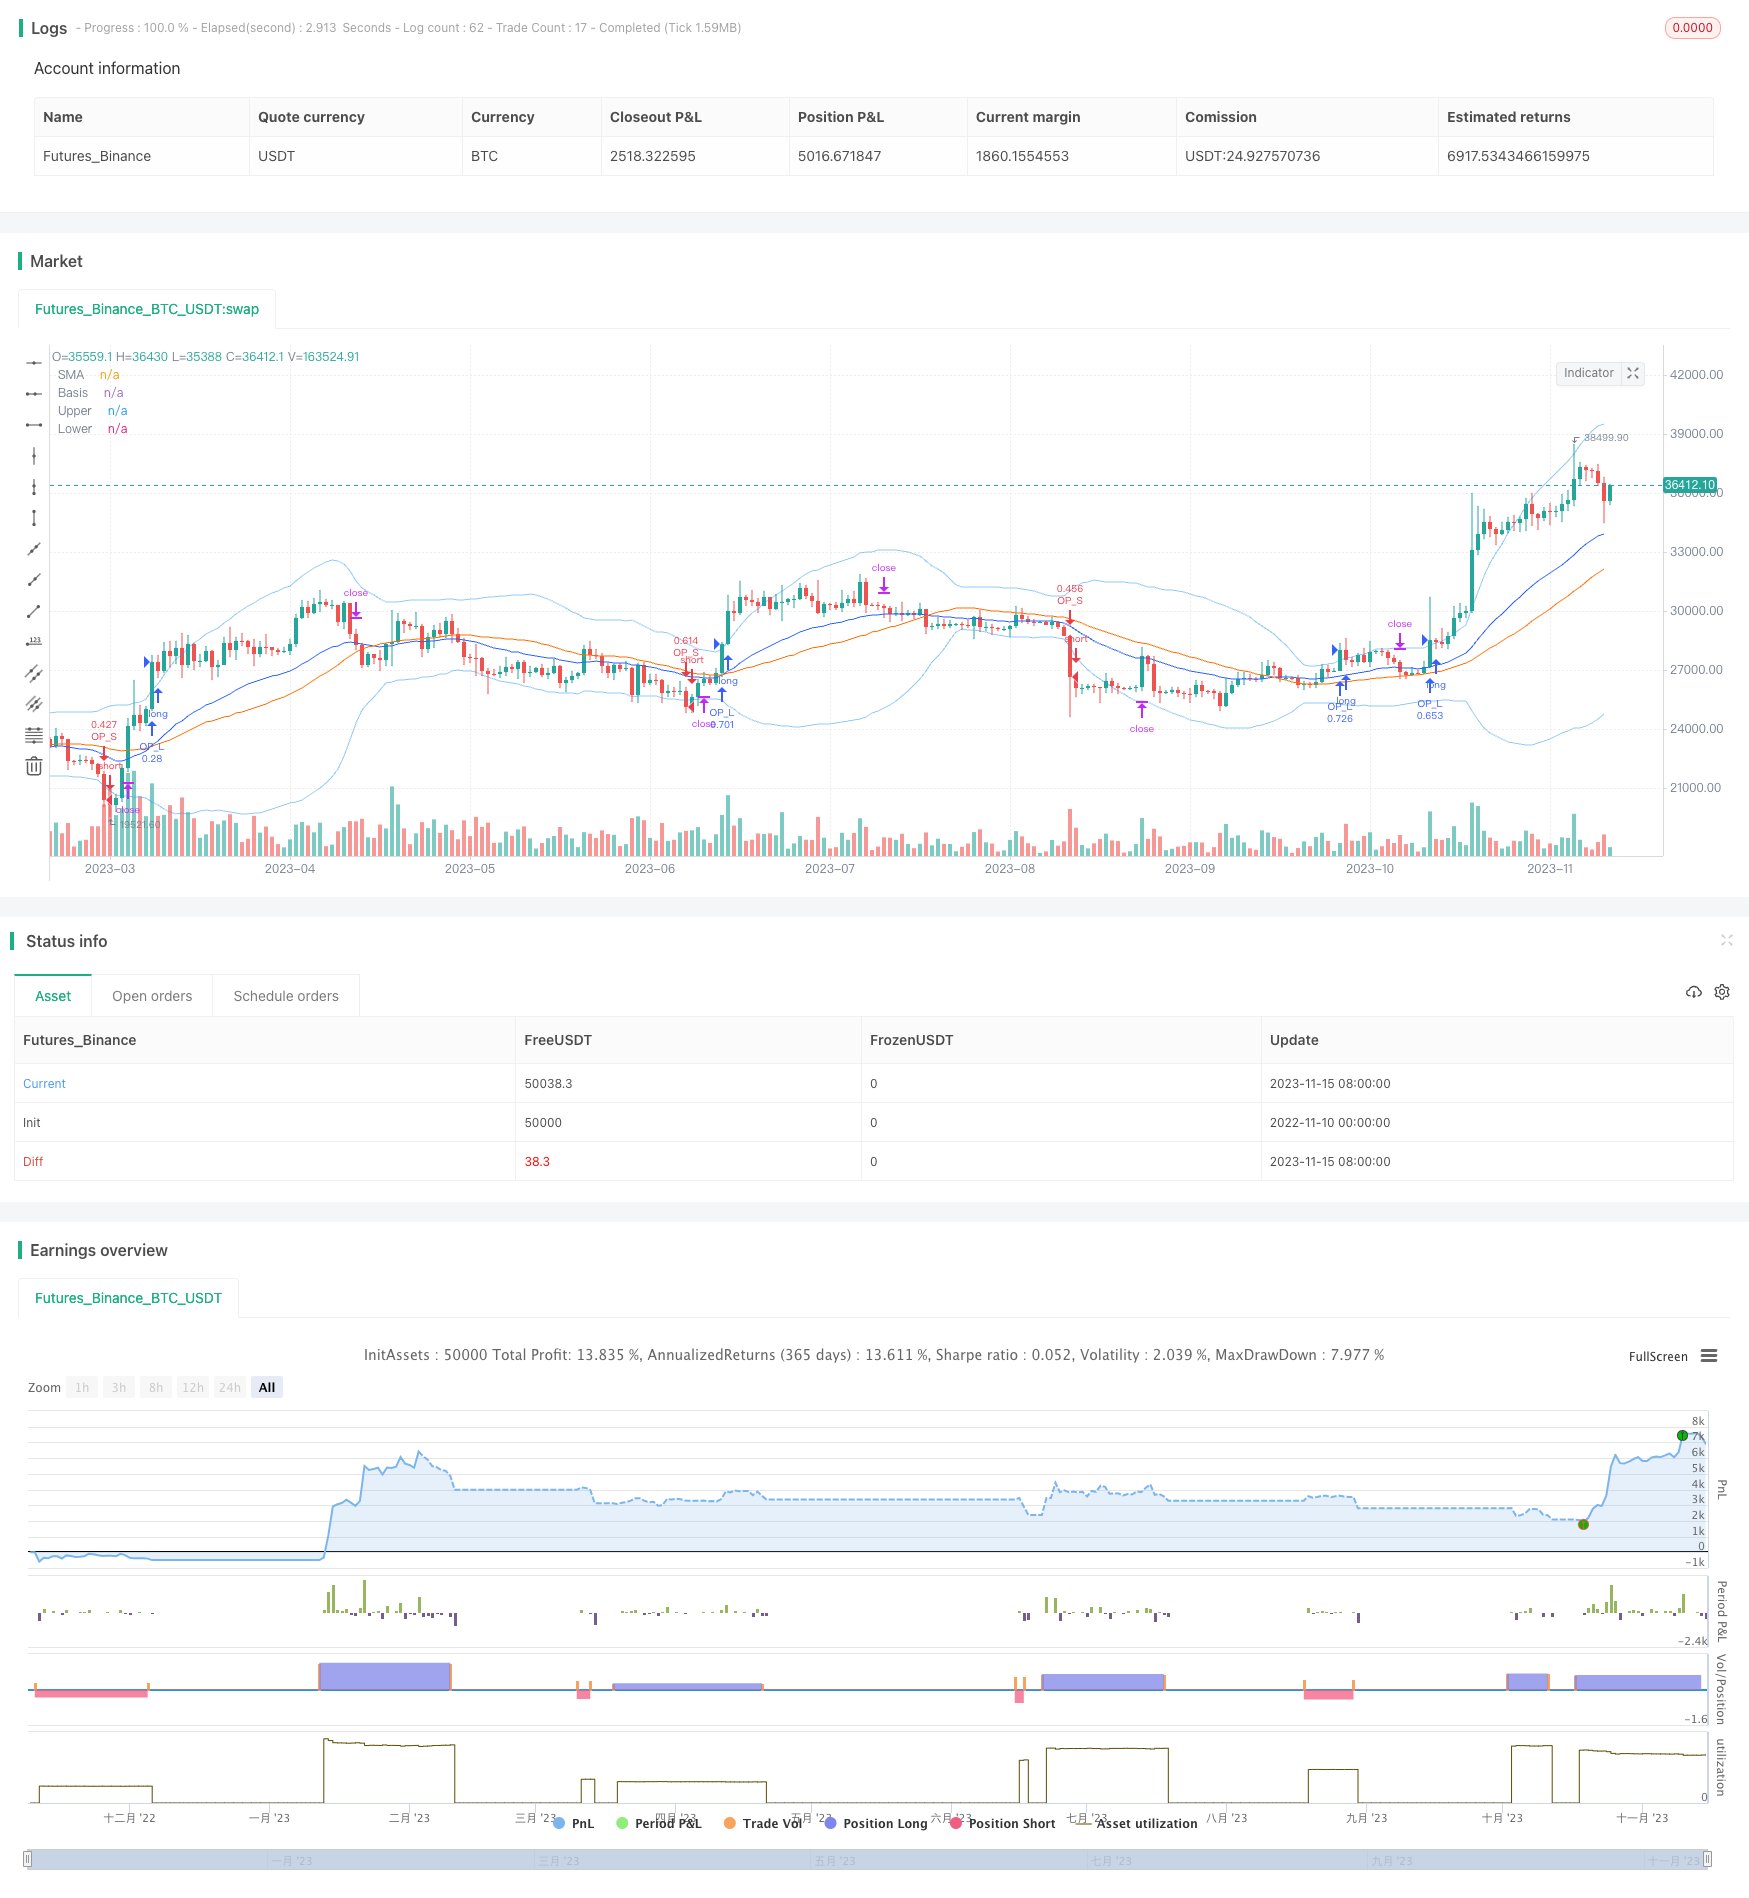 [trans]
概述
该策略利用布林带指标判断当前趋势方向,并结合指数移动平均线进行止损止盈管理,实现对趋势的有效捕捉。
原理解析
该策略首先计算布林带的中线、上轨和下轨。中线为n天收盘价的简单移动平均线,上下轨分别为中线上下偏移两个标准差。当收盘价高于上轨时,表明行情处于看涨趋势;当收盘价低于下轨时,表明行情处于看跌趋势。
策略通过比较收盘价与布林带上下轨的关系,判断当前趋势方向。如果收盘价突破上轨,做多;如果收盘价突破下轨,做空。
此外,策略还引入指数移动平均线,作为止损止盈的trailing stop。具体来说,如果做多之后,价格向下回落,止损线会随之下移,使止损距离逐步收紧,最大限度锁定利润。如果价格继续上涨,止损线也会上移,让利润继续运行。做空情况下止损机制相反。
优势分析
该策略结合布林带判断趋势方向和EMA进行止损止盈管理,具有以下优势:
-
使用布林带能有效判断趋势方向,对突破做出快速反应。
-
基于EMA的止损止盈,能够最大限度锁定利润,在保证盈利的同时控制风险。
-
策略参数较少,容易实施。布林带一个参数,EMA一个参数,非常简洁。
-
可广泛应用于不同品种,具有很强的适应性。
风险及优化思路
该策略也存在一些风险需要注意:
-
布林带上下轨突破并不能完全避免假突破带来的风险。可以结合交易量等指标过滤信号。
-
EMA参数设置需要根据具体品种谨慎测试。EMA周期过短可能增加止损次数,过长则追踪效果下降。
-
需要注意防止过优化。布林带和EMA参数组合太多可能导致过拟合。
对于风险的解决和优化方向,可以考虑以下思路:
-
增加交易量或MACD等指标,过滤假突破信号。
-
对EMA周期进行优化测试,选择对具体品种更合适的参数。
-
尽量保持布林带和EMA参数稳定,避免过度优化导致的过拟合风险。
-
可以考虑在趋势中期结合RSI等指标,确定是否调整仓位。
总结
本策略整合布林带判断趋势与EMA进行止损止盈管理,形成了一个较为完整的趋势跟踪体系。它能快速捕捉趋势方向,并通过不断调整止损线锁定利润。总体来说,该策略较简单实用,适应性强,值得进一步测试优化。但也需要注意参数设定及风控,防止出现误判和过优化的问题。结合其他技术指标进一步完善,将是未来的优化方向。
||
Overview
This strategy uses Bollinger Bands to determine the current trend direction and exponential moving average for stop loss and take profit management to effectively capture the trend.
Principles
The strategy first calculates the middle line, upper band and lower band of Bollinger Bands. The middle line is the simple moving average of the closing price over n days. The upper and lower bands are shifted up and down by two standard deviations from the middle line. When the closing price is above the upper band, it indicates an uptrend. When the closing price is below the lower band, it indicates a downtrend.
The strategy judges the current trend direction by comparing the relationship between the closing price and the upper/lower bands of Bollinger Bands. If the closing price breaks through the upper band, go long. If the closing price breaks through the lower band, go short.
In addition, the exponential moving average is introduced as a trailing stop for stop loss and take profit. Specifically, if the price moves down after going long, the stop loss line will move down accordingly, gradually tightening the stop loss distance to maximize profit locking. If the price keeps rising, the stop loss line will also move up to let the profit run. The stop loss mechanism works in reverse for short positions.
Advantages
The strategy combining Bollinger Bands for trend direction and EMA for stop loss/take profit management has the following advantages:
-
Using Bollinger Bands can effectively determine the trend direction and react quickly to breakouts.
-
EMA-based stop loss/take profit can maximize profit locking while controlling risks.
-
The strategy has few parameters which are easy to implement - just one for BB and one for EMA, very simple.
-
It can be widely applied to different products with strong adaptability.
Risks and Optimization
The strategy also has some risks to note:
-
Breaking through BB upper/lower bands cannot completely avoid the risk of false breakouts. Consider combining with volume etc. to filter signals.
-
EMA parameter setting needs careful testing according to specific products. Too short EMA period may increase stop loss times. Too long will decrease trailing effectiveness.
-
Over-optimization needs to be avoided. Too many combinations of BB and EMA parameters may lead to overfitting.
For addressing the risks and optimization directions, the following can be considered:
-
Add volume or MACD etc. to filter false breakout signals.
-
Optimize EMA period through testing to find the most suitable parameter for specific products.
-
Try to keep BB and EMA parameters stable as much as possible to avoid overfitting risks from over-optimization.
-
Consider using RSI etc. to determine position adjustment in the mid-term trend.
Summary
This strategy integrates using Bollinger Bands to determine the trend and EMA for stop loss/take profit management to form a relatively complete trend tracking system. It can quickly capture the trend direction and lock in profits by continuously adjusting the stop loss line. Overall, the strategy is relatively simple, practical and adaptable, worth further testing and optimization. But the parameter settings and risk control need to be noted to prevent misjudgments and over-optimization. Combining with other technical indicators for further improvement will be the direction going forward.
[/trans]
Strategy Arguments
| Argument | Default | Description |
|---|---|---|
| v_input_1 | timestamp(2020-01-01T00:00:00) | Start Date |
| v_input_2 | timestamp(2030-01-01T00:00:00) | Stop Date |
| v_input_3 | 40 | length |
| v_input_4_close | 0 | Source: close |
| v_input_5 | 2 | StdDev |
| v_input_6 | true | stopcon/lot |
| v_input_7 | true | lot |
| v_input_8 | 1000 | stopcon |
| v_input_9 | true | emacon |
| v_input_10 | 30 | value |
Source (PineScript)
/*backtest
start: 2022-11-10 00:00:00
end: 2023-11-16 00:00:00
period: 1d
basePeriod: 1h
exchanges: [{"eid":"Futures_Binance","currency":"BTC_USDT"}]
*/

// This source code is subject to the terms of the Mozilla Public License 2.0 at https://mozilla.org/MPL/2.0/
// © zxcv55602
//@version=4
strategy(shorttitle=" BB+EMA", title="Bollinger Bands", overlay=true)
date1 = input(title="Start Date", type=input.time, defval=timestamp("2020-01-01T00:00:00"))
date2 = input(title="Stop Date", type=input.time, defval=timestamp("2030-01-01T00:00:00"))
length = input(40, minval=1)
src = input(close, title="Source")
mult = input(2.0,title="StdDev",step=0.1)
basis = sma(src, length)
dev = mult * stdev(src, length)
upper = basis + dev
lower = basis - dev
//offset = input(0, "Offset", minval = -500, maxval = 500)
offset=0
stopcon=input(title="stopcon/lot", type=input.bool, defval=true)
lot1=input(title="lot",defval=1)
stoploss=input(title="stopcon",defval=1000)
emacon=input(title="emacon", type=input.bool, defval=true)
ema_value=input(title="value",defval=30, minval=2,step=1)
plot(basis, "Basis", color=#FF6D00, offset = offset)
p1 = plot(upper, "Upper", color=color.new(color.blue,50), offset = offset)
p2 = plot(lower, "Lower", color=color.new(color.blue,50), offset = offset)
ema1=ema(close,ema_value)
plot(ema1, "SMA", color=#2962FF)
period() => true
//-----------
if period()
    if strategy.opentrades==0 and ema1<upper
        if close>upper
            lot_L=stoploss/((close-lower)/2)
            strategy.entry("OP_L",strategy.long,qty=stopcon==true?lot_L:lot1,stop=emacon==true?max(basis,ema1):basis)
    if strategy.opentrades==0 and ema1>lower
        if close<lower
            lot_S=stoploss/((upper-close)/2)
            strategy.entry("OP_S",strategy.short,qty=stopcon==true?lot_S:lot1,stop=emacon==true?min(basis,ema1):basis)
    if strategy.position_size>0
        strategy.exit("OP_L",stop=emacon==true?max(basis,ema1):basis,comment="exit_L")
    if strategy.position_size<0
        strategy.exit("OP_S",stop=emacon==true?min(basis,ema1):basis,comment="exit_S")
Detail
https://www.fmz.com/strategy/432425
Last Modified
2023-11-17 17:36:43