
9.4 KiB
Name
基于大量级蜡烛线与RSI背离的高级止损动态追踪策略-Advanced-Dynamic-Stop-Loss-Strategy-Based-on-Large-Candles-and-RSI-Divergence
Author
ChaoZhang
Strategy Description
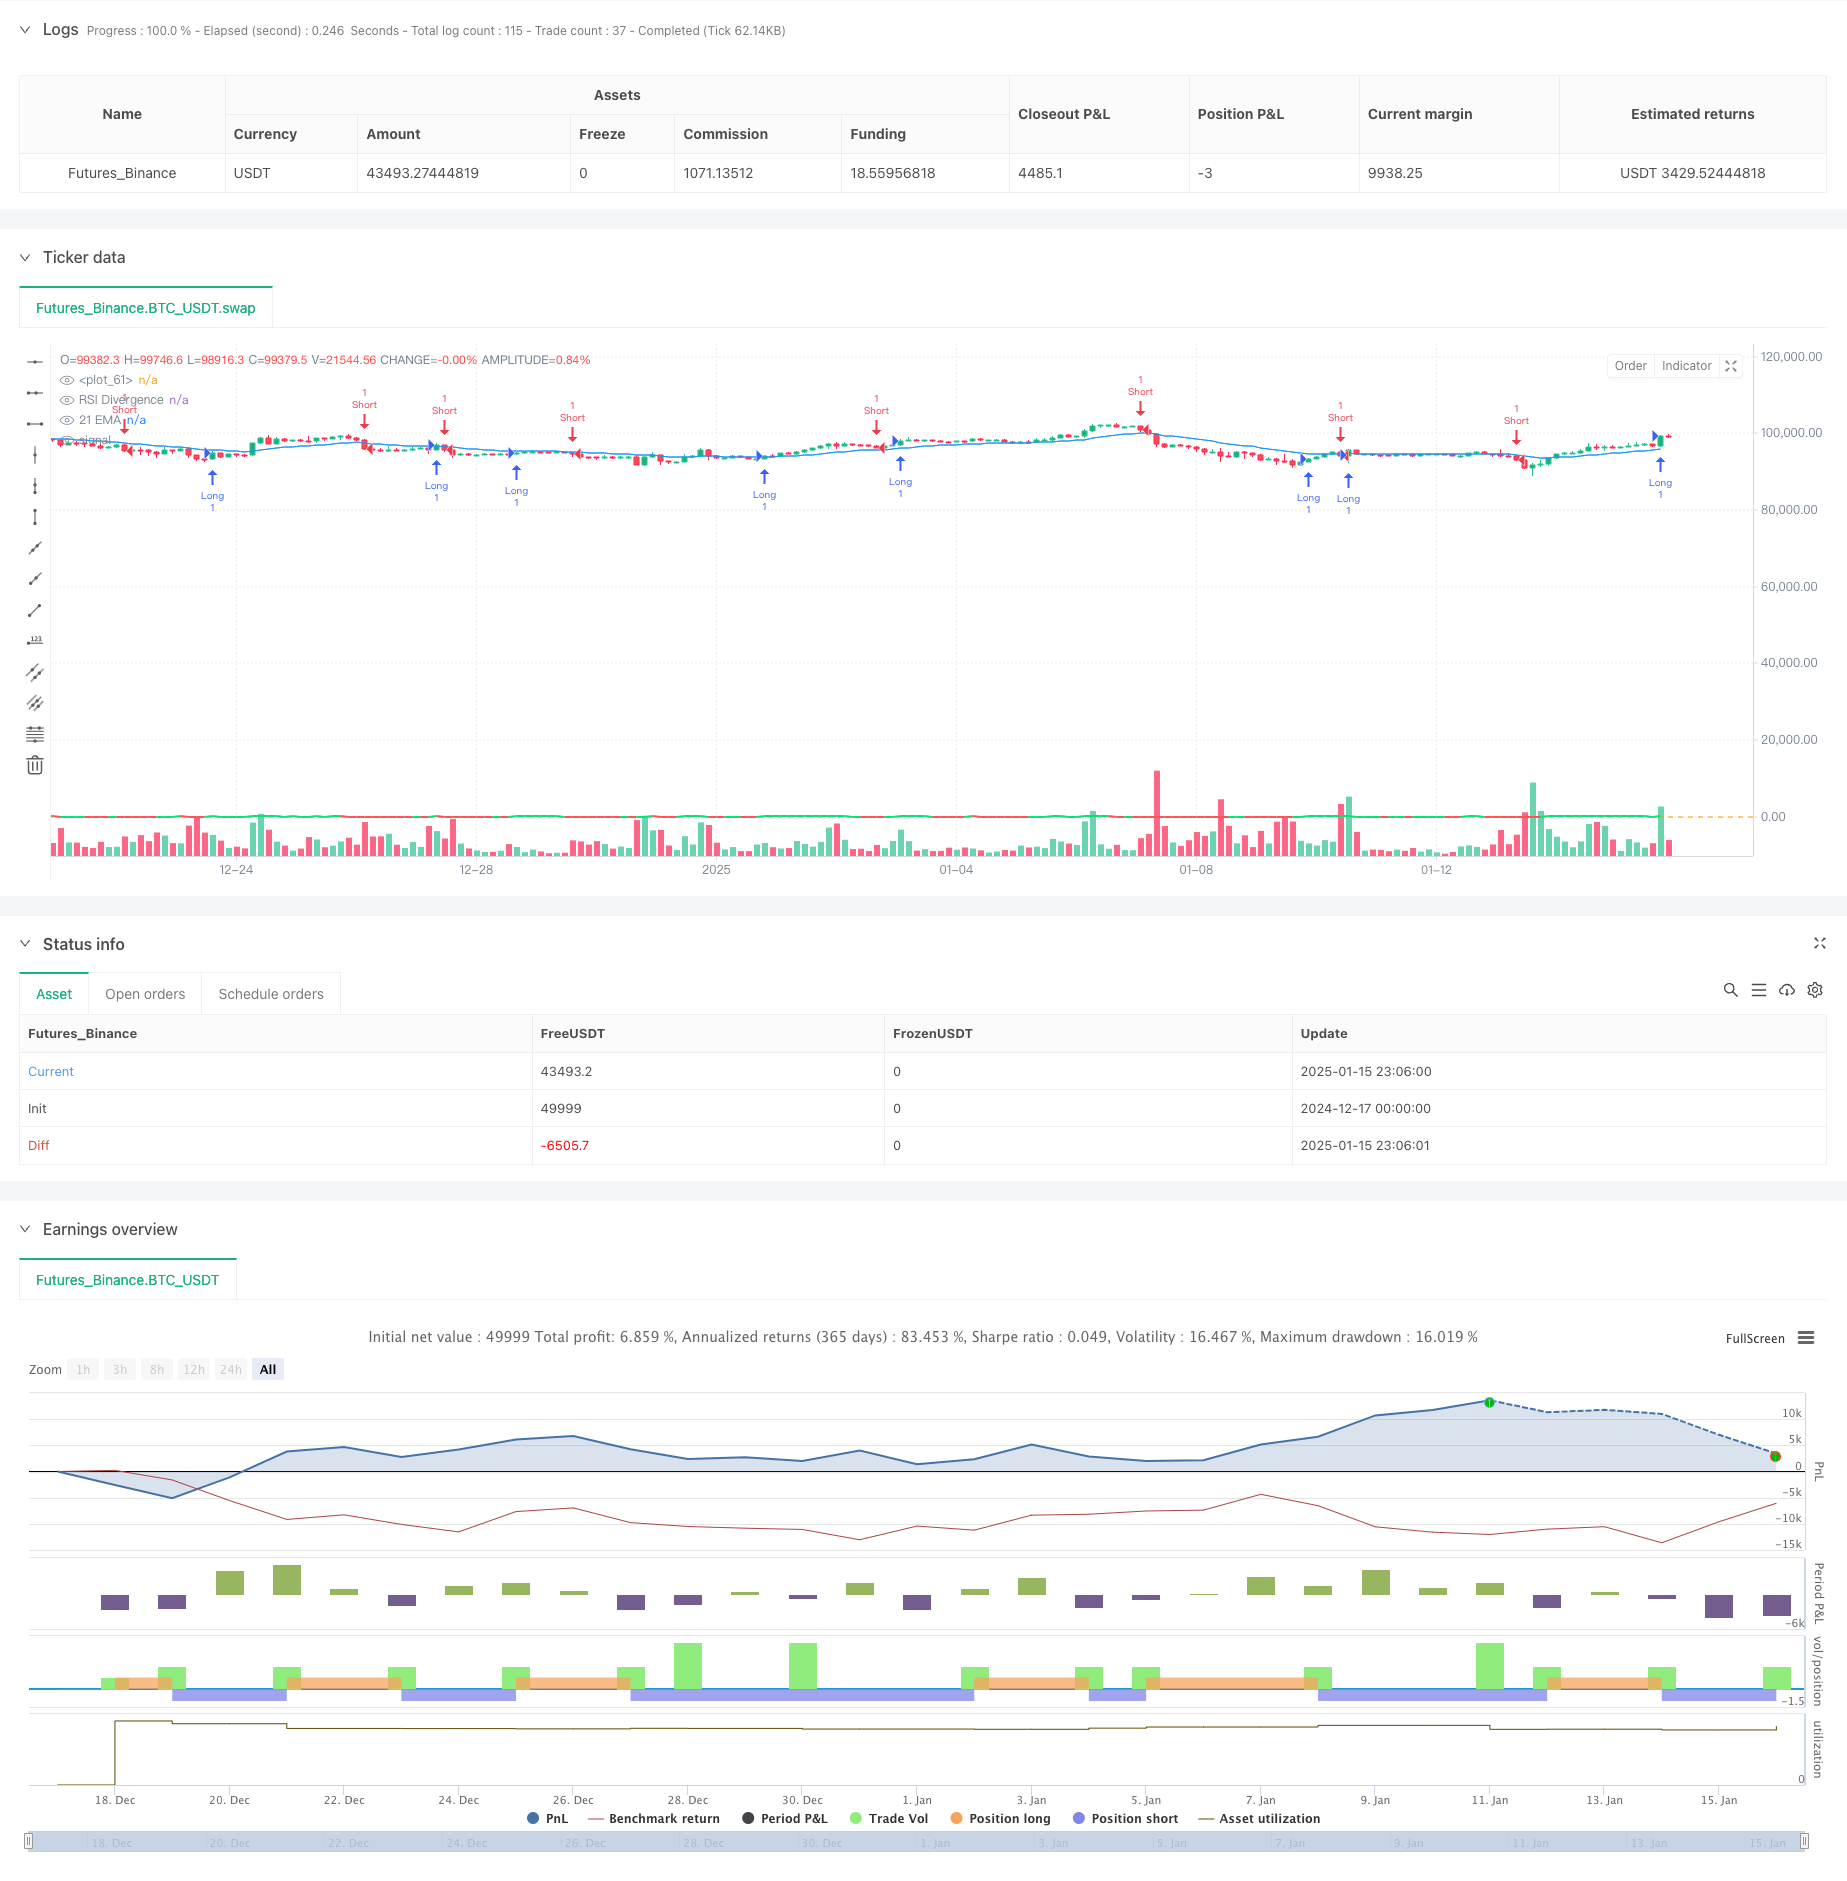
[trans]
概述
本策略基于大量级蜡烛线识别与RSI背离指标作为主要信号,结合初始固定止损和动态追踪止损,形成一套完整的趋势跟踪交易系统。策略通过对比当前蜡烛线与前5根蜡烛线的实体大小来识别大量级行情,同时利用快速与慢速RSI的背离来确认动量变化,最后运用双重止损机制来管理风险和锁定利润。
策略原理
策略包含四个核心组件:1)大量级蜡烛线识别 - 通过对比当前与前5根蜡烛线实体大小来确定显著的价格动量;2)RSI背离分析 - 使用5周期快速RSI和14周期慢速RSI的差值来衡量动量变化;3)初始止损 - 在入场时设置200点的固定止损以控制初始风险;4)追踪止损 - 在盈利达到200个点后激活,与价格保持150个点的动态跟随距离。策略还使用21周期EMA作为趋势过滤器,帮助判断整体市场方向。
策略优势
- 风险管理全面 - 通过固定止损限制最大损失,利用追踪止损保护已实现利润
- 入场信号可靠 - 大量级蜡烛线通常代表强势的价格动量,提供较高概率的交易机会
- 信号确认充分 - RSI背离作为辅助指标,帮助验证动量变化,降低虚假信号风险
- 利润保护灵活 - 动态追踪止损机制允许在保护利润的同时捕捉更大的价格走势
- 参数可调整性强 - 关键参数如追踪起始点、追踪距离和初始止损都可根据不同市场特征进行优化
策略风险
- 震荡市场风险 - 在横盘整理阶段可能频繁触发止损
- 跳空风险 - 大幅跳空可能导致实际止损点位与预期不符
- 滑点风险 - 在快速行情中可能面临较大滑点,影响实际执行效果
- 假突破风险 - 大量级蜡烛线后可能出现假突破,导致止损出场
- 参数敏感性 - 止损参数的设置对策略表现影响较大
策略优化方向
- 市场环境过滤 - 建议添加波动率指标如ATR,在低波动率环境下暂停交易
- 入场时机优化 - 可结合价格形态或其他技术指标,提高入场时机的准确性
- 止损参数动态化 - 考虑根据市场波动性动态调整追踪止损距离
- 仓位管理改进 - 可引入基于波动率的仓位sizing机制
- 增加趋势强度过滤 - 可添加趋势强度指标,在强趋势中采用更宽松的止损设置
总结
该策略通过结合大量级蜡烛线和RSI背离构建了一个完整的趋势跟踪系统,并通过双重止损机制实现了全面的风险管理。策略适合在趋势明确、波动性较大的市场环境中运作,但需要交易者根据具体市场特征调整参数设置。通过建议的优化方向,策略的稳定性和盈利能力有望得到进一步提升。
||
Overview
This strategy combines large candle identification and RSI divergence as primary signals, incorporating both initial fixed stops and dynamic trailing stops to form a complete trend-following trading system. The strategy identifies significant price movements by comparing the current candle body with the previous five candles, confirms momentum changes using fast and slow RSI divergence, and employs a dual-stop mechanism for risk management and profit protection.
Strategy Principles
The strategy consists of four core components: 1)Large Candle Identification - determining significant price momentum by comparing current candle body with previous five candles; 2)RSI Divergence Analysis - measuring momentum changes using the difference between 5-period fast RSI and 14-period slow RSI; 3)Initial Stop - setting a 200-point fixed stop loss at entry to control initial risk; 4)Trailing Stop - activating after 200 points profit, maintaining a dynamic 150-point following distance. The strategy also uses 21-period EMA as a trend filter to help determine overall market direction.
Strategy Advantages
- Comprehensive Risk Management - Limiting maximum loss through fixed stops while protecting realized profits with trailing stops
- Reliable Entry Signals - Large candles typically represent strong price momentum, providing high-probability trading opportunities
- Sufficient Signal Confirmation - RSI divergence as a supplementary indicator helps validate momentum changes and reduces false signal risks
- Flexible Profit Protection - Dynamic trailing stop mechanism allows capturing larger price moves while protecting gains
- Strong Parameter Adaptability - Key parameters like trailing start point, trailing distance, and initial stop can be optimized for different market characteristics
Strategy Risks
- Choppy Market Risk - Frequent stop-outs may occur during consolidation phases
- Gap Risk - Large gaps may cause actual stop levels to differ from expected
- Slippage Risk - Fast markets may lead to significant slippage affecting execution quality
- False Breakout Risk - False breakouts after large candles may trigger stop losses
- Parameter Sensitivity - Stop loss parameters significantly impact strategy performance
Strategy Optimization Directions
- Market Environment Filtering - Suggest adding volatility indicators like ATR, pausing trades in low volatility environments
- Entry Timing Optimization - Can combine price patterns or other technical indicators to improve entry timing accuracy
- Dynamic Stop Loss Parameters - Consider dynamically adjusting trailing stop distance based on market volatility
- Position Management Improvement - Can introduce volatility-based position sizing mechanism
- Enhanced Trend Strength Filtering - Can add trend strength indicators, using wider stops in strong trends
Summary
The strategy builds a complete trend-following system by combining large candles and RSI divergence, achieving comprehensive risk management through a dual-stop mechanism. It is suitable for markets with clear trends and higher volatility, but requires parameter adjustment based on specific market characteristics. Through the suggested optimization directions, the strategy's stability and profitability can be further enhanced. [/trans]
Source (PineScript)
/*backtest
start: 2024-12-17 00:00:00
end: 2025-01-16 00:00:00
period: 3h
basePeriod: 3h
exchanges: [{"eid":"Futures_Binance","currency":"BTC_USDT","balance":49999}]
*/

//@version=6
strategy('[F][IND] - Big Candle Identifier with RSI Divergence and Advanced Stops', shorttitle = '[F][IND] Big Candle RSI Trail', overlay = true)

// Inputs for the trailing stop and stop loss
trail_start_ticks = input.int(200, "Trailing Start Ticks", tooltip="The number of ticks the price must move in the profitable direction before the trailing stop starts.")
trail_distance_ticks = input.int(150, "Trailing Distance Ticks", tooltip="The distance in ticks between the trailing stop and the price once the trailing stop starts.")
initial_stop_loss_points = input.int(200, "Initial Stop Loss Points", tooltip="The fixed stop loss applied immediately after entering a trade.")

// Tick size based on instrument
tick_size = syminfo.mintick

// Calculate trailing start and distance in price
trail_start_price = trail_start_ticks * tick_size
trail_distance_price = trail_distance_ticks * tick_size
initial_stop_loss_price = initial_stop_loss_points * tick_size

// Identify big candles
body0 = math.abs(close[0] - open[0])
body1 = math.abs(close[1] - open[1])
body2 = math.abs(close[2] - open[2])
body3 = math.abs(close[3] - open[3])
body4 = math.abs(close[4] - open[4])
body5 = math.abs(close[5] - open[5])

bullishBigCandle = body0 > body1 and body0 > body2 and body0 > body3 and body0 > body4 and body0 > body5 and open < close
bearishBigCandle = body0 > body1 and body0 > body2 and body0 > body3 and body0 > body4 and body0 > body5 and open > close

// RSI Divergence
rsi_fast = ta.rsi(close, 5)
rsi_slow = ta.rsi(close, 14)
divergence = rsi_fast - rsi_slow

// Trade Entry Logic
if bullishBigCandle
    strategy.entry('Long', strategy.long, stop=low - initial_stop_loss_price)
if bearishBigCandle
    strategy.entry('Short', strategy.short, stop=high + initial_stop_loss_price)

// Trailing Stop Logic
var float trail_stop = na
if strategy.position_size > 0 // Long Position
    entry_price = strategy.position_avg_price
    current_profit = close - entry_price
    if current_profit >= trail_start_price
        trail_stop := math.max(trail_stop, close - trail_distance_price)
    strategy.exit("Trailing Stop Long", "Long", stop=trail_stop)

if strategy.position_size < 0 // Short Position
    entry_price = strategy.position_avg_price
    current_profit = entry_price - close
    if current_profit >= trail_start_price
        trail_stop := math.min(trail_stop, close + trail_distance_price)
    strategy.exit("Trailing Stop Short", "Short", stop=trail_stop)

// Plotting Trailing Stop
plot(strategy.position_size > 0 ? trail_stop : na, color=color.green, title="Trailing Stop (Long)")
plot(strategy.position_size < 0 ? trail_stop : na, color=color.red, title="Trailing Stop (Short)")

// Plotting RSI Divergence
plot(divergence, color=divergence > 0 ? color.lime : color.red, linewidth=2, title="RSI Divergence")
hline(0)

// Plotting EMA
ema21 = ta.ema(close, 21)
plot(ema21, color=color.blue, title="21 EMA")
Detail
https://www.fmz.com/strategy/478719
Last Modified
2025-01-17 15:51:14