
16 KiB
Name
基于多空自适应动态网格策略A-Long-Short-Adaptive-Dynamic-Grid-Strategy-Based
Author
ChaoZhang
Strategy Description
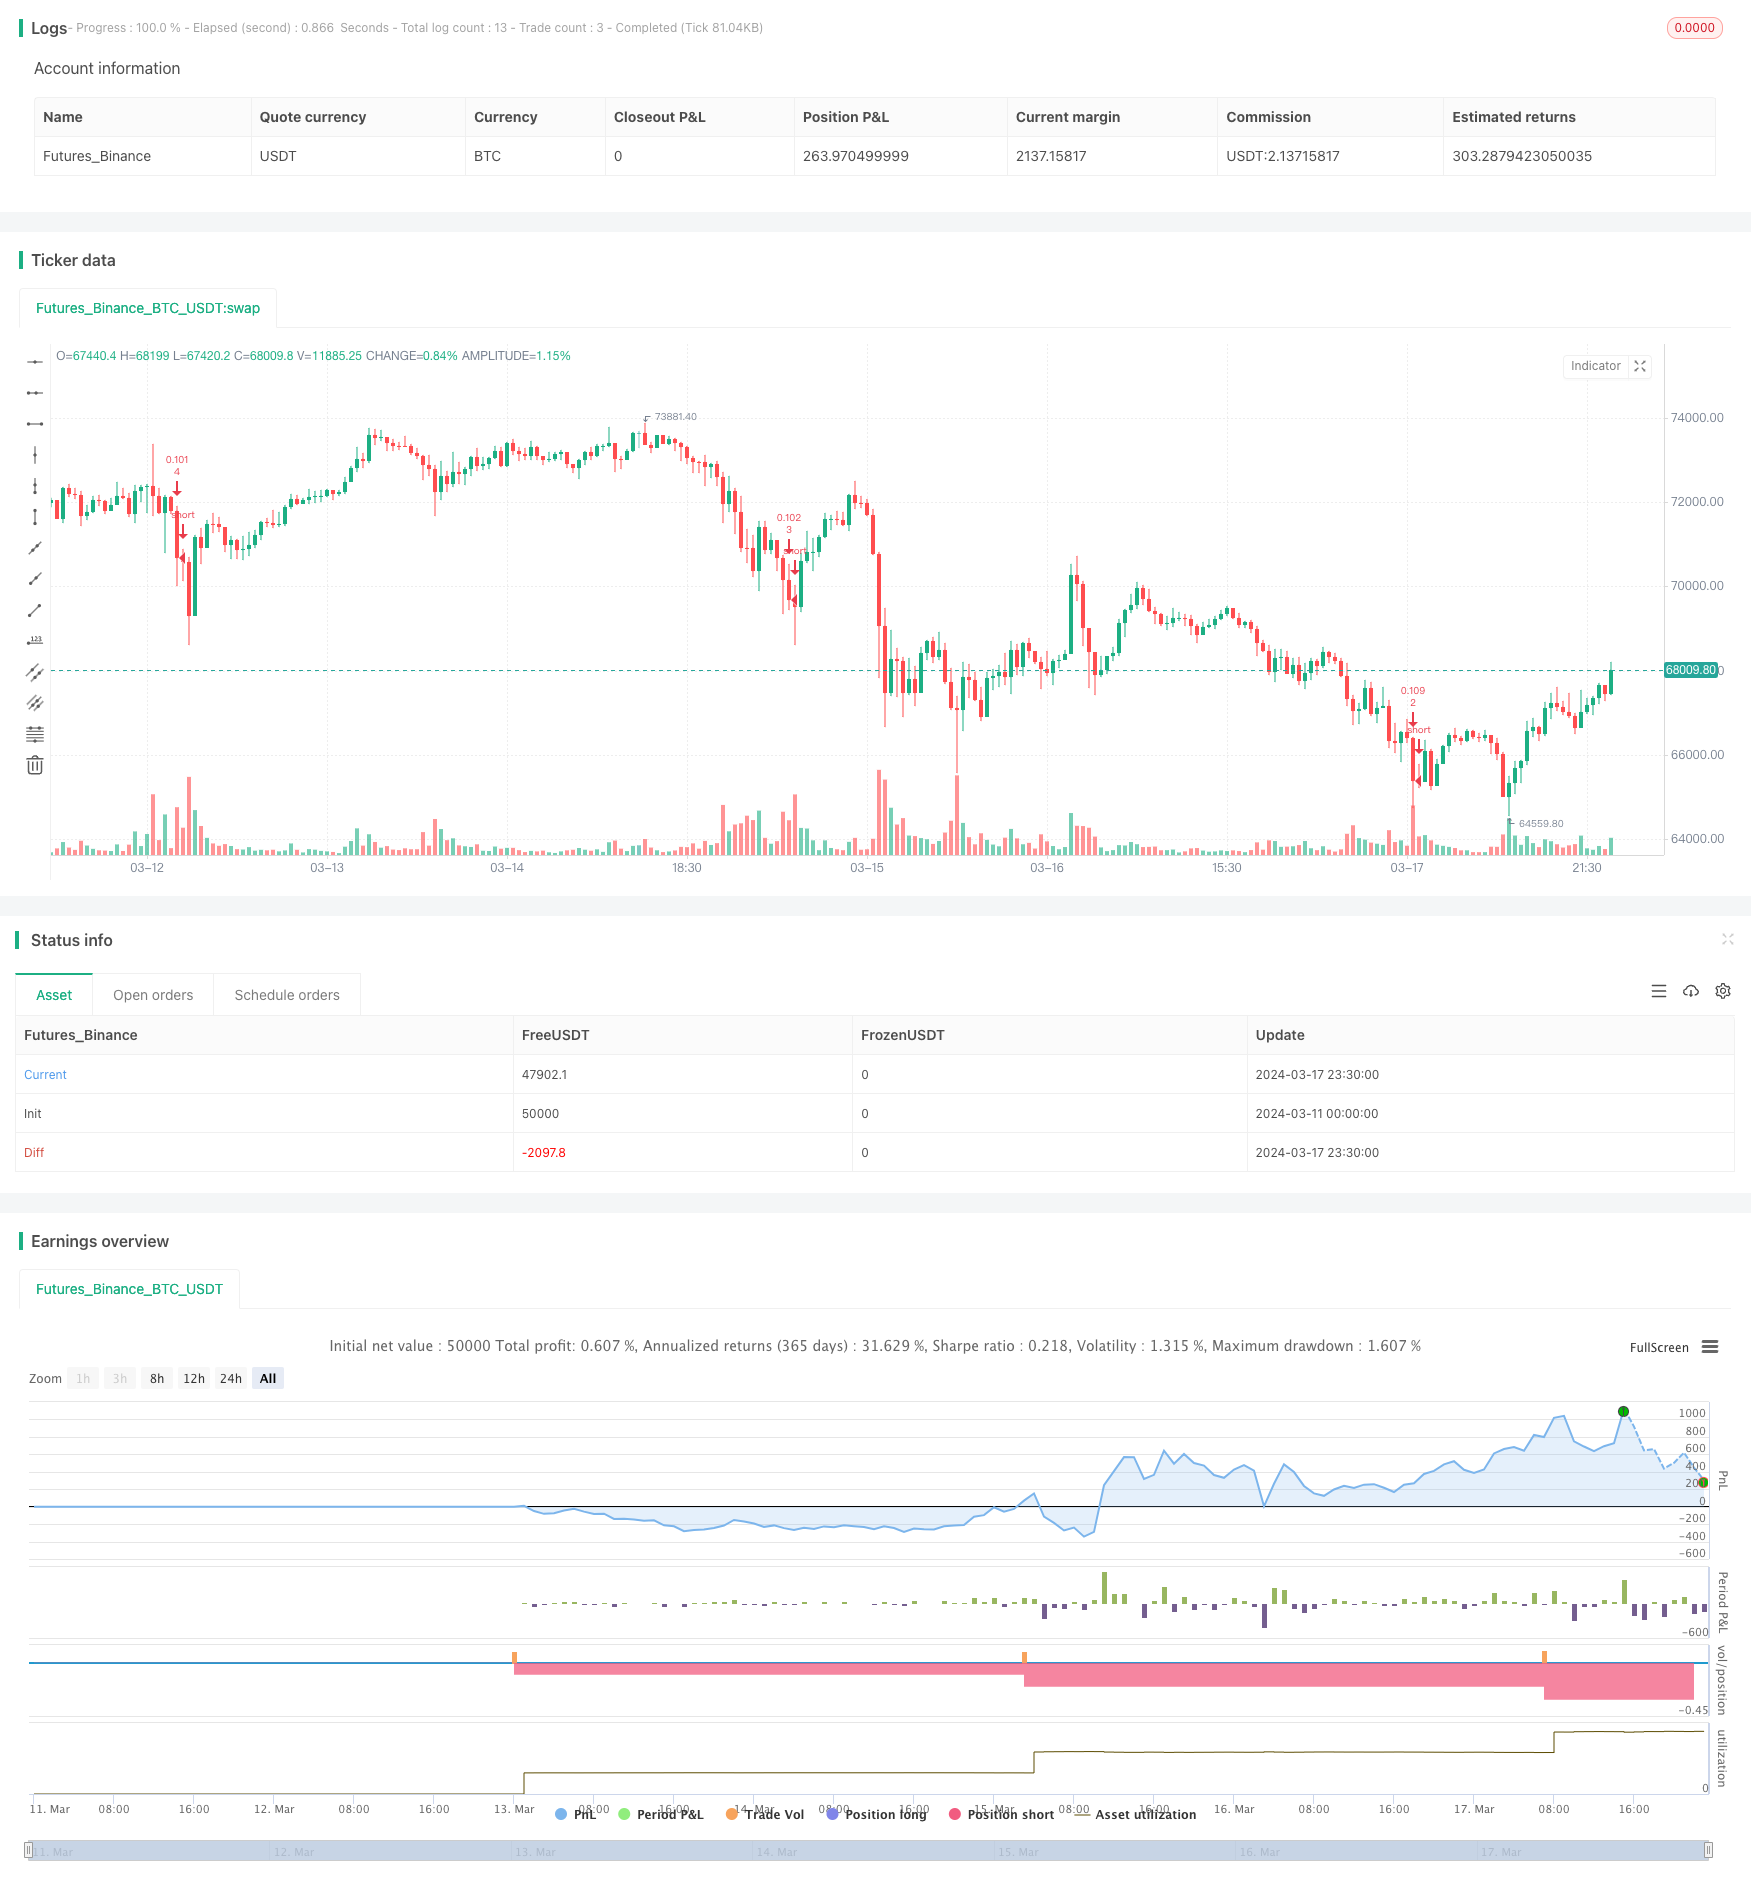 [trans]
概述
这是一个基于Pine Script编写的多空自适应动态网格交易策略。该策略的核心思想是根据最近价格的高点和低点或简单移动平均线自动计算出一个网格的上下界,然后将该范围均分为多个网格线。当价格触及某个网格线时,就会在该位置开仓做多或平仓。通过这种方式,策略能够在震荡行情中不断开仓平仓,获取价差收益。同时通过动态调整网格边界,也能适应不同的市场趋势。
策略原理
-
计算网格上下界。根据用户选择,上下界可以基于最近N根K线的最高点和最低点,并可设置扩大或缩小百分比;也可以基于最近N根K线收盘价的简单移动平均线,并设置上下偏离比例。
-
生成网格线数组。根据设置的网格线数量,将网格范围均分,生成对应价格的网格线数组。
-
入场/加仓。从下往上遍历网格线,若当前收盘价小于某网格线价格且该网格线还没有持仓,则在该位置开多单。这样当价格触及较高网格线时会持续加仓。
-
出场/减仓。从上往下遍历网格线,若当前收盘价大于某网格线价格且低一格网格线有持仓,则平掉低一格网格线的多单。这样当价格回落时会持续减仓。
-
动态调整。若选择动态网格功能,则每根K线都会重新计算网格的上下界和网格线数组,使得网格能够随行情变化而不断自适应。
优势分析
-
适应性强。网格交易策略能够适应震荡和趋势行情。在震荡行情中,网格策略能持续开仓平仓,赚取价差;在趋势行情中,由于网格跟随价格移动,也能维持一定仓位,获取趋势收益。
-
风险可控。每次开仓的仓位大小由设置的网格数量决定,单次风险敞口较小且可控。同时,由于价格触及上方网格线时会平仓获利,也一定程度对冲了潜在亏损。
-
自动化程度高。该策略基本可以全自动运行,不需要人工干预,适合需要长期稳健收益的投资者。
-
参数灵活。用户可以根据市场特征,灵活设置网格线数量,动态网格参数等,以优化策略表现。
风险分析
-
黑天鹅风险。若遇到极端行情暴跌,价格直接跳空至最低网格线以下,则该策略会满仓而面临较大回撤。为降低此风险,可以设置止损条件,一旦亏损达到阈值就全部平仓。
-
网格参数设置不当。若网格密度过大,每次开平仓的价差就会很小,手续费可能会侵蚀大部分收益。若网格宽度过大,一次性开仓比例就高,风险敞口大。需要仔细评估标的资产特性,选择合适的网格参数。
-
基差风险。该策略是基于当前价格设置开平仓条件,在期货等市场如果合约价格与标的价格差异较大,则实际开平仓价位可能与预期偏离较多。
优化方向
-
加入趋势过滤。网格策略在单边趋势行情表现不佳,可以加入趋势指标作为过滤,如只在ADX低于某阈值时启用网格,而在趋势明显时关闭网格,仅持有单边仓位。
-
信号优化。可以在网格基础上叠加其他信号,如网格+均线,即主要由网格决定开平仓,但在价格穿越某均线时再开仓,不然不开仓。这样可以降低频繁开平仓带来的成本。
-
仓位管理。目前策略的每格仓位是固定的,可以设置在价格离市场平均价格较远时,适当调低每格仓位,而在接近市场平均价时加大仓位,提高资金利用效率。
-
自适应网格密度。根据价格波动率动态调整网格密度,波动率高时可以适当增加网格数量,波动率低时减少网格数量。这样可以优化网格宽度,提高资金利用率。
总结
该策略通过自适应动态网格,能够在震荡行情中频繁开平仓赚取价差,也能在趋势行情中维持一定敞口方向获取趋势收益,是一个适应性较强的中长线量化策略。通过合理设置网格触发逻辑和仓位管理,可以取得稳健收益。但需关注极端行情和价格跳空风险,这需要设置适当止损条件来控制。此外,在参数设置和风险管理方面还有进一步优化的空间,可以通过引入趋势过滤,信号叠加,仓位管理,自适应网格密度等手段来提高策略的稳健性和收益性。综上,该策略基于网格的基本逻辑,加入了动态自适应机制,能够为中长线量化投资者提供新的思路和参考。
||
Overview
This is a long-short adaptive dynamic grid trading strategy based on Pine Script. The core idea of this strategy is to automatically calculate the upper and lower bounds of a grid based on the recent price highs and lows or a simple moving average, and then divide this range evenly into multiple grid lines. When the price reaches a certain grid line, it will open a long position or close a position at that level. In this way, the strategy can continuously open and close positions in a rangebound market to capture the price spread. At the same time, by dynamically adjusting the grid boundaries, it can also adapt to different market trends.
Strategy Principles
-
Calculate grid boundaries. Based on user choice, the boundaries can be calculated from the highest and lowest points of the recent N candles, with an option to widen or narrow the range by a percentage; or they can be based on the simple moving average of the closing prices of the recent N candles, with an option to set the upward and downward deviation ratios.
-
Generate grid line array. According to the set number of grid lines, divide the grid range evenly to generate an array of grid line prices.
-
Entry/Add position. Traverse the grid lines from bottom to top. If the current closing price is less than a grid line price and there is no position on that grid line, then open a long position at that level. In this way, when the price reaches higher grid lines, it will continue to add positions.
-
Exit/Reduce position. Traverse the grid lines from top to bottom. If the current closing price is greater than a grid line price and there is a position on the grid line below, then close the long position on the lower grid line. In this way, when the price falls back, it will continue to reduce positions.
-
Dynamic adjustment. If the dynamic grid function is selected, the upper and lower bounds of the grid and the grid line array will be recalculated on each candle, so that the grid can constantly adapt as the market changes.
Advantage Analysis
-
Strong adaptability. The grid trading strategy can adapt to both rangebound and trending markets. In a rangebound market, the grid strategy can continuously open and close positions to earn the price spread; in a trending market, because the grid follows the price movement, it can also maintain a certain position to obtain trend gains.
-
Controllable risk. The position size of each opening is determined by the set number of grids, so the single risk exposure is small and controllable. At the same time, since reaching the upper grid lines will close positions for profit, it also hedges potential losses to a certain extent.
-
High degree of automation. This strategy can basically run fully automatically without manual intervention, which is suitable for investors who need long-term steady returns.
-
Flexible parameters. Users can flexibly set the number of grid lines, dynamic grid parameters, etc. according to market characteristics to optimize strategy performance.
Risk Analysis
-
Black swan risk. In case of an extreme market crash, if the price directly gaps down below the lowest grid line, the strategy will be fully positions and face a larger drawdown. To reduce this risk, a stop-loss condition can be set to close all positions once the loss reaches a threshold.
-
Improper grid parameter setting. If the grid density is too high, the spread of each open and close will be very small, and transaction costs may erode most of the gains. If the grid width is too large, the one-time opening ratio is high and the risk exposure is large. The characteristics of the underlying asset need to be carefully evaluated to select appropriate grid parameters.
-
Basis risk. This strategy sets the opening and closing conditions based on the current price. In markets such as futures, if the contract price differs greatly from the underlying price, the actual opening and closing prices may deviate significantly from expectations.
Optimization Directions
-
Add trend filter. Grid strategies do not perform well in unilateral trending markets. Trend indicators can be added as a filter, such as only enabling the grid when ADX is below a threshold, and closing the grid when the trend is obvious, only holding unilateral positions.
-
Signal optimization. Other signals can be superimposed on the basis of the grid, such as grid + moving average, that is, the opening and closing are mainly determined by the grid, but only open positions when the price crosses a certain moving average, otherwise do not open positions. This can reduce the cost of frequent opening and closing.
-
Position management. Currently, the position of each grid in the strategy is fixed. It can be set to appropriately reduce the position of each grid when the price is far from the market average price, and increase the position when it is close to the market average price to improve the efficiency of capital utilization.
-
Adaptive grid density. Dynamically adjust the grid density according to price volatility. When volatility is high, the number of grids can be appropriately increased; when volatility is low, the number of grids can be reduced. This can optimize the grid width and improve capital utilization.
Summary
Through adaptive dynamic grids, this strategy can frequently open and close positions to earn price spreads in rangebound markets, and can also maintain a certain degree of exposure direction in trending markets to obtain trend gains. It is a mid-to-long-term quantitative strategy with strong adaptability. By reasonably setting the grid triggering logic and position management, steady returns can be achieved. However, it is necessary to pay attention to the risks of extreme market conditions and price gaps, which requires setting appropriate stop-loss conditions to control. In addition, there is further room for optimization in parameter setting and risk management. The robustness and profitability of the strategy can be improved by introducing trend filtering, signal superposition, position management, adaptive grid density and other means. In summary, based on the basic logic of grids, this strategy incorporates a dynamic adaptive mechanism, which can provide new ideas and references for mid-to-long-term quantitative investors.
[/trans]
Strategy Arguments
| Argument | Default | Description |
|---|---|---|
| v_input_1 | true | (?Grid Bounds)Use Auto Bounds? |
| v_input_2 | 0 | (Auto) Bound Source: Hi & Low |
| v_input_3 | 250 | (Auto) Bound Lookback |
| v_input_4 | 0.1 | (Auto) Bound Deviation |
| v_input_5 | 0.285 | (Manual) Upper Boundry |
| v_input_6 | 0.225 | (Manual) Lower Boundry |
| v_input_7 | 8 | (?Grid Lines)Grid Line Quantity |
Source (PineScript)
// This Pine Script™ code is subject to the terms of the Mozilla Public License 2.0 at https://mozilla.org/MPL/2.0/
// © jcloyd

//@version=4
strategy("(IK) Grid Script", overlay=true, pyramiding=14, close_entries_rule="ANY", default_qty_type=strategy.cash, initial_capital=100.0, currency="USD", commission_type=strategy.commission.percent, commission_value=0.1)
i_autoBounds    = input(group="Grid Bounds", title="Use Auto Bounds?", defval=true, type=input.bool)                             // calculate upper and lower bound of the grid automatically? This will theorhetically be less profitable, but will certainly require less attention
i_boundSrc      = input(group="Grid Bounds", title="(Auto) Bound Source", defval="Hi & Low", options=["Hi & Low", "Average"])     // should bounds of the auto grid be calculated from recent High & Low, or from a Simple Moving Average
i_boundLookback = input(group="Grid Bounds", title="(Auto) Bound Lookback", defval=250, type=input.integer, maxval=500, minval=0) // when calculating auto grid bounds, how far back should we look for a High & Low, or what should the length be of our sma
i_boundDev      = input(group="Grid Bounds", title="(Auto) Bound Deviation", defval=0.10, type=input.float, maxval=1, minval=-1)  // if sourcing auto bounds from High & Low, this percentage will (positive) widen or (negative) narrow the bound limits. If sourcing from Average, this is the deviation (up and down) from the sma, and CANNOT be negative.
i_upperBound    = input(group="Grid Bounds", title="(Manual) Upper Boundry", defval=0.285, type=input.float)                      // for manual grid bounds only. The upperbound price of your grid
i_lowerBound    = input(group="Grid Bounds", title="(Manual) Lower Boundry", defval=0.225, type=input.float)                      // for manual grid bounds only. The lowerbound price of your grid.
i_gridQty       = input(group="Grid Lines",  title="Grid Line Quantity", defval=8, maxval=15, minval=3, type=input.integer)       // how many grid lines are in your grid

f_getGridBounds(_bs, _bl, _bd, _up) =>
    if _bs == "Hi & Low"
        _up ? highest(close, _bl) * (1 + _bd) : lowest(close, _bl)  * (1 - _bd)
    else
        avg = sma(close, _bl)
        _up ? avg * (1 + _bd) : avg * (1 - _bd)

f_buildGrid(_lb, _gw, _gq) =>
    gridArr = array.new_float(0)
    for i=0 to _gq-1
        array.push(gridArr, _lb+(_gw*i))
    gridArr

f_getNearGridLines(_gridArr, _price) =>
    arr = array.new_int(3)
    for i = 0 to array.size(_gridArr)-1
        if array.get(_gridArr, i) > _price
            array.set(arr, 0, i == array.size(_gridArr)-1 ? i : i+1)
            array.set(arr, 1, i == 0 ? i : i-1)
            break
    arr

var upperBound      = i_autoBounds ? f_getGridBounds(i_boundSrc, i_boundLookback, i_boundDev, true) : i_upperBound  // upperbound of our grid
var lowerBound      = i_autoBounds ? f_getGridBounds(i_boundSrc, i_boundLookback, i_boundDev, false) : i_lowerBound // lowerbound of our grid
var gridWidth       = (upperBound - lowerBound)/(i_gridQty-1)                                                       // space between lines in our grid
var gridLineArr     = f_buildGrid(lowerBound, gridWidth, i_gridQty)                                                 // an array of prices that correspond to our grid lines
var orderArr        = array.new_bool(i_gridQty, false)                                                              // a boolean array that indicates if there is an open order corresponding to each grid line

var closeLineArr    = f_getNearGridLines(gridLineArr, close)                                                        // for plotting purposes - an array of 2 indices that correspond to grid lines near price
var nearTopGridLine = array.get(closeLineArr, 0)                                                                    // for plotting purposes - the index (in our grid line array) of the closest grid line above current price
var nearBotGridLine = array.get(closeLineArr, 1)                                                                    // for plotting purposes - the index (in our grid line array) of the closest grid line below current price
strategy.initial_capital = 50000
for i = 0 to (array.size(gridLineArr) - 1)
    if close < array.get(gridLineArr, i) and not array.get(orderArr, i) and i < (array.size(gridLineArr) - 1)
        buyId = i
        array.set(orderArr, buyId, true)
        strategy.entry(id=tostring(buyId), long=true, qty=(strategy.initial_capital/(i_gridQty-1))/close, comment="#"+tostring(buyId))
    if close > array.get(gridLineArr, i) and i != 0
        if array.get(orderArr, i-1)
            sellId = i-1
            array.set(orderArr, sellId, false)
            strategy.close(id=tostring(sellId), comment="#"+tostring(sellId))

if i_autoBounds
    upperBound  := f_getGridBounds(i_boundSrc, i_boundLookback, i_boundDev, true)
    lowerBound  := f_getGridBounds(i_boundSrc, i_boundLookback, i_boundDev, false)
    gridWidth   := (upperBound - lowerBound)/(i_gridQty-1)
    gridLineArr := f_buildGrid(lowerBound, gridWidth, i_gridQty)

closeLineArr    := f_getNearGridLines(gridLineArr, close)
nearTopGridLine := array.get(closeLineArr, 0)
nearBotGridLine := array.get(closeLineArr, 1)
Detail
https://www.fmz.com/strategy/445440
Last Modified
2024-03-19 14:19:28