
15 KiB
Name
基于多时间周期赫斯特指数与斐波那契回撤的动态趋势交易策略Multi-Timeframe-Hurst-Exponent-and-Fibonacci-Retracement-Dynamic-Trend-Trading-Strategy
Author
ianzeng123
Strategy Description
[trans]
概述
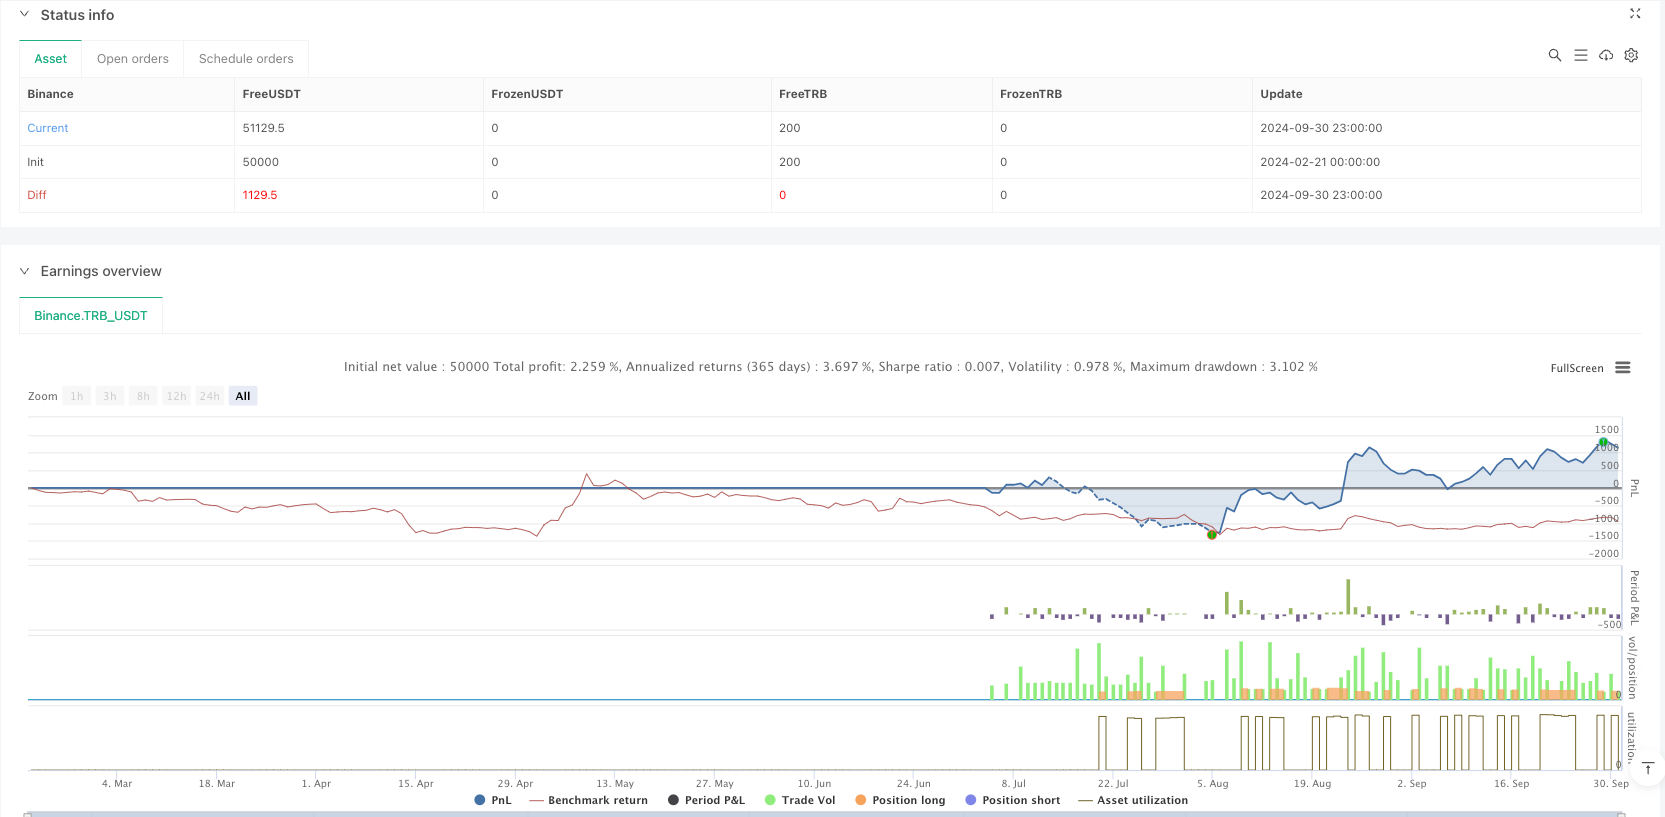
这是一个结合了赫斯特指数(Hurst Exponent)和斐波那契回撤水平的创新型多时间周期交易策略。该策略通过计算不同时间周期的赫斯特指数来评估市场趋势特性,并结合斐波那契关键价格水平来识别潜在的交易机会。策略采用了严格的风险管理框架,包括固定风险比例、目标盈亏比以及每日和总体交易频率限制。
策略原理
策略的核心逻辑基于两个主要组成部分:
- 通过计算当前和更高时间周期的赫斯特指数来评估市场趋势性质。赫斯特指数大于0.5表示市场具有趋势持续性,小于0.5则表示市场可能存在均值回归特性。
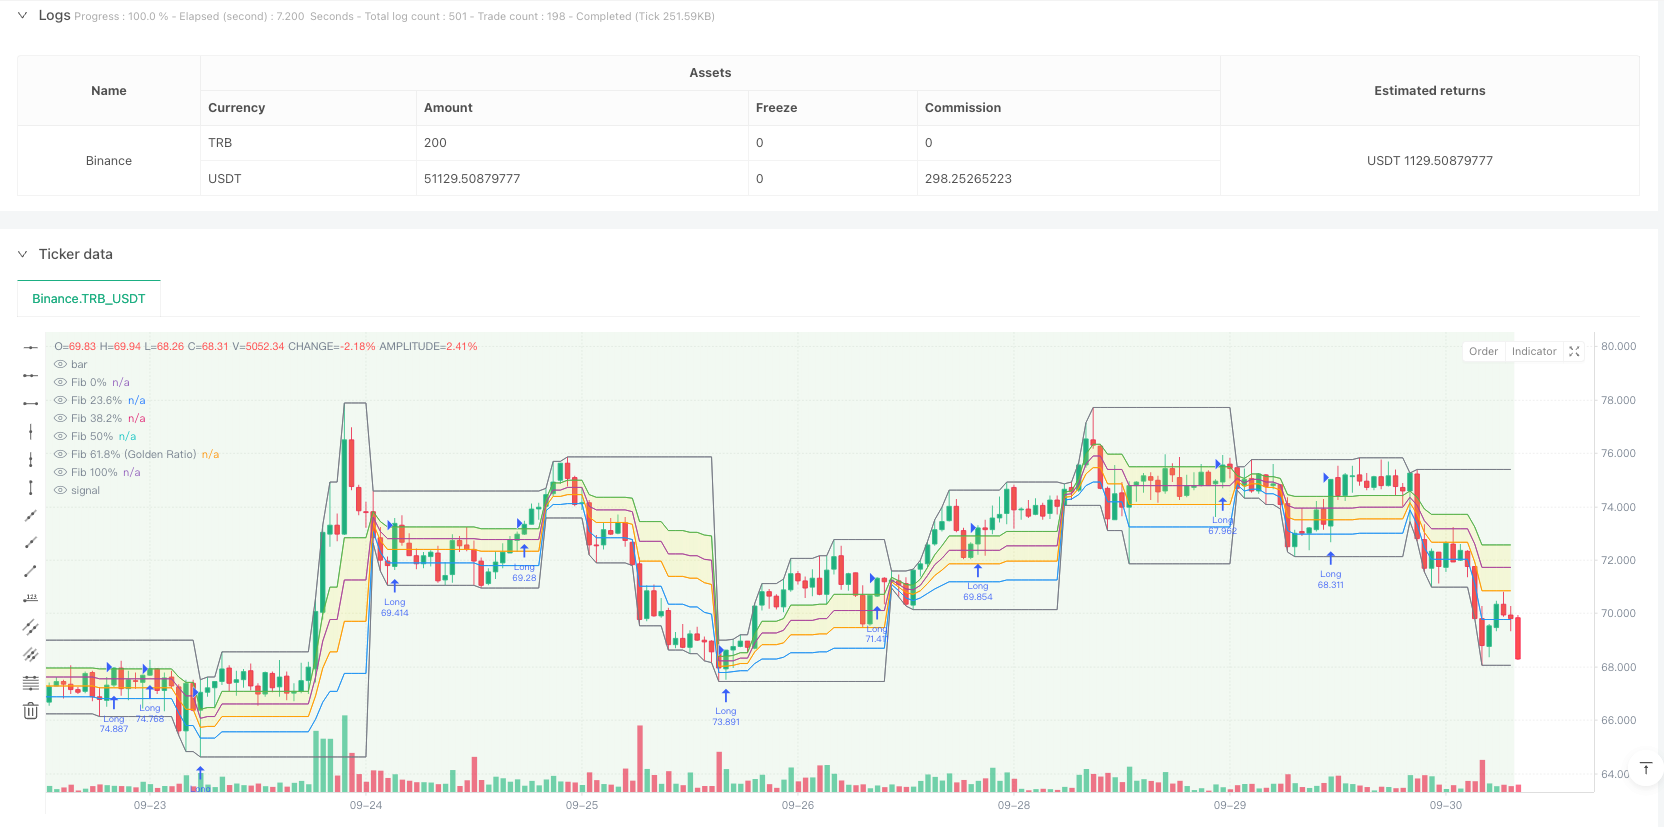
- 利用每日高低点计算关键的斐波那契回撤水平,重点关注61.8%(黄金分割)和38.2%两个水平。当日线赫斯特指数大于0.5且价格突破61.8%水平时,触发做多信号;当日线赫斯特指数小于0.5且价格跌破38.2%水平时,触发做空信号。
策略优势
- 多维度分析: 通过结合不同时间周期的趋势分析和价格水平,提供更全面的市场视角
- 风险管理完善: 采用固定风险比例(2%)和目标盈亏比(1:2)的风险管理框架
- 交易频率控制: 设置每日最大交易次数和总交易次数限制,避免过度交易
- 可视化辅助: 提供实时的市场趋势背景颜色变化和关键指标信息表格
策略风险
- 市场环境依赖: 在趋势不明显的横盘市场中可能表现欠佳
- 参数敏感性: 赫斯特指数计算周期和斐波那契时间周期的选择会影响策略表现
- 滑点影响: 在流动性较差的市场条件下,可能面临较大的滑点风险
- 系统复杂性: 多个组件的组合增加了策略失效的可能性
策略优化方向
- 动态参数调整: 可以根据市场波动率自动调整赫斯特指数计算周期
- 增加过滤器: 引入额外的市场状态过滤器,提高信号质量
- 优化持仓管理: 实现基于波动率的动态仓位管理
- 改进出场机制: 开发更灵活的盈利目标设置方式
总结
这是一个将技术分析经典工具与现代量化方法相结合的创新策略。通过多时间周期分析和严格的风险管理,策略在保持理论基础的同时也注重实战可行性。虽然存在一定的优化空间,但总体框架具有良好的延展性和实用价值。 ||
Overview
This is an innovative multi-timeframe trading strategy that combines the Hurst Exponent and Fibonacci retracement levels. The strategy evaluates market trend characteristics by calculating the Hurst exponent across different timeframes and identifies potential trading opportunities using key Fibonacci price levels. It incorporates a strict risk management framework, including fixed risk ratios, target risk-reward ratios, and daily and overall trading frequency limits.
Strategy Principles
The core logic is based on two main components:
- Market trend assessment through Hurst exponent calculations on current and higher timeframes. A Hurst exponent above 0.5 indicates trend persistence, while below 0.5 suggests mean-reversion tendencies.
- Calculation of key Fibonacci retracement levels using daily highs and lows, focusing on the 61.8% (Golden Ratio) and 38.2% levels. Long signals are triggered when the daily Hurst exponent is above 0.5 and price breaks above the 61.8% level; short signals when the daily Hurst is below 0.5 and price breaks below the 38.2% level.
Strategy Advantages
- Multi-dimensional Analysis: Provides a comprehensive market perspective by combining trend analysis across timeframes with price levels
- Robust Risk Management: Implements a fixed risk percentage (2%) and target risk-reward ratio (1:2) framework
- Trading Frequency Control: Sets maximum daily and total trade limits to prevent overtrading
- Visual Aids: Offers real-time market trend background color changes and key indicator information table
Strategy Risks
- Market Environment Dependency: May underperform in ranging markets with unclear trends
- Parameter Sensitivity: Strategy performance depends on chosen Hurst calculation period and Fibonacci timeframe
- Slippage Impact: May face significant slippage risks in less liquid market conditions
- System Complexity: Multiple components increase the possibility of strategy failure
Optimization Directions
- Dynamic Parameter Adjustment: Implement automatic adjustment of Hurst calculation period based on market volatility
- Additional Filters: Introduce extra market state filters to improve signal quality
- Position Management Enhancement: Develop volatility-based dynamic position sizing
- Exit Mechanism Improvement: Design more flexible profit target setting methods
Summary
This strategy innovatively combines classical technical analysis tools with modern quantitative methods. Through multi-timeframe analysis and strict risk management, it maintains theoretical foundations while focusing on practical applicability. While there is room for optimization, the overall framework offers good extensibility and practical value.[/trans]
Source (PineScript)
/*backtest
start: 2024-02-21 00:00:00
end: 2024-10-01 00:00:00
period: 1h
basePeriod: 1h
exchanges: [{"eid":"Binance","currency":"TRB_USDT"}]
*/

//@version=5
// Advanced Multi-Timeframe Trading System (Risk Managed)
//
// Description:
// This strategy combines an approximate measure of market trending via a Hurst exponent
// calculation with Fibonacci retracement levels derived from a higher timeframe (default: Daily)
// to identify potential reversal zones and trade opportunities. The Hurst exponent is calculated
// as a rough indicator of market persistence, while the Fibonacci retracement levels provide potential
// support and resistance areas.
//
// Signal Logic:
// - A long entry is signaled when the price crosses above the 61.8% Fibonacci level (Golden Ratio)
//   and the daily Hurst exponent is above 0.5 (suggesting a trending market).
// - A short entry is signaled when the price crosses below the 38.2% Fibonacci level and the daily Hurst
//   exponent is below 0.5.
//
// Risk Management:
// Each trade is risk-managed with a stop-loss set at 2% below (or above for shorts) the entry price,
// and a take profit order is set to achieve a 1:2 risk-reward ratio. Position sizing is fixed at 10% of
// equity per trade. Additionally, the strategy limits trading to a maximum of 5 trades per day and 510 trades
// overall (for backtesting since 2019) to ensure a realistic number of orders.
//
// Backtesting Parameters:
// - Initial Capital: $10,000
// - Commission: 0.1% per trade
// - Slippage: 1 tick per bar
// - Position Sizing: 10% of equity per trade
//
// Disclaimer:
// Past performance is not indicative of future results. This strategy is experimental and is provided solely
// for educational purposes. Use caution and perform your own testing before any live deployment.
//
// Author: [Your Name]
// Date: [Date]

strategy("Advanced Multi-Timeframe Trading System (Risk Managed)",
     overlay=true,
     max_bars_back=500,
     initial_capital=10000,
     default_qty_type=strategy.percent_of_equity,
     default_qty_value=10,          // 10% of equity per trade
     commission_type=strategy.commission.percent,
     commission_value=0.1,          // 0.1% commission per trade
     slippage=1,                    // 1 tick per bar
     calc_on_order_fills=true,
     calc_on_every_tick=true)

// ─── INPUTS ─────────────────────────────────────────────────────────────
hurstLen        = input.int(50, title="Hurst Lookback Period", minval=10)
fibTF           = input.timeframe("D", title="Fibonacci Retracement Timeframe")
maxTradesPerDay = input.int(5, title="Max Trades Per Day", minval=1)
maxTotalTrades  = input.int(510, title="Max Total Trades since 2019", minval=1)
riskPerc        = input.float(2.0, title="Risk Percent per Trade (%)", step=0.1) * 0.01  // 2% risk per trade
rrRatio         = input.float(2.0, title="Risk-Reward Ratio", step=0.1)                 // Target profit = 2x risk

// ─── FUNCTION: Approximate Hurst Exponent Calculation ──────────────────────
// This function uses a simple rescaled range method to approximate the Hurst exponent.
// Note: This is an experimental calculation and should be interpreted as a rough gauge of market trending.
calcHurst(src, len) =>
    mean   = ta.sma(src, len)
    dev    = src - mean
    cumDev = 0.0
    for i = 0 to len - 1
        cumDev := cumDev + dev[i]
    R     = ta.highest(cumDev, len) - ta.lowest(cumDev, len)
    S     = ta.stdev(src, len)
    hurst = na(S) or S == 0 ? na : math.log(R / S) / math.log(len)
    hurst

// Calculate the Hurst exponent on the current timeframe and from a higher timeframe (daily)
currHurst  = calcHurst(close, hurstLen)
dailyHurst = request.security(syminfo.tickerid, "D", calcHurst(close, hurstLen))

// ─── FIBONACCI RETRACEMENT LEVELS (WITH GOLDEN RATIO) ──────────────────────────
// Retrieve the daily high/low from the selected timeframe (default: Daily)
dHigh   = request.security(syminfo.tickerid, fibTF, high)
dLow    = request.security(syminfo.tickerid, fibTF, low)

// Define Fibonacci levels between the daily low and high.
fib_0   = dLow
fib_100 = dHigh
fib_236 = dLow + 0.236 * (dHigh - dLow)
fib_382 = dLow + 0.382 * (dHigh - dLow)
fib_500 = dLow + 0.5   * (dHigh - dLow)
fib_618 = dLow + 0.618 * (dHigh - dLow)  // Golden ratio level

// Plot the Fibonacci levels for reference.
pFib0   = plot(fib_0,   color=color.gray,   title="Fib 0%")
pFib236 = plot(fib_236, color=color.blue,   title="Fib 23.6%")
pFib382 = plot(fib_382, color=color.orange, title="Fib 38.2%")
pFib500 = plot(fib_500, color=color.purple, title="Fib 50%")
pFib618 = plot(fib_618, color=color.green,  title="Fib 61.8% (Golden Ratio)")
pFib100 = plot(fib_100, color=color.gray,   title="Fib 100%")
// Fill the area between the 61.8% and 38.2% levels to highlight the key retracement zone.
fill(pFib618, pFib382, color=color.new(color.yellow, 80), title="Fibonacci Retracement Zone")

// ─── TRADE COUNT MANAGEMENT ─────────────────────────────────────────────────
// To simulate realistic trading frequency, the strategy limits trades to a maximum of 5 per day and 510 overall.
var int tradesToday     = 0
var int globalTradeCount = 0

// Reset the daily trade counter at the start of a new day.
newDay = ta.change(time("D"))
if newDay
    tradesToday := 0

// Allow new trades only if within the daily and overall trade limits.
canTrade = (tradesToday < maxTradesPerDay) and (globalTradeCount < maxTotalTrades)

// ─── TRADING SIGNALS ─────────────────────────────────────────────────────────
// Entry conditions based on Fibonacci levels and daily Hurst conditions:
// • Long: Price crosses above the 61.8% (Golden Ratio) level and daily Hurst > 0.5.
// • Short: Price crosses below the 38.2% level and daily Hurst < 0.5.
longCond  = ta.crossover(close, fib_618) and (dailyHurst > 0.5)
shortCond = ta.crossunder(close, fib_382) and (dailyHurst < 0.5)

if longCond and canTrade
    strategy.entry("Long", strategy.long)
    tradesToday      := tradesToday + 1
    globalTradeCount := globalTradeCount + 1

if shortCond and canTrade
    strategy.entry("Short", strategy.short)
    tradesToday      := tradesToday + 1
    globalTradeCount := globalTradeCount + 1

// ─── RISK MANAGEMENT: STOP-LOSS & TAKE-PROFIT ──────────────────────────────
// For active positions, define stop-loss and take profit levels based on the entry price.
// This ensures that each trade risks approximately 2% of the entry price with a target
// of 2x the risk (1:2 risk-reward ratio).
if strategy.position_size > 0
    longStop   = strategy.position_avg_price * (1 - riskPerc)
    longTarget = strategy.position_avg_price * (1 + rrRatio * riskPerc)
    strategy.exit("Long Exit", from_entry="Long", stop=longStop, limit=longTarget)
if strategy.position_size < 0
    shortStop   = strategy.position_avg_price * (1 + riskPerc)
    shortTarget = strategy.position_avg_price * (1 - rrRatio * riskPerc)
    strategy.exit("Short Exit", from_entry="Short", stop=shortStop, limit=shortTarget)

// ─── CHART OVERLAYS & VISUAL AIDS ────────────────────────────────────────────
// Background color indicates the daily market trend:
// Green for trending conditions (dailyHurst > 0.5) and red for less trending conditions.
bgcolor(dailyHurst > 0.5 ? color.new(color.green, 90) : color.new(color.red, 90), title="Daily Trend Background")

// Display an information table in the top-right corner to help interpret key values.
var table infoTable = table.new(position.top_right, 2, 4, border_width=1, frame_color=color.gray)
if barstate.islast
    table.cell(infoTable, 0, 0, "Current Hurst", text_color=color.white, bgcolor=color.black)
    table.cell(infoTable, 1, 0, str.tostring(currHurst, "#.###"), text_color=color.white, bgcolor=color.black)
    table.cell(infoTable, 0, 1, "Daily Hurst", text_color=color.white, bgcolor=color.black)
    table.cell(infoTable, 1, 1, str.tostring(dailyHurst, "#.###"), text_color=color.white, bgcolor=color.black)
    table.cell(infoTable, 0, 2, "Trades Today", text_color=color.white, bgcolor=color.black)
    table.cell(infoTable, 1, 2, str.tostring(tradesToday), text_color=color.white, bgcolor=color.black)
    table.cell(infoTable, 0, 3, "Global Trades", text_color=color.white, bgcolor=color.black)
    table.cell(infoTable, 1, 3, str.tostring(globalTradeCount), text_color=color.white, bgcolor=color.black)

// Optional: Add labels on the final bar to mark the key Fibonacci levels.
if barstate.islast
    label.new(bar_index, fib_618, "61.8% (Golden Ratio)", style=label.style_label_left, color=color.green, textcolor=color.white, size=size.tiny)
    label.new(bar_index, fib_382, "38.2%", style=label.style_label_left, color=color.orange, textcolor=color.white, size=size.tiny)
Detail
https://www.fmz.com/strategy/482898
Last Modified
2025-02-20 16:59:37