
9.1 KiB
Name
基于多区域SMC理论的智能趋势跟踪策略Multi-Zone-SMC-Theory-Based-Intelligent-Trend-Following-Strategy
Author
ChaoZhang
Strategy Description
[trans]
概述
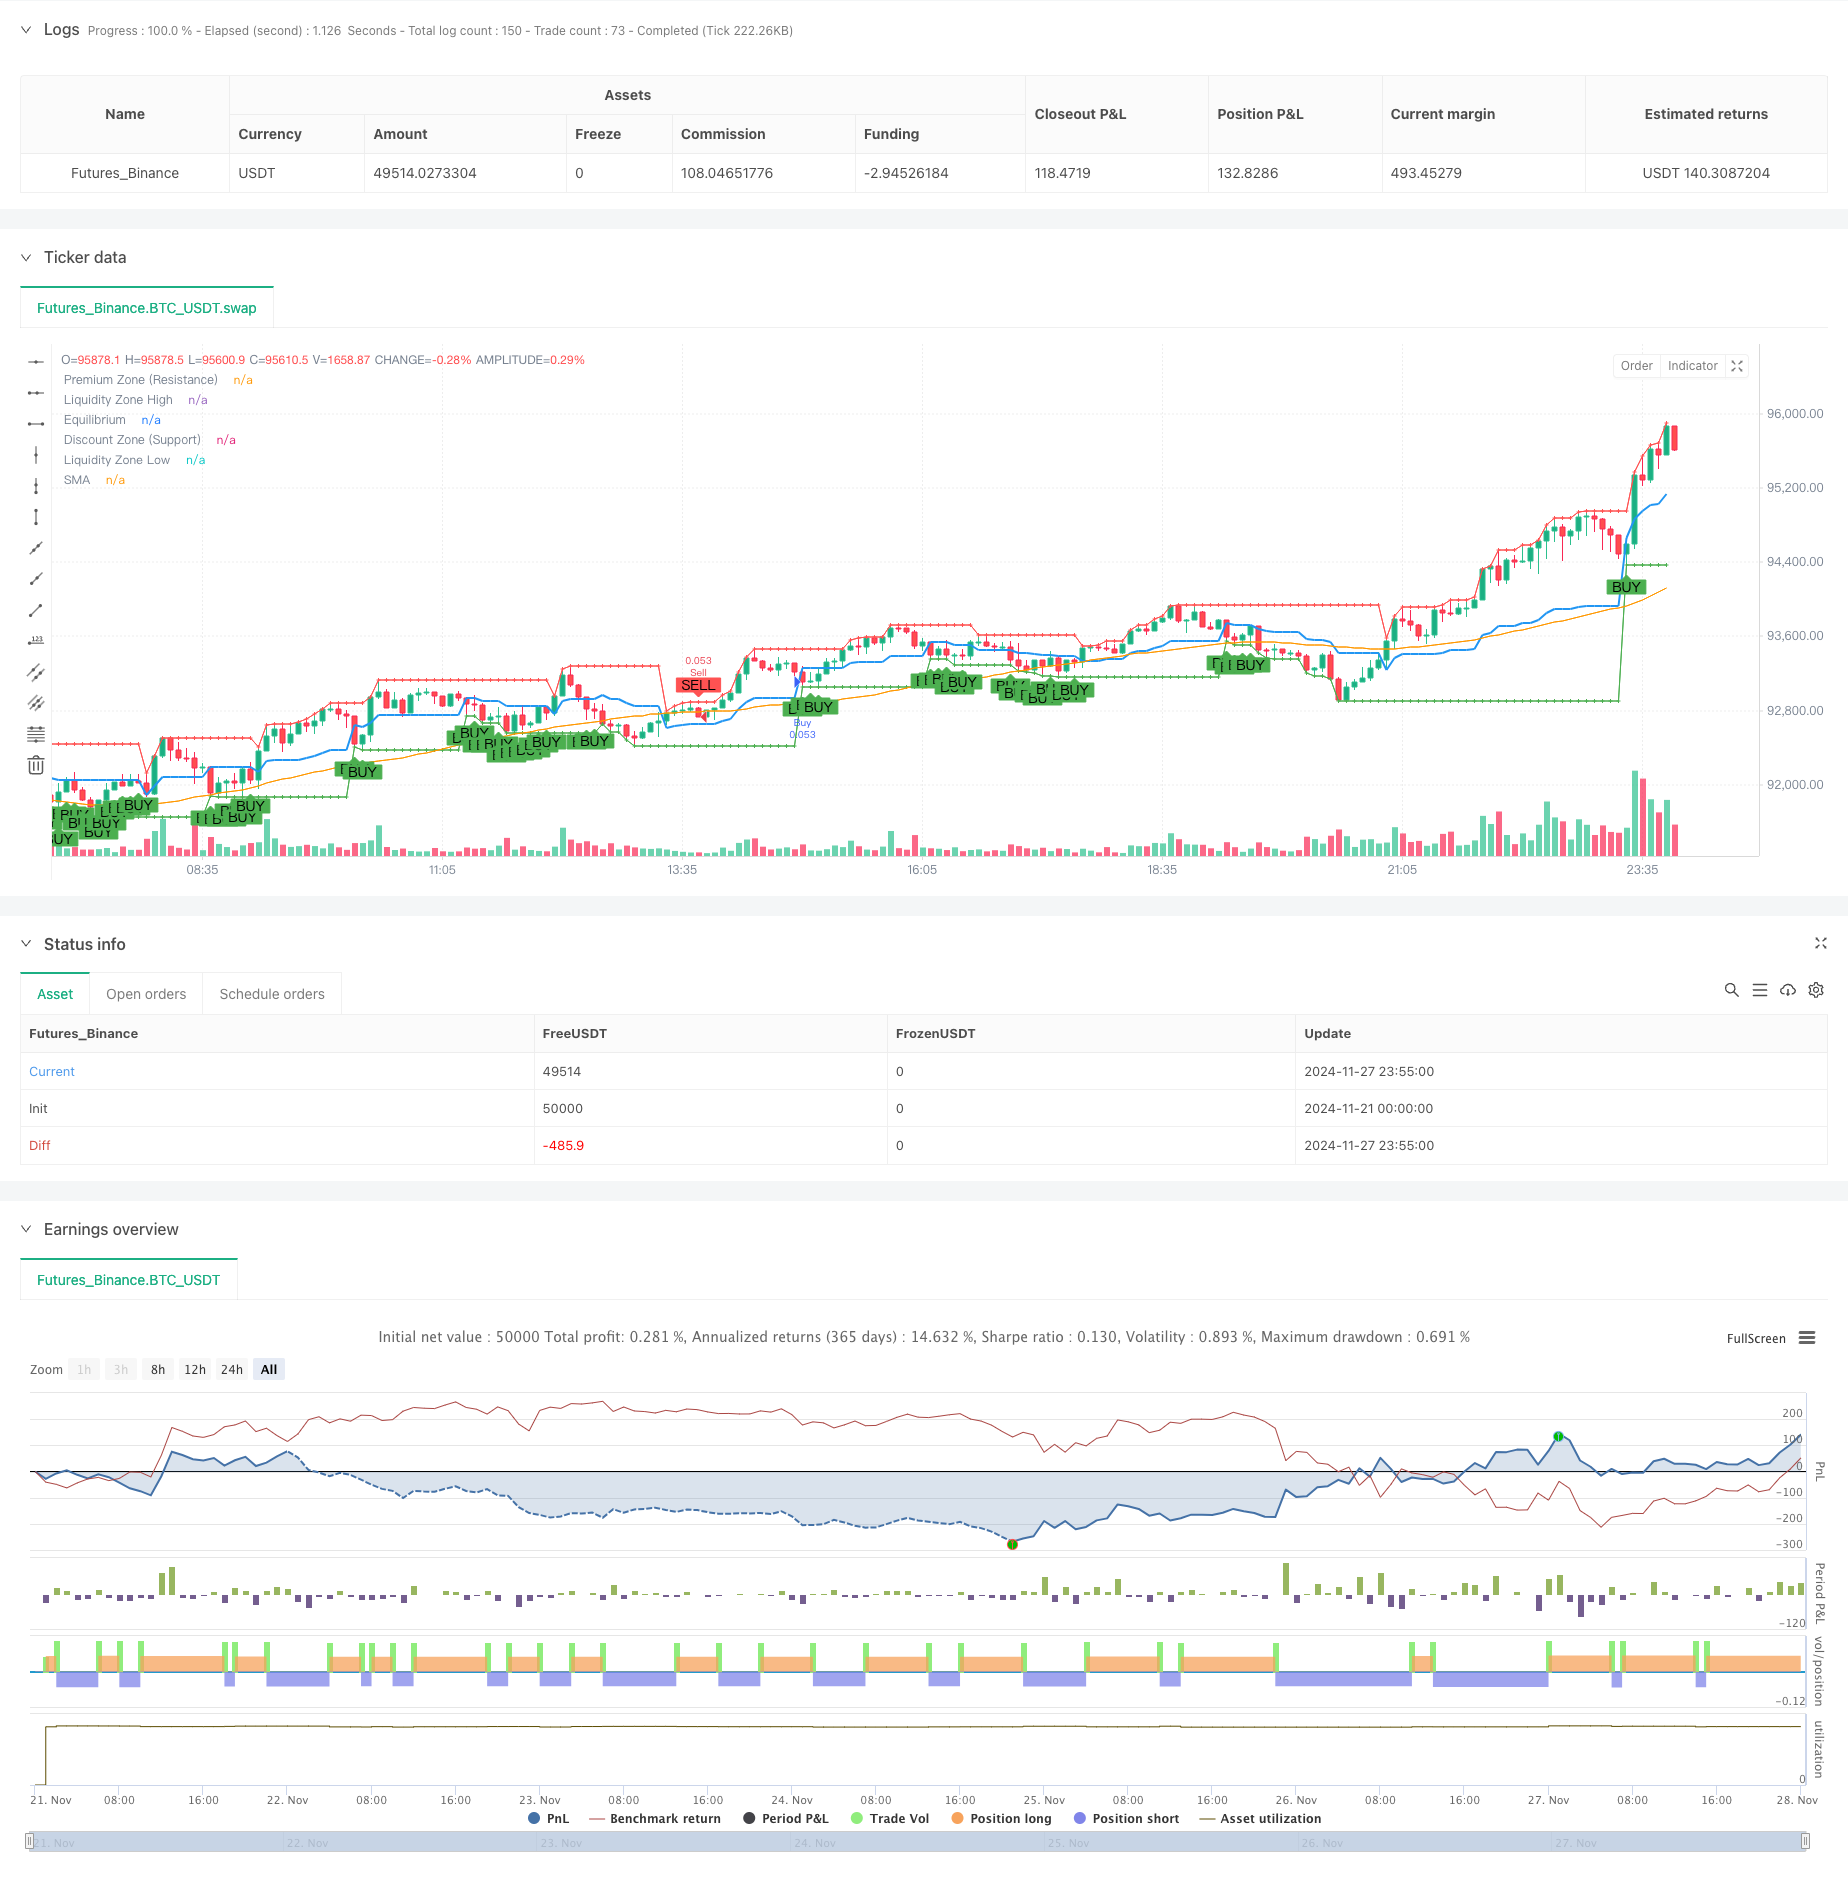
本策略基于智能资金概念(SMC)理论,通过划分均衡区(Equilibrium)、溢价区(Premium)和折价区(Discount)三个关键价格区域,结合50周期简单移动平均线(SMA)和订单块(Order Blocks)分析,构建了一个完整的趋势跟踪交易系统。策略通过识别市场结构中的关键支撑位和阻力位,在不同区域之间的价格波动中捕捉交易机会。
策略原理
策略的核心逻辑包含以下几个关键要素:
- 通过计算最近8根K线的波动高点和低点,确定市场的波动范围。
- 以波动高低点的中间值作为均衡区,高于均衡区定义为溢价区,低于均衡区定义为折价区。
- 使用50周期SMA判断整体趋势方向,价格在SMA之上视为多头趋势,反之为空头趋势。
- 在折价区且价格站上SMA时产生买入信号,在溢价区且价格跌破SMA时产生卖出信号。
- 通过分析20根K线内的最高价和最低价来识别订单块,用于确认交易信号。
- 标记波动高低点作为流动性区域,预测可能的价格反转点。
策略优势
- 结构化的区域划分方法,能够清晰定位市场所处阶段。
- 多重信号确认机制,通过区域、趋势和订单块三重验证提高交易准确性。
- 动态适应市场变化,实时更新关键价格水平。
- 完整的风险管理体系,包含止损和仓位管理。
- 代码实现简洁高效,易于维护和优化。
策略风险
- 在剧烈波动市场中可能出现假突破信号。
- 依赖历史数据计算的指标可能在快速转向市场中滞后。
- 固定周期的移动平均线可能不适用于所有市场环境。
- 需要合理设置止损以控制风险。 建议采取以下措施管理风险:
- 动态调整参数以适应不同市场环境
- 增加波动率过滤器
- 实施严格的资金管理规则
- 定期回测和优化策略参数
策略优化方向
- 引入自适应参数:
- 根据市场波动率动态调整区域范围
- 使用自适应周期的移动平均线
- 增强信号过滤:
- 添加成交量确认机制
- 引入动量指标辅助判断
- 完善风险管理:
- 实现动态止损机制
- 优化仓位管理算法
- 提高执行效率:
- 优化计算逻辑减少资源消耗
- 改进信号生成机制提高响应速度
总结
该策略通过智能化的区域划分和多重信号确认机制,构建了一个稳健的趋势跟踪系统。策略的核心优势在于其清晰的市场结构分析方法和完善的风险管理体系。通过持续优化和改进,策略有望在不同市场环境下保持稳定的表现。建议交易者在实盘应用时,需要根据具体市场特征调整参数,并始终保持严格的风险控制。
||
Overview
This strategy, based on Smart Money Concepts (SMC) theory, constructs a comprehensive trend following trading system by dividing the market into three key price zones: Equilibrium, Premium, and Discount. It combines a 50-period Simple Moving Average (SMA) with Order Block analysis to identify trading opportunities through price movements between different zones.
Strategy Principles
The core logic includes several key elements:
- Calculates swing highs and lows from the last 8 candles to determine market range.
- Defines the equilibrium zone as the midpoint between swing high and low, with premium zone above and discount zone below.
- Uses 50-period SMA to determine overall trend direction - bullish above SMA, bearish below.
- Generates buy signals in discount zone when price is above SMA, and sell signals in premium zone when price is below SMA.
- Identifies order blocks by analyzing highest and lowest prices within 20 candles to confirm trading signals.
- Marks swing highs and lows as liquidity zones to predict potential price reversal points.
Strategy Advantages
- Structured zone division method providing clear market phase identification.
- Multiple signal confirmation mechanism through triple verification of zones, trends, and order blocks.
- Dynamic adaptation to market changes with real-time key price level updates.
- Comprehensive risk management system including stop-loss and position management.
- Clean and efficient code implementation, easy to maintain and optimize.
Strategy Risks
- Potential false breakout signals in volatile markets.
- Indicator lag in rapid market reversals due to historical data dependence.
- Fixed-period moving average may not suit all market environments.
- Requires proper stop-loss settings for risk control. Recommended risk management measures:
- Dynamic parameter adjustment for different market conditions
- Addition of volatility filters
- Implementation of strict money management rules
- Regular backtesting and parameter optimization
Optimization Directions
- Introduce adaptive parameters:
- Dynamically adjust zone ranges based on market volatility
- Implement adaptive-period moving averages
- Enhanced signal filtering:
- Add volume confirmation mechanism
- Incorporate momentum indicators
- Improve risk management:
- Implement dynamic stop-loss mechanism
- Optimize position sizing algorithm
- Increase execution efficiency:
- Optimize calculation logic to reduce resource consumption
- Improve signal generation mechanism for faster response
Summary
This strategy builds a robust trend following system through intelligent zone division and multiple signal confirmation mechanisms. Its core strengths lie in clear market structure analysis and comprehensive risk management. Through continuous optimization and improvement, the strategy shows promise for stable performance across different market conditions. Traders are advised to adjust parameters based on specific market characteristics and maintain strict risk control when implementing the strategy in live trading. [/trans]
Source (PineScript)
/*backtest
start: 2024-11-21 00:00:00
end: 2024-11-28 00:00:00
period: 5m
basePeriod: 5m
exchanges: [{"eid":"Futures_Binance","currency":"BTC_USDT"}]
*/

//@version=5
//@version=5
strategy("SMC Strategy with Premium, Equilibrium, and Discount Zones", overlay=true, default_qty_type=strategy.percent_of_equity, default_qty_value=10)

// === Instellingen voor Swing High en Swing Low ===
swingHighLength = input.int(8, title="Swing High Length")
swingLowLength = input.int(8, title="Swing Low Length")

// Vind de recente swing highs en lows
var float swingHigh = na
var float swingLow = na

if (ta.highestbars(high, swingHighLength) == 0)
    swingHigh := high

if (ta.lowestbars(low, swingLowLength) == 0)
    swingLow := low

// Bereken Equilibrium, Premium en Discount Zones
equilibrium = (swingHigh + swingLow) / 2
premiumZone = swingHigh
discountZone = swingLow

// Plot de zones op de grafiek
plot(equilibrium, title="Equilibrium", color=color.blue, linewidth=2)
plot(premiumZone, title="Premium Zone (Resistance)", color=color.red, linewidth=1)
plot(discountZone, title="Discount Zone (Support)", color=color.green, linewidth=1)

// === Simple Moving Average om trendrichting te bepalen ===
smaLength = input.int(50, title="SMA Length")
sma = ta.sma(close, smaLength)
plot(sma, title="SMA", color=color.orange)

// === Entry- en Exitregels op basis van zones en trendrichting ===

// Koop- en verkoopsignalen
buySignal = close < equilibrium and close > discountZone and close > sma // Prijs in discount zone en boven SMA
sellSignal = close > equilibrium and close < premiumZone and close < sma // Prijs in premium zone en onder SMA

// Order Blocks (Eenvoudig: hoogste en laagste kaars binnen de laatste 20 kaarsen)
orderBlockLength = input.int(20, title="Order Block Length")
orderBlockHigh = ta.highest(high, orderBlockLength)
orderBlockLow = ta.lowest(low, orderBlockLength)

// Koop- en verkoopsignalen met order block bevestiging
buySignalOB = buySignal and close >= orderBlockLow // Koop in discount zone met ondersteuning van order block
sellSignalOB = sellSignal and close <= orderBlockHigh // Verkoop in premium zone met weerstand van order block

// === Uitvoeren van Trades ===
if (buySignalOB)
    strategy.entry("Buy", strategy.long)

if (sellSignalOB)
    strategy.entry("Sell", strategy.short)

// === Plots voor visuele feedback ===
plotshape(buySignalOB, title="Buy Signal", location=location.belowbar, color=color.green, style=shape.labelup, text="BUY")
plotshape(sellSignalOB, title="Sell Signal", location=location.abovebar, color=color.red, style=shape.labeldown, text="SELL")

// === Liquiditeitsjachten aangeven ===
// Simpel: markeer recente swing highs en lows als liquiditeitszones
liquidityZoneHigh = ta.valuewhen(high == swingHigh, high, 0)
liquidityZoneLow = ta.valuewhen(low == swingLow, low, 0)

// Markeer liquiditeitszones
plot(liquidityZoneHigh, title="Liquidity Zone High", color=color.red, linewidth=1, style=plot.style_cross)
plot(liquidityZoneLow, title="Liquidity Zone Low", color=color.green, linewidth=1, style=plot.style_cross)
Detail
https://www.fmz.com/strategy/473371
Last Modified
2024-11-29 15:38:01