
8.6 KiB
Name
基于均线的趋势追踪型策略Trend-Following-Strategy-Based-on-Moving-Averages
Author
ChaoZhang
Strategy Description
 [trans]
概述
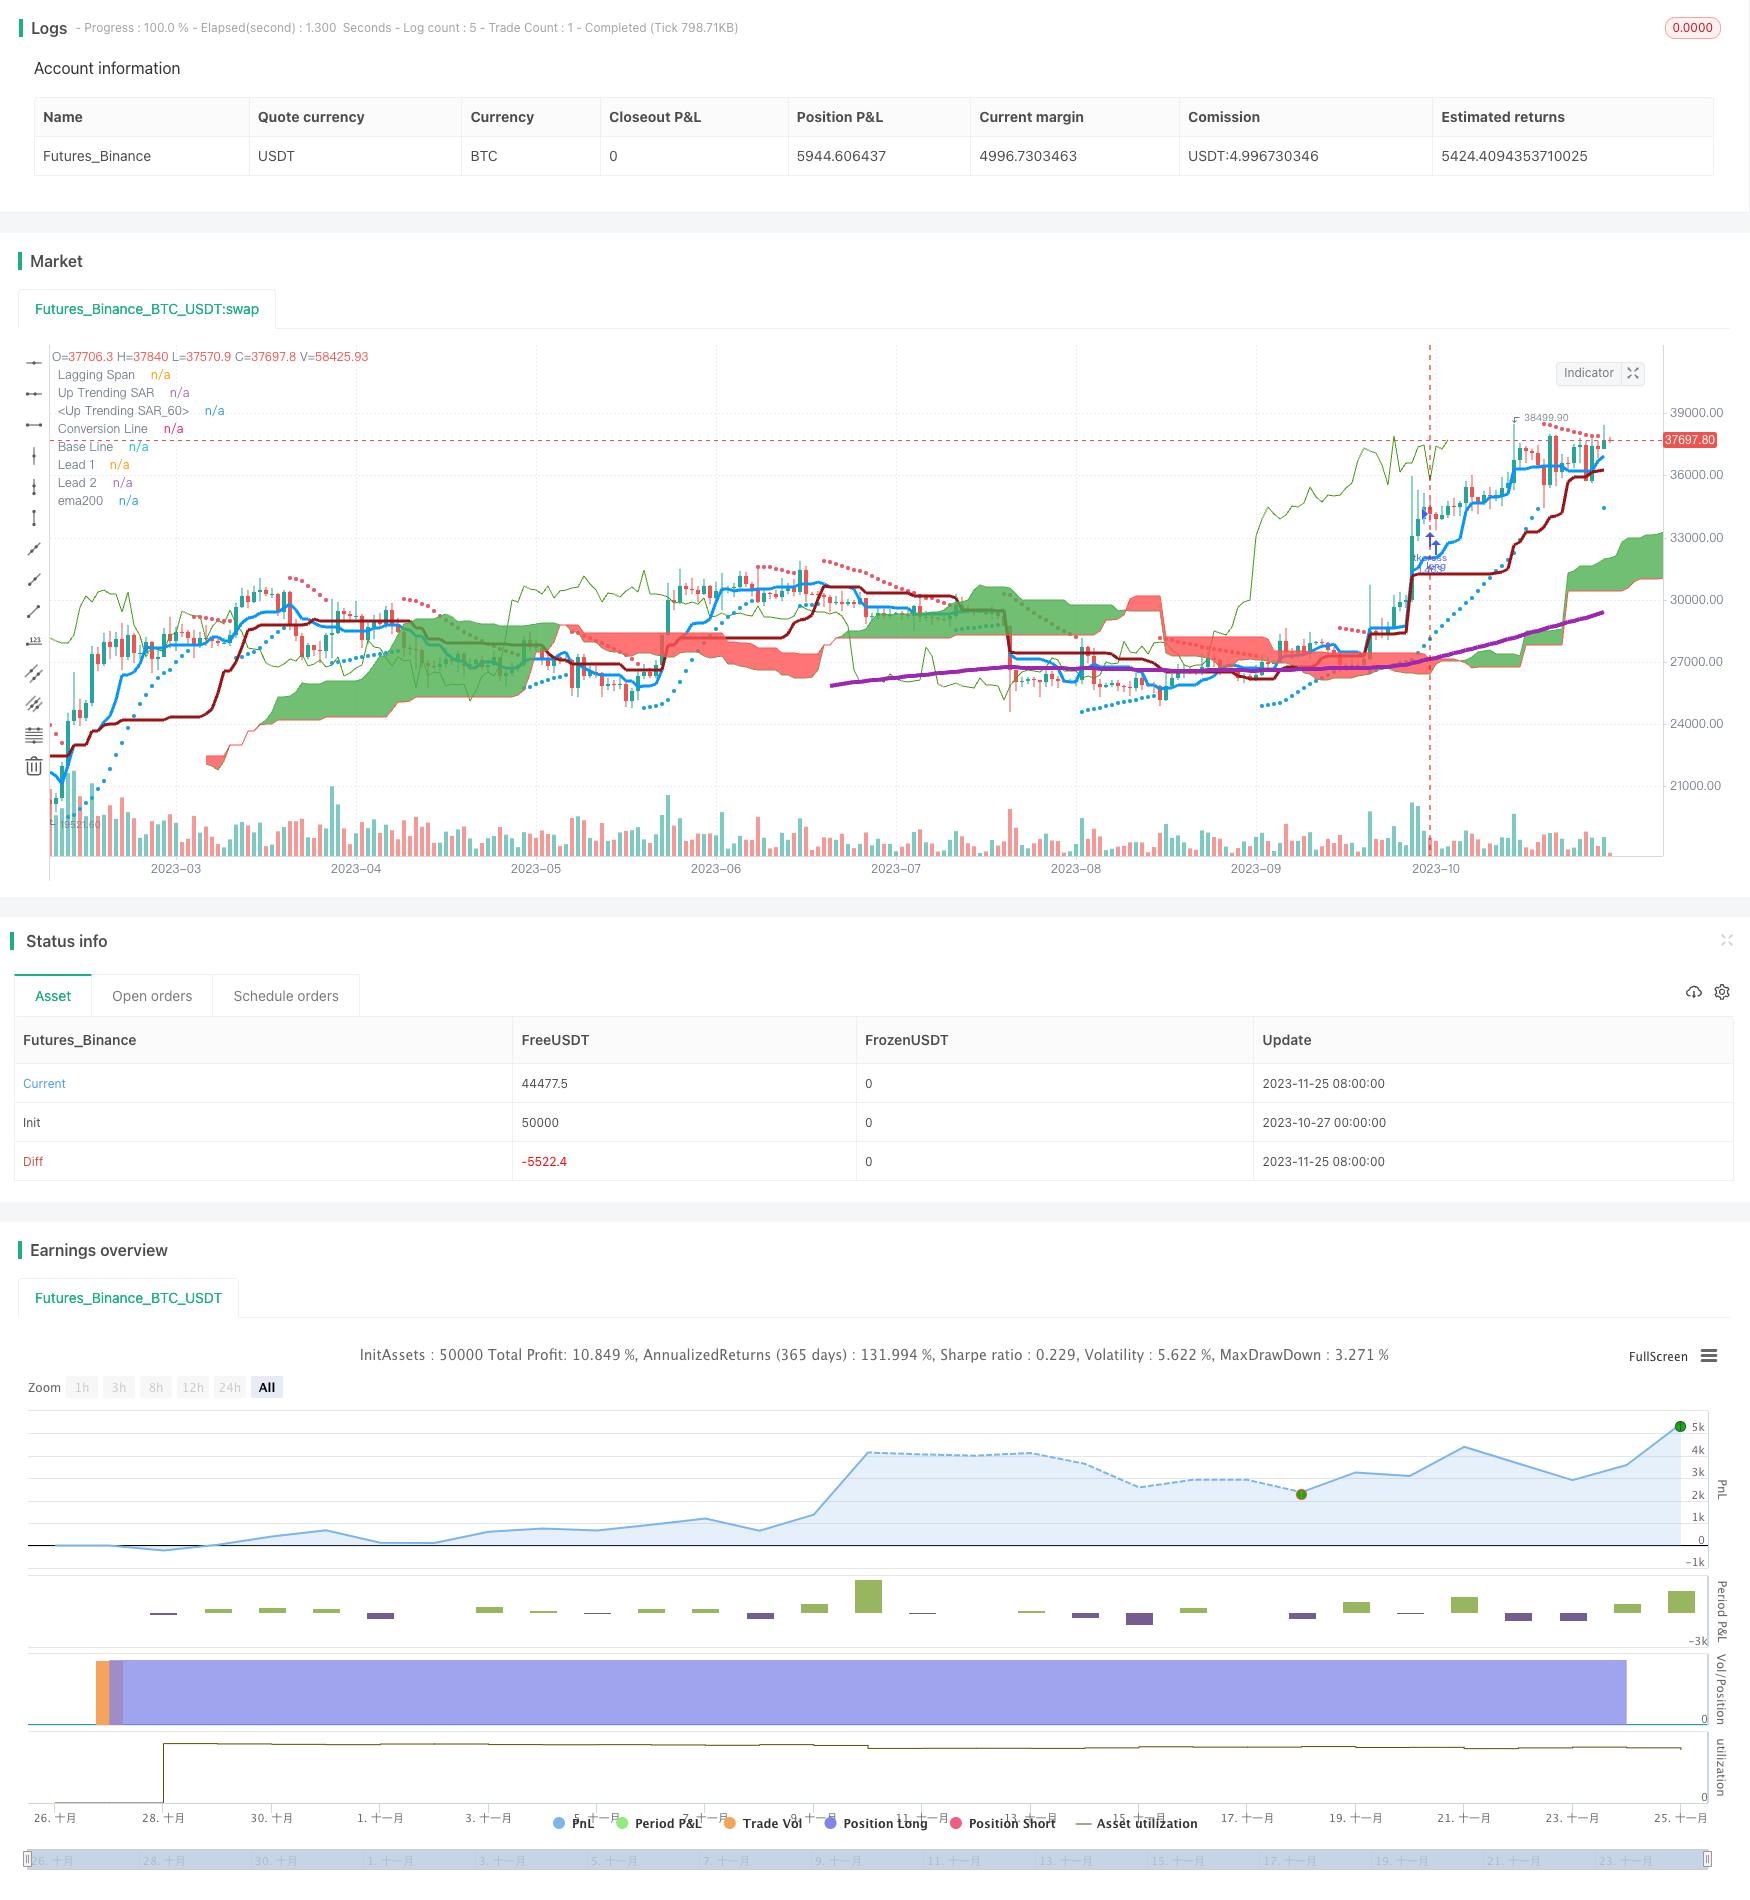
该策略是一个基于均线的趋势追踪型策略。它利用Ichimoku云图指标判断趋势方向,结合200日移动平均线过滤信号,实现趋势跟踪。
策略原理
该策略主要使用了一云图的转换线和基线来判断趋势方向。转换线是过去9天的中价平均值,基线是过去26天的中价平均值。当转换线上穿基线时为买入信号,下穿为卖出信号。
该策略还使用200日移动平均线来过滤信号。只有当收盘价高于200日线时,才会产生买入信号入市。这可以过滤掉大部分假信号。
在退出方面,策略简单的使用转换线下穿基线作为平仓信号。
优势分析
该策略结合趋势判断指标一云图和长期趋势过滤指标200日线,可以有效跟踪趋势,过滤掉大部分假信号。采用中价平均等参数可以减少由于价格异常波动对均线的影响。
相比单一使用移动平均线等指标,该策略可以更好地捕捉趋势转折点,从而及时调整仓位。这是其最大的优势。
风险分析
该策略主要依赖一云图指标判断趋势方向,而一云图本身也会产生错信号。如果判断产生偏差,该策略将可能导致损失。
此外,参数设置不当也会导致策略表现不佳。如果转换线参数过短,就容易形成假信号;如果基线参数过长,则跟踪效果会变差。需要调参优化以取得平衡。
优化方向
可以考虑结合其他指标来提高信号质量,例如KDJ指标判定超买超卖区域来过滤信号。或者使用ATR指标来设定止损位。
参数方面可以测试更多组合,如调整转换线参数为5或7天等,来获得更灵敏的交易信号。同时也可以测试修改基线参数为20天左右,以平衡跟踪效果。
此外,也可以考虑在特定波动环境下关闭策略,避开剧烈行情的影响。
总结
该策略整合趋势判断和长期过滤指标的优点,可以有效跟踪中长期趋势。同时参数设置和风控措施也需要持续优化,以减少错信号和波动带来的影响。整体来说该策略表现可以,有一定的实际操作价值。
||
Overview
This is a trend following strategy based on moving averages. It utilizes the Ichimoku Cloud indicator to determine trend direction combined with the 200-day moving average to filter signals, thus tracking the trend.
Strategy Principle
The strategy mainly uses the conversion line and base line of Ichimoku Cloud to judge trend direction. The conversion line is the 9-day median price average and the base line is the 26-day median price average. A buy signal is generated when the conversion line crosses above the base line and a sell signal when crossing below.
The strategy also employs the 200-day moving average to filter signals. Only when the closing price is above the 200-day line will a buy signal be triggered. This filters out most of the false signals.
On the exit side, the strategy simply uses the conversion line crossing below the base line as the closing signal.
Advantage Analysis
The strategy combines the trend judgment indicator Ichimoku Cloud and long-term trend filtering indicator 200-day line, which can effectively track trends and filter out most false signals. Using median price averages reduces the impact of price anomalies on moving averages.
Compared to solely using moving averages, this strategy can better capture trend turning points and timely adjust positions. This is its greatest strength.
Risk Analysis
The strategy relies mainly on Ichimoku Cloud to determine trend direction, which itself could also generate false signals. If judgment is inaccurate, the strategy may lead to losses.
In addition, improper parameter settings could also lead to poor strategy performance. If the conversion line parameter is too short, false signals are easily formed; if the base line parameter is too long, the tracking effect deteriorates. Parameter tuning for balance is needed.
Optimization Directions
Consider incorporating other indicators to improve signal quality, such as the KDJ indicator to filter signals in overbought/oversold areas. Or use the ATR indicator to set stop loss.
On the parameter side, test more combinations, such as adjusting the conversion line parameter to 5 or 7 days for more sensitive trading signals. Also test modifying the base line parameter to around 20 days to balance tracking.
In addition, consider disabling the strategy under certain volatile environments to avoid the impact of wild swings.
Conclusion
The strategy integrates the advantages of trend judgment and long-term filtering indicators, which can effectively track medium and long-term trends. Meanwhile, parameter settings and risk control measures also need continuous optimization to reduce false signals and impacts from fluctuations. Overall, the strategy has decent performance and practical value for actual trading.
[/trans]
Strategy Arguments
| Argument | Default | Description |
|---|---|---|
| v_input_1 | 9 | Conversion Line Periods |
| v_input_2 | 26 | Base Line Periods |
| v_input_3 | 52 | Lagging Span 2 Periods |
| v_input_4 | 26 | Displacement |
| v_input_5 | 2 | Start - Default = 2 - Multiplied by .01 |
| v_input_6 | 2 | Step Setting (Sensitivity) - Default = 2 - Multiplied by .01 |
| v_input_7 | 2 | Maximum Step (Sensitivity) - Default = 2 - Multiplied by .10 |
| v_input_8 | true | Show Up Trending Parabolic Sar |
| v_input_9 | true | Show Down Trending Parabolic Sar |
| v_input_10 | false | Start and Step settings are *.01 so 2 = .02 etc, Maximum Step is *.10 so 2 = .2 |
Source (PineScript)
/*backtest
start: 2023-10-27 00:00:00
end: 2023-11-26 00:00:00
period: 1d
basePeriod: 1h
exchanges: [{"eid":"Futures_Binance","currency":"BTC_USDT"}]
*/

//@version=3
strategy(title="TK Cross > EMA200 Strat",  overlay=true)

ema200 = ema(close, 200)
conversionPeriods = input(9, minval=1, title="Conversion Line Periods"),
basePeriods = input(26, minval=1, title="Base Line Periods")
laggingSpan2Periods = input(52, minval=1, title="Lagging Span 2 Periods"),
displacement = input(26, minval=1, title="Displacement")

donchian(len) => avg(lowest(len), highest(len))

conversionLine = donchian(conversionPeriods)
baseLine = donchian(basePeriods)
leadLine1 = avg(conversionLine, baseLine)
leadLine2 = donchian(laggingSpan2Periods)

plot(conversionLine, color=#0496ff, title="Conversion Line", linewidth=3)
plot(baseLine, color=#991515, title="Base Line", linewidth=3)
plot(close, offset = -displacement, color=#459915, title="Lagging Span")

p1 = plot(leadLine1, offset = displacement, color=green,
 title="Lead 1")
p2 = plot(leadLine2, offset = displacement, color=red,
 title="Lead 2")
fill(p1, p2, color = leadLine1 > leadLine2 ? green : red)

plot(ema200, color=purple, linewidth=4,title='ema200')
strategy.initial_capital = 50000

strategy.entry('tkcross', strategy.long, strategy.initial_capital / close, when=conversionLine>baseLine and close > ema200)
strategy.close('tkcross', when=conversionLine<baseLine)


start = input(2, minval=0, maxval=10, title="Start - Default = 2 - Multiplied by .01")
increment = input(2, minval=0, maxval=10, title="Step Setting (Sensitivity) - Default = 2 - Multiplied by .01" )
maximum = input(2, minval=1, maxval=10, title="Maximum Step (Sensitivity) - Default = 2 - Multiplied by .10")
sus = input(true, "Show Up Trending Parabolic Sar")
sds = input(true, "Show Down Trending Parabolic Sar")
disc = input(false, title="Start and Step settings are *.01 so 2 = .02 etc, Maximum Step is *.10 so 2 = .2")
//"------Step Setting Definition------"
//"A higher step moves SAR closer to the price action, which makes a reversal more likely."
//"The indicator will reverse too often if the step is set too high."

//"------Maximum Step Definition-----")
//"The sensitivity of the indicator can also be adjusted using the Maximum Step."
//"While the Maximum Step can influence sensitivity, the Step carries more weight"
//"because it sets the incremental rate-of-increase as the trend develops"

startCalc = start * .01
incrementCalc = increment * .01
maximumCalc = maximum * .10

sarUp = sar(startCalc, incrementCalc, maximumCalc)
sarDown = sar(startCalc, incrementCalc, maximumCalc)

colUp = close >= sarDown ? lime : na
colDown = close <= sarUp ? red : na

plot(sus and sarUp ? sarUp : na, title="Up Trending SAR", style=circles, linewidth=3,color=colUp)
plot(sds and sarDown ? sarDown : na, title="Up Trending SAR", style=circles, linewidth=3,color=colDown)
Detail
https://www.fmz.com/strategy/433433
Last Modified
2023-11-27 15:57:15