
8.4 KiB
Name
基于均线支撑阻力和交易量的高级入场条件策略-Advanced-Entry-Strategy-based-on-Moving-Average-Support-Resistance-and-Volume
Author
ChaoZhang
Strategy Description
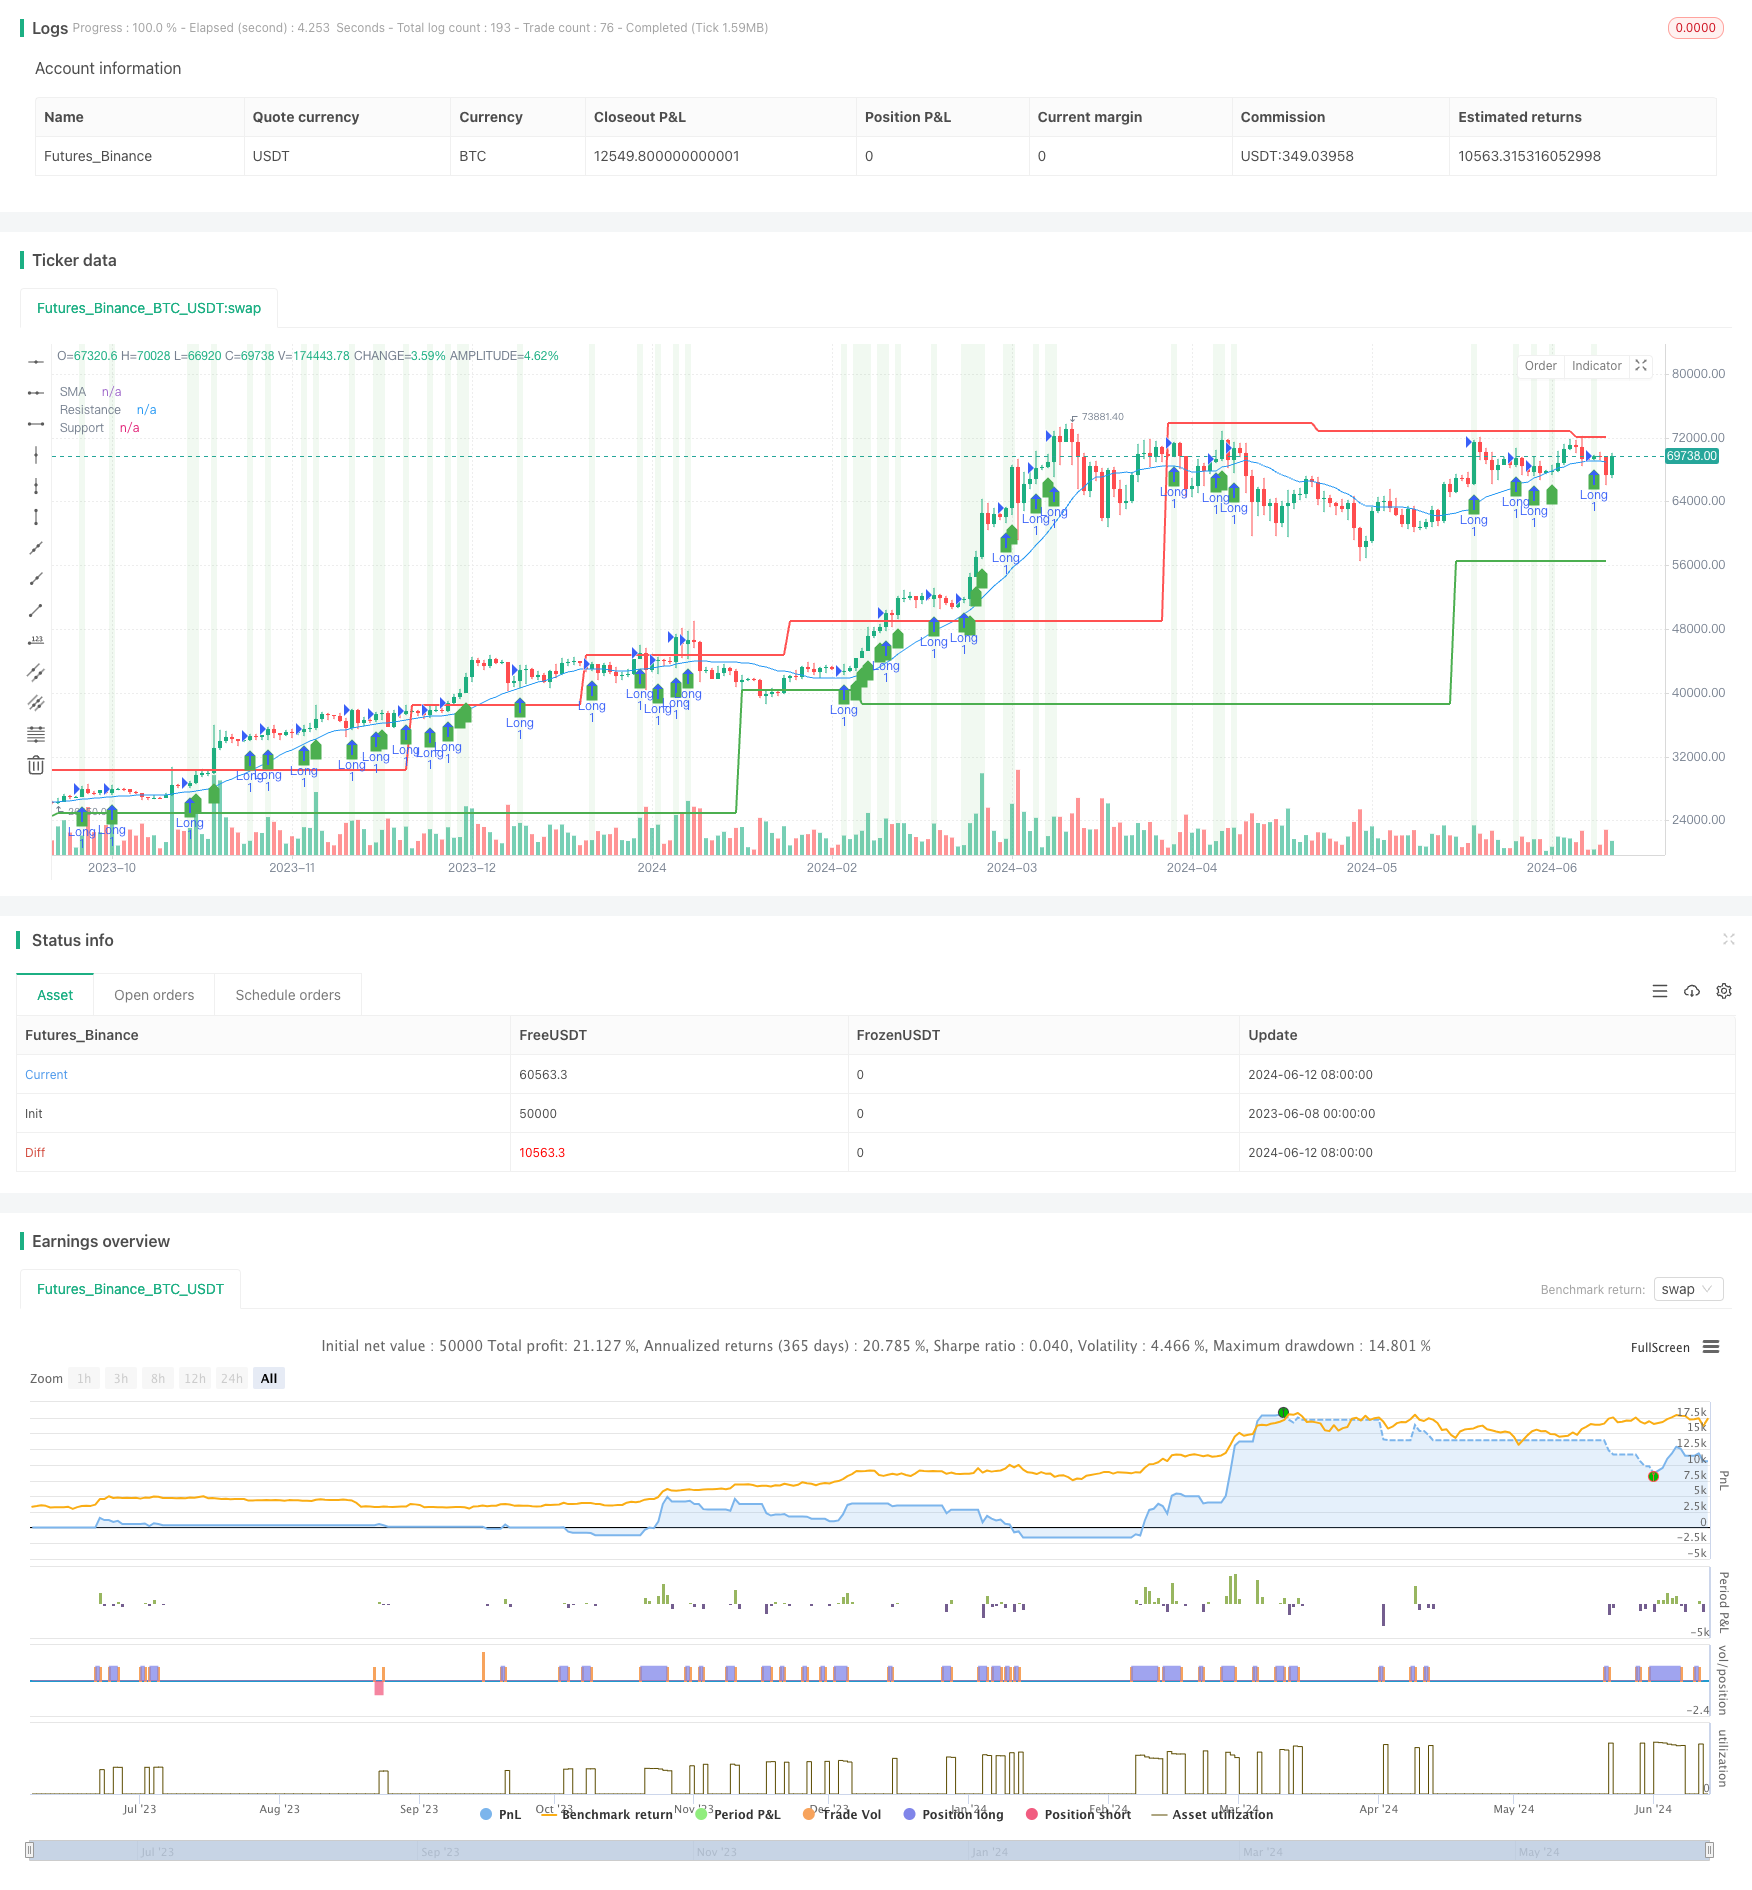 [trans]
概述
该策略结合了简单移动平均线(SMA)、支撑阻力位和交易量增加这三个技术指标,构建了一个全面的交易策略。策略的主要思路是在价格突破SMA均线、支撑阻力位且伴随交易量放大的情况下进行交易,同时设置了止损条件以控制风险。
策略原理
- 计算指定周期的SMA均线、支撑位和阻力位。
- 判断当前交易量是否较前一周期有所增加。
- 多头入场条件:当前收盘价大于前一周期收盘价,且大于SMA均线和支撑位,同时价格距离阻力位一定距离,并伴随交易量增加。
- 空头入场条件:当前收盘价小于前一周期收盘价,且小于SMA均线和支撑位,同时价格距离阻力位一定距离,并伴随交易量增加。
- 止损条件:多头止损价格为入场价格乘以(1-止损百分比),空头止损价格为入场价格乘以(1+止损百分比)。
优势分析
- 结合多个技术指标,提高了策略的可靠性和稳定性。
- 同时考虑价格突破SMA均线和支撑阻力位,能够更好地捕捉趋势性机会。
- 引入交易量指标,确保价格突破伴随足够的市场参与度,提高了信号的有效性。
- 设置止损条件,有效控制了交易风险。
风险分析
- 支撑阻力位的计算依赖于历史数据,在市场出现大幅波动时,可能失去有效性。
- 交易量指标可能出现异常波动,导致产生错误信号。
- 止损条件的设置可能无法完全避免市场极端情况下的损失。
优化方向
- 考虑引入其他技术指标,如相对强弱指数(RSI)或移动平均线收敛发散(MACD),以进一步验证交易信号的可靠性。
- 对支撑阻力位的计算方法进行优化,如采用更加动态的方法,以适应不同的市场状况。
- 对交易量指标进行平滑处理,减少异常波动对策略的影响。
- 优化止损条件的设置,如采用移动止损或根据市场波动情况动态调整止损百分比。
总结
该策略通过结合SMA均线、支撑阻力位和交易量指标,构建了一个全面的交易策略。策略的优势在于能够捕捉趋势性机会,同时控制交易风险。然而,策略也存在一定的局限性,如对市场极端情况的适应能力有待提高。未来可以通过引入其他技术指标、优化支撑阻力位计算方法、平滑交易量指标以及优化止损条件等方面对策略进行改进,以提高其稳定性和盈利能力。
||
Overview
This strategy combines three technical indicators: Simple Moving Average (SMA), support and resistance levels, and increased trading volume to construct a comprehensive trading strategy. The main idea of the strategy is to enter trades when the price breaks through the SMA, support/resistance levels, and is accompanied by an increase in trading volume, while setting stop-loss conditions to control risk.
Strategy Principle
- Calculate the SMA, support, and resistance levels for a specified period.
- Determine if the current trading volume has increased compared to the previous period.
- Long entry condition: The current closing price is greater than the previous period's closing price, greater than the SMA and support level, and the price is at a certain distance from the resistance level, accompanied by an increase in trading volume.
- Short entry condition: The current closing price is less than the previous period's closing price, less than the SMA and support level, and the price is at a certain distance from the resistance level, accompanied by an increase in trading volume.
- Stop-loss condition: The long stop-loss price is the entry price multiplied by (1 - stop-loss percentage), and the short stop-loss price is the entry price multiplied by (1 + stop-loss percentage).
Advantage Analysis
- By combining multiple technical indicators, the strategy's reliability and stability are improved.
- Considering both price breakouts of the SMA and support/resistance levels allows for better capture of trending opportunities.
- Introducing the trading volume indicator ensures that price breakouts are accompanied by sufficient market participation, enhancing the effectiveness of the signals.
- Setting stop-loss conditions effectively controls trading risk.
Risk Analysis
- The calculation of support and resistance levels relies on historical data and may lose effectiveness during significant market fluctuations.
- The trading volume indicator may experience abnormal fluctuations, leading to false signals.
- The stop-loss condition setting may not completely avoid losses in extreme market situations.
Optimization Direction
- Consider introducing other technical indicators, such as the Relative Strength Index (RSI) or Moving Average Convergence Divergence (MACD), to further validate the reliability of trading signals.
- Optimize the calculation method for support and resistance levels, such as adopting a more dynamic approach to adapt to different market conditions.
- Smooth the trading volume indicator to reduce the impact of abnormal fluctuations on the strategy.
- Optimize the setting of stop-loss conditions, such as using a trailing stop-loss or dynamically adjusting the stop-loss percentage based on market volatility.
Summary
This strategy combines the SMA, support and resistance levels, and trading volume indicators to construct a comprehensive trading strategy. The strategy's advantage lies in its ability to capture trending opportunities while controlling trading risk. However, the strategy also has certain limitations, such as its adaptability to extreme market situations needs improvement. In the future, the strategy can be improved by introducing other technical indicators, optimizing the calculation method for support and resistance levels, smoothing the trading volume indicator, and optimizing stop-loss conditions to enhance its stability and profitability. [/trans]
Source (PineScript)
/*backtest
start: 2023-06-08 00:00:00
end: 2024-06-13 00:00:00
period: 1d
basePeriod: 1h
exchanges: [{"eid":"Futures_Binance","currency":"BTC_USDT"}]
*/

//@version=4
strategy("Advanced Entry Conditions with Support/Resistance, SMA, and Volume", overlay=true)

// Inputs
length = input(20, title="SMA Length")
stopLossPerc = input(1, title="Stop Loss Percentage", type=input.float) / 100
leftBars = input(15, title="Left Bars")
rightBars = input(15, title="Right Bars")
distanceThresh = input(1, title="Distance Threshold from Support/Resistance", type=input.float) / 100

// Calculations
smaValue = sma(close, length)
highUsePivot = fixnan(pivothigh(leftBars, rightBars)[1])
lowUsePivot = fixnan(pivotlow(leftBars, rightBars)[1])

// Volume Calculation
volumeIncrease = volume > volume[1]

// Entry Conditions
longEntryCondition = close[0] > close[1] and close[1] > smaValue and close[0] > smaValue and close[0] > lowUsePivot and close[1] > lowUsePivot and abs(close[0] - highUsePivot) > distanceThresh and volumeIncrease
shortEntryCondition = close[0] < close[1] and close[1] < smaValue and close[0] < smaValue and close[0] < lowUsePivot and close[1] < lowUsePivot and abs(close[0] - highUsePivot) > distanceThresh and volumeIncrease

// Calculate stop loss levels
longStopLoss = close * (1 - stopLossPerc)
shortStopLoss = close * (1 + stopLossPerc)

// Strategy Logic
strategy.entry("Long", strategy.long, when=longEntryCondition)
strategy.exit("Exit Long", "Long", stop=longStopLoss)

strategy.entry("Short", strategy.short, when=shortEntryCondition)
strategy.exit("Exit Short", "Short", stop=shortStopLoss)

// Plotting
plot(smaValue, color=color.blue, title="SMA")
plot(highUsePivot, color=color.red, linewidth=2, title="Resistance")
plot(lowUsePivot, color=color.green, linewidth=2, title="Support")

plotshape(series=longEntryCondition, location=location.belowbar, color=color.green, style=shape.labelup, title="Long Entry")
plotshape(series=shortEntryCondition, location=location.abovebar, color=color.red, style=shape.labeldown, title="Short Entry")

// Background Color
bgcolor(longEntryCondition ? color.new(color.green, 90) : shortEntryCondition ? color.new(color.red, 90) : na)
Detail
https://www.fmz.com/strategy/454148
Last Modified
2024-06-14 15:40:46