
7.9 KiB
Name
基于双RSI指标的自适应波段交易系统-Adaptive-Range-Trading-System-Based-on-Dual-RSI-Indicators
Author
ChaoZhang
Strategy Description
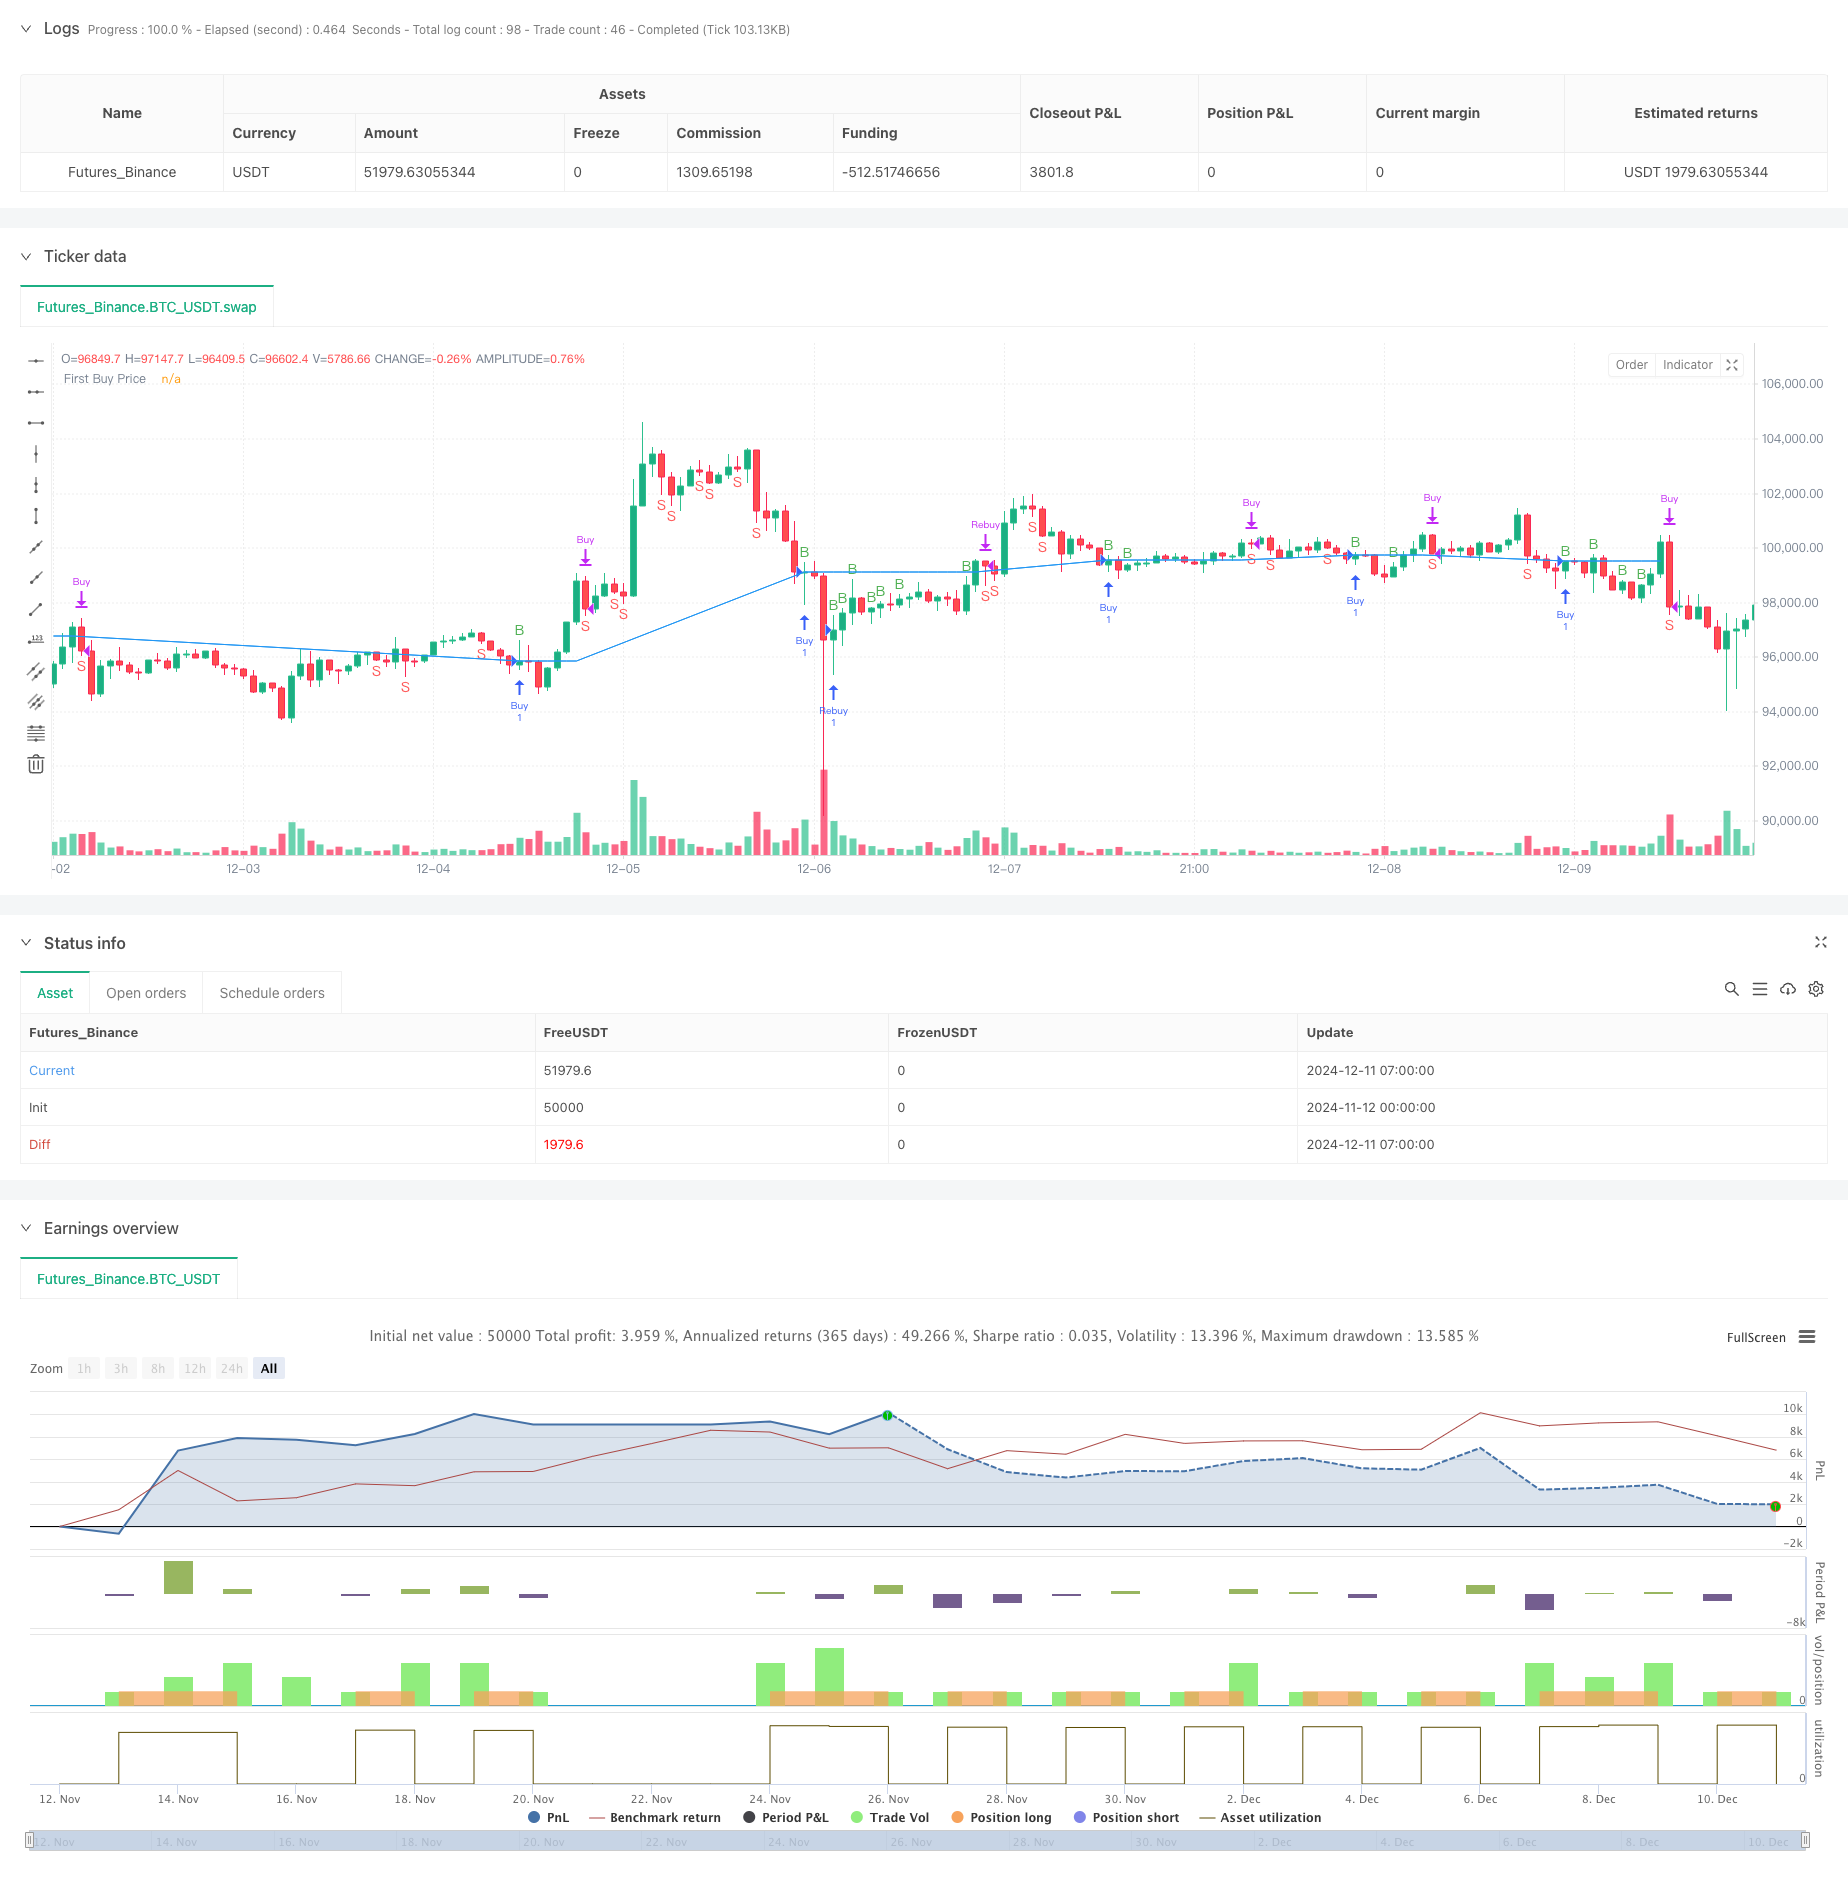
[trans]
概述
该策略是一个基于双重RSI(相对强弱指数)指标的自适应交易系统。它结合了不同时间周期的RSI指标来识别市场趋势和交易机会,并通过资金管理和风险控制机制来优化交易表现。该策略的核心在于通过多周期RSI的协同配合,在保证交易安全性的同时提高盈利能力。
策略原理
策略采用7周期的RSI指标作为主要交易信号,同时结合日线RSI作为趋势过滤器。当短周期RSI从40以下向上突破且日线RSI大于55时,系统会发出做多信号。如果持仓期间价格下跌低于首次建仓价格,系统会自动加仓以降低平均成本。当RSI从60以上向下突破时,系统平仓获利。同时设置了5%的止损以控制风险。策略还包含了资金管理模块,根据总资金和预设风险比例自动计算每次交易的仓位大小。
策略优势
- 多周期RSI配合提高了信号的可靠性
- 具备自适应的加仓机制,可以有效降低持仓成本
- 完善的资金管理系统,根据风险偏好自动调整仓位
- 固定止损保护,严格控制每笔交易的风险
- 考虑了交易成本,更符合实际交易环境
策略风险
- RSI指标可能在剧烈波动市场中产生虚假信号
- 加仓机制在持续下跌行情中可能导致较大损失
- 固定百分比止损可能在高波动率时期过于保守
- 交易成本可能在频繁交易时显著影响收益
- 需要充足的流动性支持策略执行
策略优化方向
- 引入波动率指标(如ATR)来动态调整止损位置
- 增加趋势强度过滤器以减少震荡市场中的虚假信号
- 优化加仓逻辑,考虑市场波动性进行动态调整
- 加入更多时间周期的RSI确认信号
- 开发自适应的仓位管理系统
总结
这是一个结合了技术分析和风险管理的完整交易系统。通过多周期RSI的协同作用提供交易信号,并通过资金管理和止损机制控制风险。该策略适合在趋势明显的市场中运行,但需要根据实际市场情况进行参数优化。系统的可扩展性良好,为进一步优化预留了空间。 ||
Overview
This strategy is an adaptive trading system based on dual RSI (Relative Strength Index) indicators. It combines RSI indicators from different timeframes to identify market trends and trading opportunities while optimizing trading performance through money management and risk control mechanisms. The core strength of the strategy lies in the synergy between multi-period RSIs to enhance profitability while maintaining trading safety.
Strategy Principles
The strategy uses a 7-period RSI indicator as the primary trading signal, combined with a daily RSI as a trend filter. A long position is initiated when the short-period RSI breaks above 40 and the daily RSI is above 55. If the price drops below the initial entry price during a position, the system automatically adds to the position to lower the average cost. Positions are closed when RSI breaks below from above 60. A 5% stop-loss is implemented for risk control. The strategy also includes a money management module that automatically calculates position sizes based on total capital and preset risk ratios.
Strategy Advantages
- Multi-period RSI combination improves signal reliability
- Adaptive position averaging mechanism effectively reduces holding costs
- Comprehensive money management system adjusts positions based on risk preference
- Fixed stop-loss protection strictly controls risk per trade
- Considers trading costs for more realistic trading conditions
Strategy Risks
- RSI indicators may generate false signals in volatile markets
- Position averaging mechanism may lead to significant losses in continuous downtrends
- Fixed percentage stop-loss may be too conservative in high volatility periods
- Trading costs can significantly impact returns during frequent trading
- Strategy execution requires sufficient liquidity
Optimization Directions
- Incorporate volatility indicators (like ATR) for dynamic stop-loss adjustment
- Add trend strength filters to reduce false signals in ranging markets
- Optimize position averaging logic with dynamic adjustments based on market volatility
- Include RSI confirmations from additional timeframes
- Develop adaptive position sizing system
Summary
This is a complete trading system combining technical analysis and risk management. It generates trading signals through multi-period RSI coordination while controlling risk through money management and stop-loss mechanisms. The strategy is suitable for trending markets but requires parameter optimization based on actual market conditions. The system's good extensibility leaves room for further optimization.[/trans]
Source (PineScript)
/*backtest
start: 2024-11-12 00:00:00
end: 2024-12-11 08:00:00
period: 1h
basePeriod: 1h
exchanges: [{"eid":"Futures_Binance","currency":"BTC_USDT"}]
*/

//@version=5
strategy("Dual RSI with Rebuy Logic + Capital, Commission, and Stop Loss", overlay=true)

// Parameter
rsi_length = input.int(7, title="RSI Length")
daily_rsi_length = input.int(7, title="Daily RSI Length")
capital = input.float(10000, title="Initial Capital", minval=0)  // Kapital
risk_per_trade = input.float(0.01, title="Risk per Trade (%)", minval=0.01, maxval=1.0)  // Risikogröße in Prozent
commission = input.float(0.1, title="Commission (%)", minval=0, maxval=100)  // Kommission in Prozent
stop_loss_pct = input.float(5, title="Stop Loss (%)", minval=0.1, maxval=100)  // Stop-Loss in Prozent

// Ordergröße berechnen
risk_amount = capital * risk_per_trade
order_size = risk_amount / close  // Größe der Order basierend auf Risikogröße und Preis

// Daily RSI
day_rsi = request.security(syminfo.tickerid, "D", ta.rsi(close, daily_rsi_length), lookahead=barmerge.lookahead_on)

// RSI auf aktuellem Timeframe
rsi = ta.rsi(close, rsi_length)

// Kauf- und Verkaufsbedingungen
buy_condition = rsi[1] < 40 and rsi > rsi[1] and day_rsi > 55
sell_condition = rsi[1] > 60 and rsi < rsi[1]

// Variablen, um den Preis des ersten Kaufs zu speichern
var float first_buy_price = na
var bool is_position_open = false

// Kauf-Logik
if buy_condition
    if not is_position_open
        // Initiales Kaufsignal
        strategy.entry("Buy", strategy.long, qty=1)
        first_buy_price := close
        is_position_open := true
    else if close < first_buy_price
        // Rebuy-Signal, nur wenn Preis niedriger als erster Kaufpreis
        strategy.entry("Rebuy", strategy.long, qty=1)

// Verkaufs-Logik
if sell_condition and is_position_open
    strategy.close("Buy")
    strategy.close("Rebuy")
    first_buy_price := na  // Zurücksetzen des Kaufpreises
    is_position_open := false

// Stop-Loss-Bedingung
if is_position_open
    // Stop-Loss-Preis berechnen (5% unter dem Einstiegspreis)
    stop_loss_price = first_buy_price * (1 - stop_loss_pct / 100)

    // Stop-Loss für "Buy" und "Rebuy" festlegen
    strategy.exit("Stop Loss Buy", from_entry="Buy", stop=stop_loss_price)
    strategy.exit("Stop Loss Rebuy", from_entry="Rebuy", stop=stop_loss_price)

// Performance-Metriken berechnen (mit Kommission)
gross_profit = strategy.netprofit / capital * 100
commission_cost = commission / 100 * strategy.closedtrades
net_profit = gross_profit - commission_cost

// Debug-Plots
plot(first_buy_price, title="First Buy Price", color=color.blue, linewidth=1)
plotchar(buy_condition, title="Buy Condition", char='B', location=location.abovebar, color=color.green)
plotchar(sell_condition, title="Sell Condition", char='S', location=location.belowbar, color=color.red)

// Debugging für Performance
Detail
https://www.fmz.com/strategy/474983
Last Modified
2024-12-13 11:57:17