
8.6 KiB
Name
基于双EMA和价格波动率指标的量化交易策略Quantitative-Trading-Strategy-Based-on-Double-EMA-and-Price-Volatility-Index
Author
ChaoZhang
Strategy Description
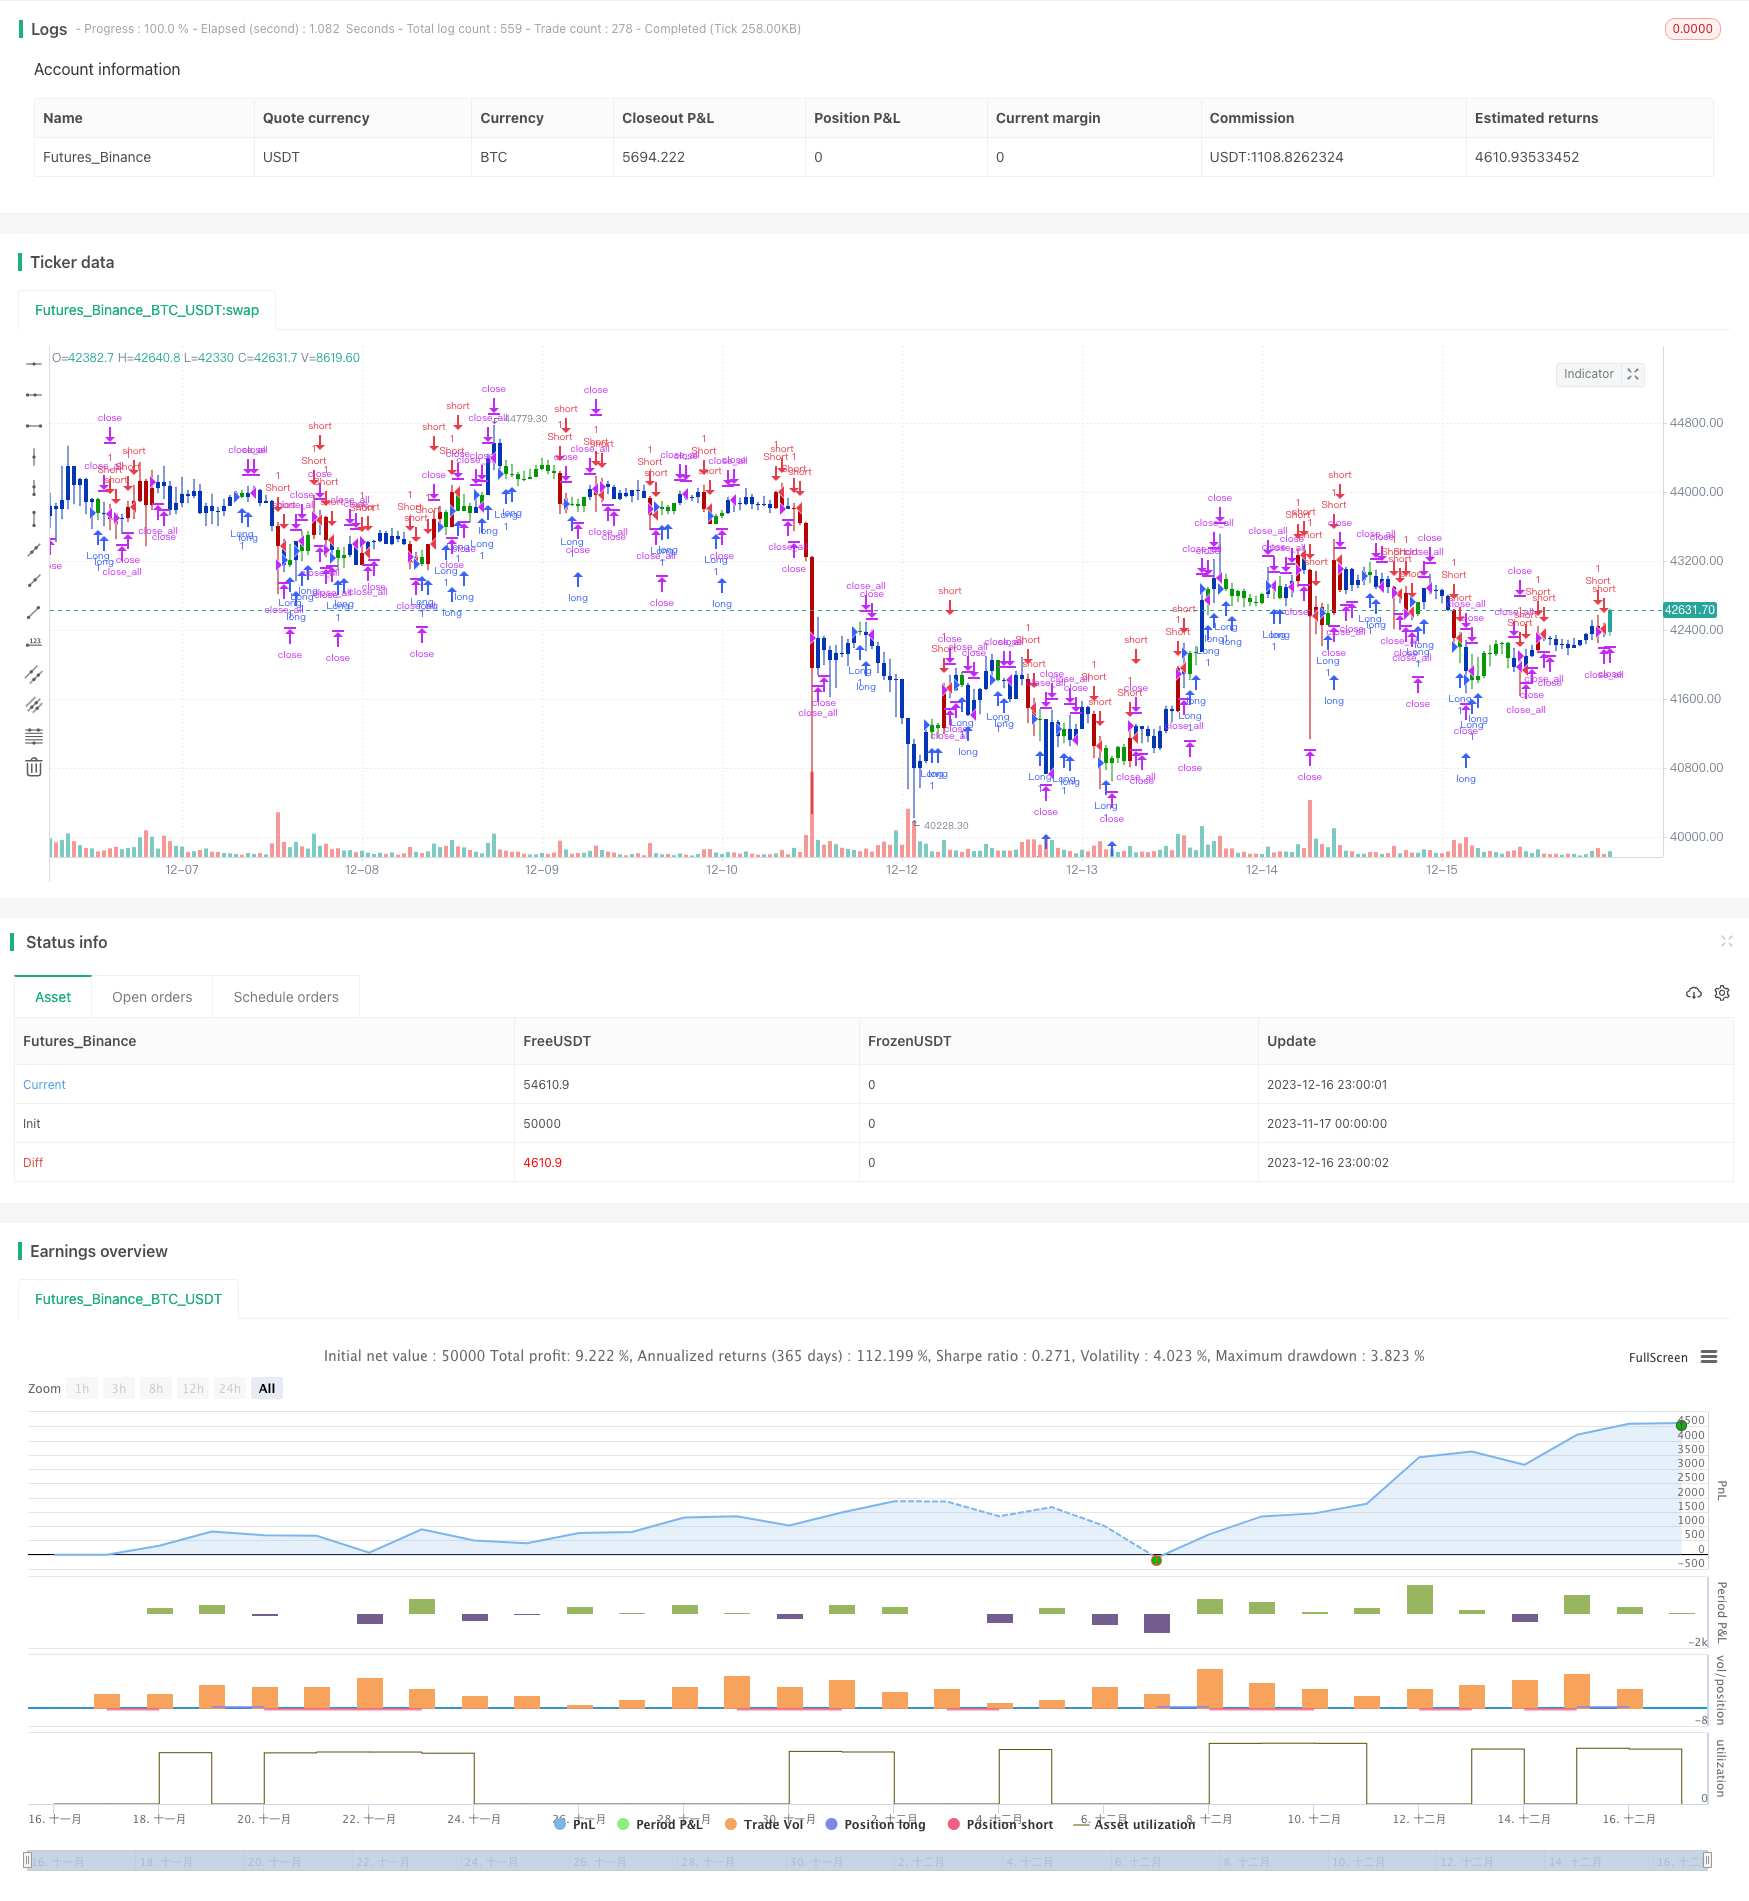 [trans]
概述
本策略名为“均线指标与价格波动率组合策略”。它结合了双指数移动平均线(Double Exponential Moving Average, DEMA)和价格波动率指标,实现了一个综合交易信号的生成。
策略原理
该策略由两部分组成:
-
DEMA指标。该指标计算20日和2日的指数移动平均线,当价格从上方向下突破2日线或从下方向上突破20日线时,产生交易信号。
-
(最高价-最低价)/收盘价波动率指标。该指标反映价格在一个周期内的波动幅度。这里我们计算过去20根K线的波动率指标的16日简单移动平均,当当前K线的波动率高于或低于该平均值时,产生交易信号。
将两组信号结合,如果DEMA和波动率指标同时发出信号,则生成最终的多头或空头交易指令。
优势分析
该策略具有以下优势:
-
组合多个指标,可以减少假信号,提高信号的可靠性。
-
20日线能有效识别中长线趋势,2日线能捕捉短期波动,组合使用可以应对不同市场环境。
-
波动率指标能够有效反映市场的波动性和交易机会。
-
通过调整参数,可以适应不同品种和周期的市场。
风险分析
该策略也存在一些风险:
-
在波动率较低的趋势市中,波动率指标可能会产生错误信号。可以结合其他流动性指标进行过滤。
-
在快速单边行情中,双EMA可能产生滞后。可以适当缩短参数,或与其他指标组合。
-
多指标组合增加了策略复杂度,也增加了过优化的风险。需进行全面回测和参数稳定性检验。
优化方向
该策略还可以从以下方面进行优化:
-
增加止损机制,可以有效控制每单损失。
-
根据不同品种和周期参数进行优化,使参数更具适应性。
-
增加流动性和波动率指标进行组合,提高信号质量。
-
增加机器学习算法,实现动态参数和权重调整。
总结
该策略结合双EMA和波动率指标,能够在趋势和震荡市中都获得不错的交易表现。同时也存在一定的风险,需要进一步优化与改进。但总体来说,该策略思路清晰,具有实际操作价值。
||
Overview
This strategy is called "Moving Average Indicator and Price Volatility Combination Strategy". It combines the double exponential moving average (DEMA) and the price volatility index to generate a comprehensive trading signal.
Principle
The strategy consists of two parts:
-
DEMA indicator. This indicator calculates the 20-day and 2-day exponential moving averages. It generates trading signals when the price breaks through the 2-day line from above or breaks through the 20-day line from below.
-
(Highest Price - Lowest Price)/Close Price Volatility Index. This index reflects the fluctuation range of prices within one period. Here we calculate the 16-day simple moving average of the volatility index over the past 20 bars. When the current bar's volatility is higher or lower than this average value, it generates trading signals.
The signals from the two parts are combined. If DEMA and volatility index give signals at the same time, the final long or short trading orders will be generated.
Advantage Analysis
The strategy has the following advantages:
-
Combining multiple indicators can reduce false signals and improve signal reliability.
-
The 20-day line can effectively identify medium-to-long term trends, and the 2-day line can capture short-term fluctuations, making the combination adaptable to different market environments.
-
The volatility index can effectively reflect market volatility and trading opportunities.
-
By adjusting parameters, it can adapt to different products and cycle markets.
Risk Analysis
The strategy also has some risks:
-
In low volatility trends, the volatility index may generate wrong signals. Filtering with other liquidity indicators may help.
-
In rapid one-way markets, double EMAs may lag. Shortening parameters appropriately or combining with other indicators may help.
-
The increased complexity of multiple indicators also increases the risk of over-optimization. Comprehensive backtesting and parameter stability testing are required.
Optimization Directions
The strategy can also be optimized in the following aspects:
-
Adding stop loss mechanisms can effectively control per order loss.
-
Optimize parameters for different products and cycles to improve adaptability.
-
Increasing liquidity and volatility indicators to improve signal quality.
-
Adding machine learning algorithms to achieve dynamic parameter and weight adjustment.
Conclusion
By combining double EMAs and volatility indexes, this strategy can achieve good trading performance in both trending and volatile markets. There are also certain risks that require further optimization and improvement. But overall, the strategy idea is clear and has practical value.
[/trans]
Strategy Arguments
| Argument | Default | Description |
|---|---|---|
| v_input_int_1 | 14 | (?●═════ 2/20 EMA ═════●)Length |
| v_input_1 | 20 | (?●═════ H-L/C Histogram ═════●)Look Back |
| v_input_2 | false | % change |
| v_input_3 | 16 | SMA Length |
| v_input_bool_1 | false | (?●═════ MISC ═════●)Trade reverse |
| v_input_int_2 | true | (?●═════ Time Start ═════●)From Day |
| v_input_int_3 | true | From Month |
| v_input_int_4 | 2005 | From Year |
Source (PineScript)
/*backtest
start: 2023-11-17 00:00:00
end: 2023-12-17 00:00:00
period: 1h
basePeriod: 15m
exchanges: [{"eid":"Futures_Binance","currency":"BTC_USDT"}]
*/

//@version=5
////////////////////////////////////////////////////////////
//  Copyright by HPotter v1.0 12/04/2022
// This is combo strategies for get a cumulative signal.
//
// First strategy
// This indicator plots 2/20 exponential moving average. For the Mov
// Avg X 2/20 Indicator, the EMA bar will be painted when the Alert criteria is met.
//
// Second strategy
//  This histogram displays (high-low)/close
//  Can be applied to any time frame.
//
//
// WARNING:
// - For purpose educate only
// - This script to change bars colors.
////////////////////////////////////////////////////////////
EMA20(Length) =>
    pos = 0.0
    xPrice = close
    xXA = ta.ema(xPrice, Length)
    nHH = math.max(high, high[1])
    nLL = math.min(low, low[1])
    nXS = nLL > xXA or nHH < xXA ? nLL : nHH
    iff_1 = nXS < close[1] ? 1 : nz(pos[1], 0)
    pos := nXS > close[1] ? -1 : iff_1
    pos


HLCH(input_barsback,input_percentorprice,input_smalength) =>
    pos = 0.0
    xPrice = (high-low)/close
    xPriceHL = (high-low)
    xPrice1 = input_percentorprice ? xPrice * 100: xPriceHL
    xPrice1SMA = ta.sma(math.abs(xPrice1), input_smalength)
    pos := xPrice1SMA[input_barsback] > math.abs(xPrice1) ? 1 :
    	     xPrice1SMA[input_barsback] < math.abs(xPrice1) ? -1 : nz(pos[1], 0)
    pos

strategy(title='Combo 2/20 EMA & (H-L)/C Histogram', shorttitle='Combo', overlay=true)
var I1 = '●═════ 2/20 EMA ═════●'
Length = input.int(14, minval=1, group=I1)
var I2 = '●═════ (H-L)/C Histogram  ═════●'
input_barsback = input(20, title="Look Back", group=I2)
input_percentorprice = input(false, title="% change", group=I2)
input_smalength = input(16, title="SMA Length", group=I2)
var misc = '●═════ MISC ═════●'
reverse = input.bool(false, title='Trade reverse', group=misc)
var timePeriodHeader = '●═════ Time Start ═════●'
d = input.int(1, title='From Day', minval=1, maxval=31, group=timePeriodHeader)
m = input.int(1, title='From Month', minval=1, maxval=12, group=timePeriodHeader)
y = input.int(2005, title='From Year', minval=0, group=timePeriodHeader)
StartTrade = time > timestamp(y, m, d, 00, 00) ? true : false
posEMA20 = EMA20(Length)
prePosHLCH = HLCH(input_barsback,input_percentorprice,input_smalength)
iff_1 = posEMA20 == -1 and prePosHLCH == -1 and StartTrade ? -1 : 0
pos = posEMA20 == 1 and prePosHLCH == 1 and StartTrade ? 1 : iff_1
iff_2 = reverse and pos == -1 ? 1 : pos
possig = reverse and pos == 1 ? -1 : iff_2
if possig == 1
    strategy.entry('Long', strategy.long)
if possig == -1
    strategy.entry('Short', strategy.short)
if possig == 0
    strategy.close_all()
barcolor(possig == -1 ? #b50404 : possig == 1 ? #079605 : #0536b3)
Detail
https://www.fmz.com/strategy/435713
Last Modified
2023-12-18 11:26:49