
12 KiB
Name
基于双时间框架EMA交叉信号的多空策略Dual-Timeframe-EMA-Crossover-Long-Short-Strategy
Author
ChaoZhang
Strategy Description
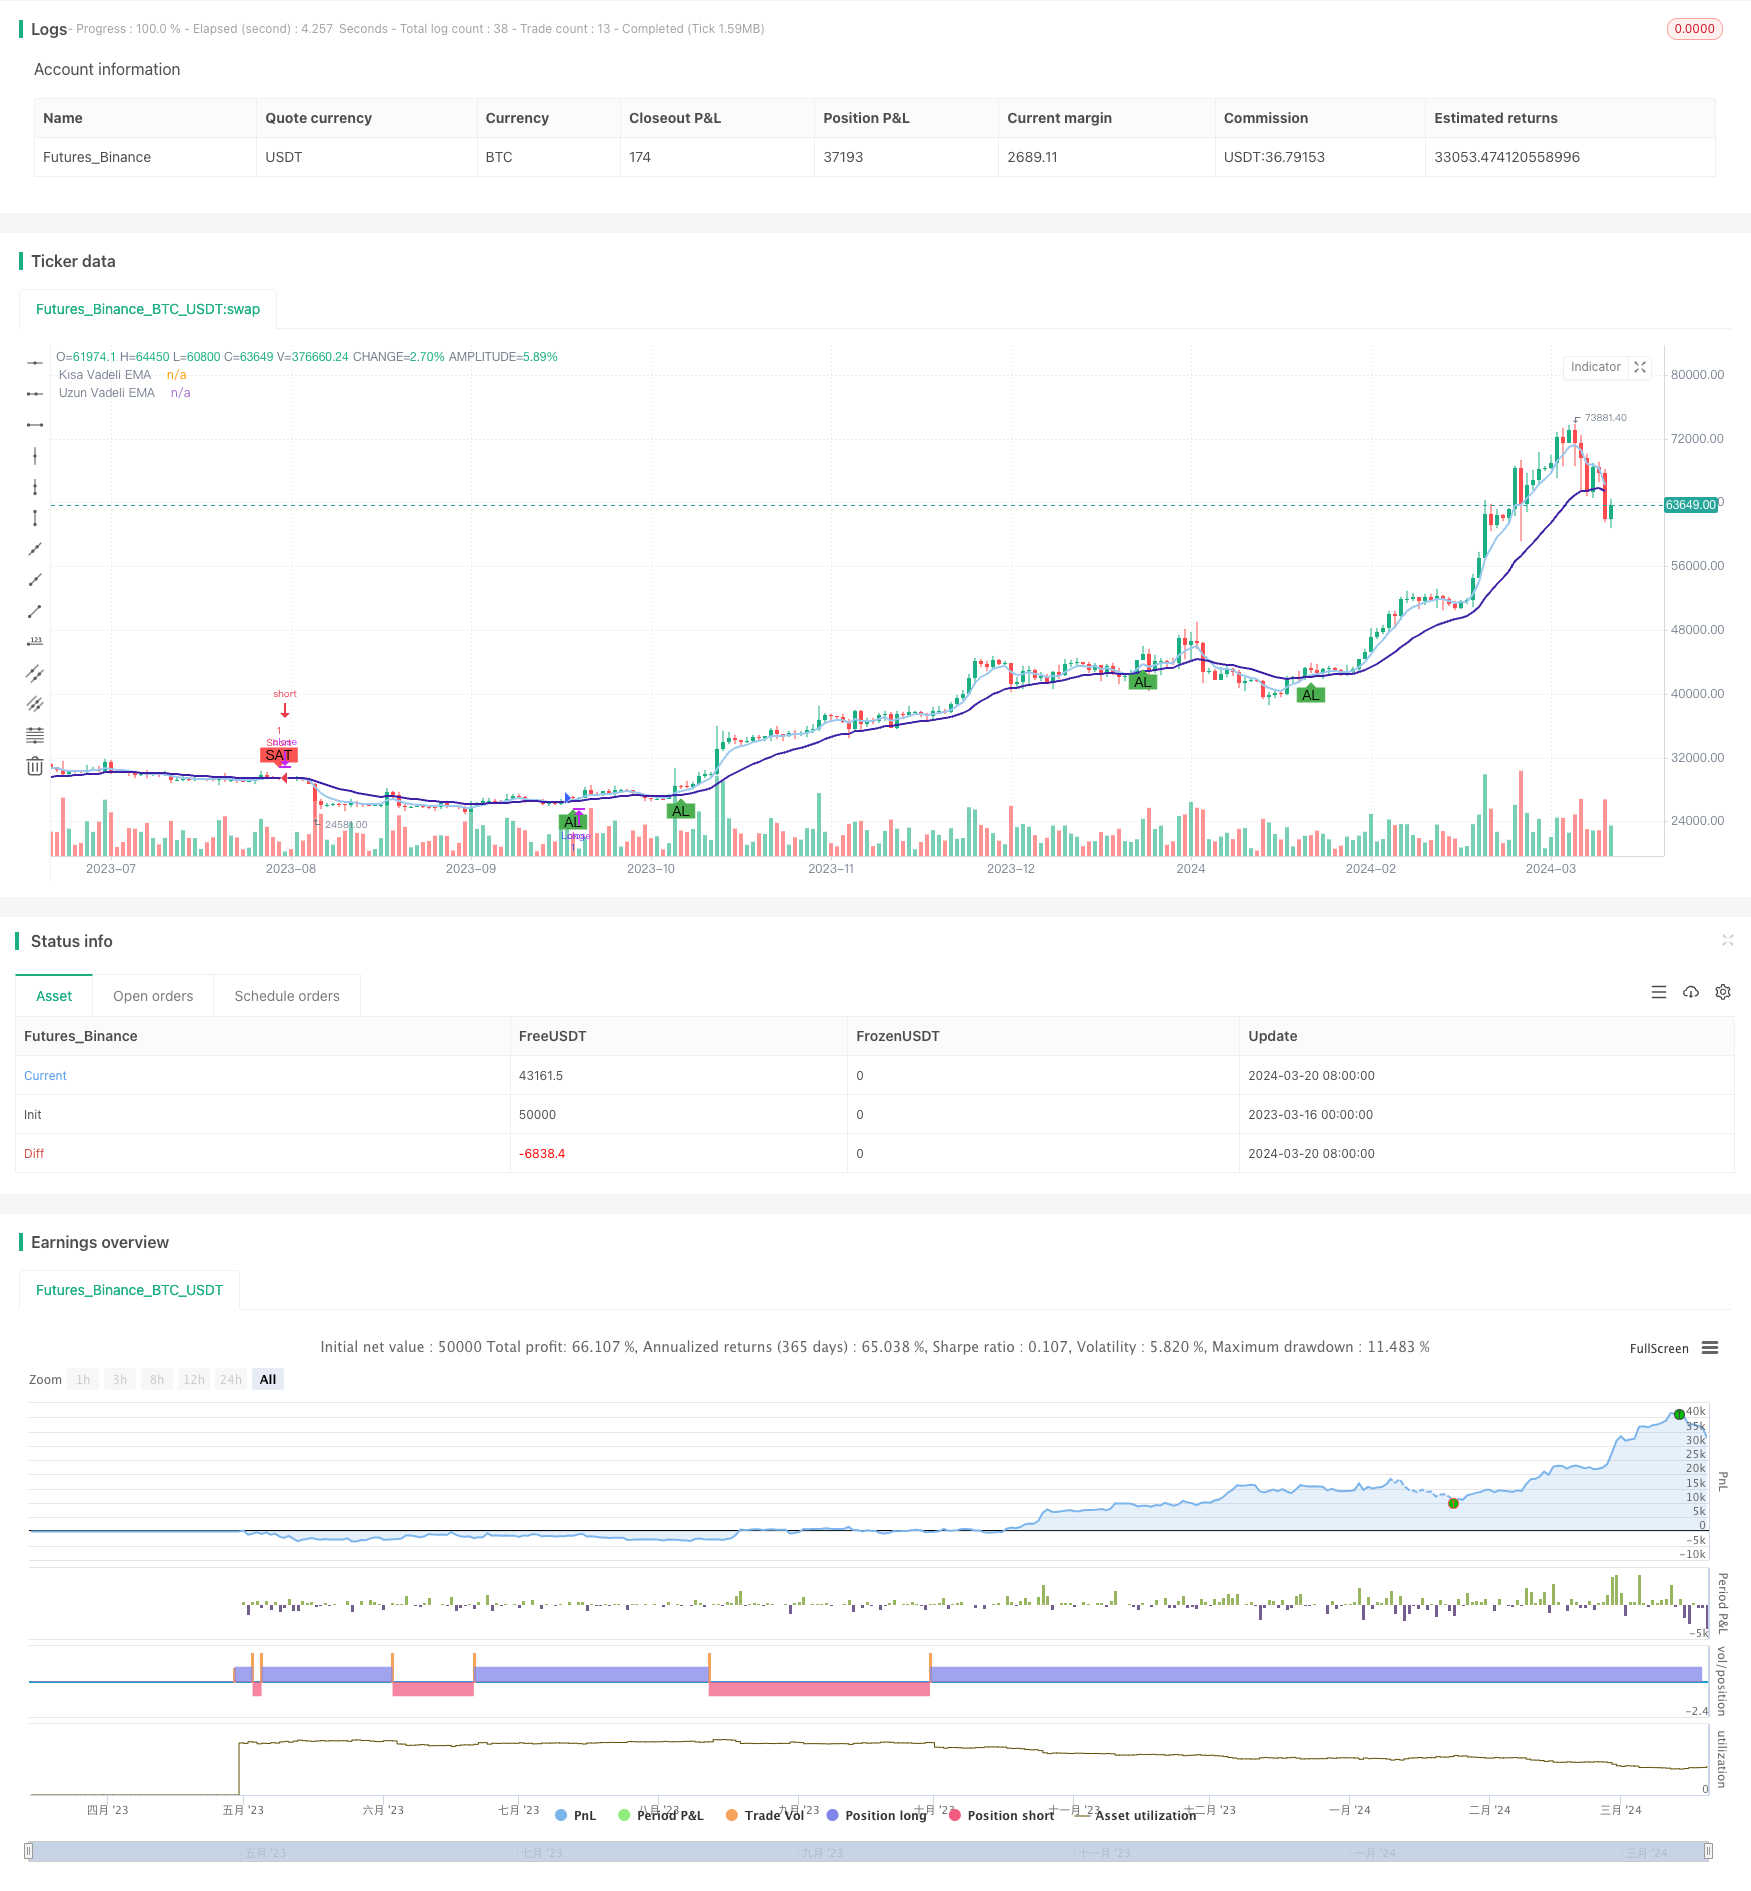 [trans]
概述
该策略基于两个不同时间框架的指数移动平均线(EMA)交叉信号进行多空交易。当较短时间框架的EMA在较长时间框架EMA上方交叉时,产生做多信号;当较短时间框架的EMA在较长时间框架EMA下方交叉时,产生做空信号。该策略利用了不同时间框架的趋势信息,通过较短时间框架确认较长时间框架的趋势,以捕捉市场的主要趋势。
策略原理
该策略使用两个不同时间框架的EMA交叉信号来捕捉市场趋势:
-
较长时间框架(默认为2小时)的EMA交叉信号用于确定主要趋势方向。当较短期EMA(默认为5周期)上穿较长期EMA(默认为20周期)时,表明上升趋势;反之,表明下降趋势。
-
较短时间框架(默认为3分钟)的EMA交叉信号用于确认主要趋势方向并触发交易信号。当较短期EMA上穿较长期EMA,且较长时间框架处于上升趋势时,产生做多信号;当较短期EMA下穿较长期EMA,且较长时间框架处于下降趋势时,产生做空信号。
通过结合两个时间框架的趋势信息,该策略能够在趋势形成初期及时入场,并在趋势反转时及时出场,以捕捉市场的主要趋势。
优势分析
-
双时间框架趋势确认:该策略利用了不同时间框架的趋势信息,通过较短时间框架确认较长时间框架的趋势,有助于提高趋势判断的可靠性,减少错误信号。
-
趋势跟踪能力强:EMA指标具有良好的趋势跟踪能力,能够在趋势形成初期及时发出信号,帮助策略及时入场。
-
参数灵活可调:该策略的时间框架和EMA周期参数可根据市场特点和交易风格进行灵活调整,以适应不同的市场环境。
-
易于实现:该策略逻辑清晰,代码实现相对简单,易于理解和应用。
风险分析
-
参数优化风险:该策略的表现依赖于时间框架和EMA周期等参数的选择,不当的参数设置可能导致策略表现不佳。因此,需要对参数进行优化和测试,以确保策略在不同市场环境下的稳健表现。
-
震荡市风险:在震荡市场环境下,EMA交叉信号可能会频繁发生,导致策略产生多次误读信号而频繁交易,降低策略收益。可以通过引入其他过滤条件,如交易量、波动率等指标,来减少震荡市中的错误信号。
-
趋势反转风险:当市场趋势突然反转时,该策略可能会延迟出场,导致损失扩大。可以通过设置合适的止损条件,如固定百分比止损或移动止损,来控制单笔交易的最大损失。
优化方向
-
引入更多时间框架:在现有双时间框架的基础上,可以引入更多时间框架的EMA交叉信号,如日线、周线等,以进一步确认趋势方向,提高信号可靠性。
-
结合其他技术指标:可以将EMA交叉信号与其他技术指标相结合,如相对强弱指数(RSI)、平均真实范围(ATR)等,以提高信号质量和过滤效果。
-
优化入场和出场规则:可以对入场和出场规则进行优化,如在EMA交叉信号发生后,等待一定的确认期再入场;或者在出现反向信号时,设置一定的缓冲区再出场,以减少错误信号的影响。
-
动态调整参数:可以根据市场状态的变化,动态调整策略参数,如在趋势明显时,使用较长的EMA周期;在震荡市中,使用较短的EMA周期,以适应不同的市场环境。
总结
基于双时间框架EMA交叉信号的多空策略通过结合不同时间框架的趋势信息,利用较短时间框架确认较长时间框架的趋势,以捕捉市场的主要趋势。该策略具有趋势跟踪能力强、参数灵活可调、易于实现等优势,但同时也面临参数优化、震荡市和趋势反转等风险。通过引入更多时间框架、结合其他技术指标、优化入场和出场规则、动态调整参数等方式,可以进一步提升该策略的表现和稳健性。在实际应用中,需要根据具体的市场特点和交易风格,对策略进行适当的优化和调整,以获得更好的交易结果。
||
Overview
This strategy is based on the crossover signals of exponential moving averages (EMAs) on two different timeframes for long and short trading. When the shorter-timeframe EMA crosses above the longer-timeframe EMA, it generates a long signal; when the shorter-timeframe EMA crosses below the longer-timeframe EMA, it generates a short signal. The strategy utilizes trend information from different timeframes, confirming the trend of the longer timeframe with the shorter timeframe, to capture the main market trend.
Strategy Principles
The strategy uses EMA crossover signals on two different timeframes to capture market trends:
-
The EMA crossover signal on the longer timeframe (default: 2 hours) is used to determine the main trend direction. When the short-term EMA (default: 5 periods) crosses above the long-term EMA (default: 20 periods), it indicates an uptrend; conversely, it indicates a downtrend.
-
The EMA crossover signal on the shorter timeframe (default: 3 minutes) is used to confirm the main trend direction and trigger trading signals. When the short-term EMA crosses above the long-term EMA and the longer timeframe is in an uptrend, it generates a long signal; when the short-term EMA crosses below the long-term EMA and the longer timeframe is in a downtrend, it generates a short signal.
By combining trend information from two timeframes, the strategy can enter the market in the early stages of a trend and exit in a timely manner when the trend reverses, capturing the main market trend.
Advantage Analysis
-
Dual-timeframe trend confirmation: The strategy utilizes trend information from different timeframes, confirming the trend of the longer timeframe with the shorter timeframe, which helps improve the reliability of trend judgment and reduce false signals.
-
Strong trend-following ability: The EMA indicator has a good trend-following ability and can generate timely signals in the early stages of a trend, helping the strategy enter the market promptly.
-
Flexible parameter adjustment: The timeframe and EMA period parameters of the strategy can be flexibly adjusted according to market characteristics and trading styles to adapt to different market environments.
-
Easy to implement: The strategy logic is clear, and the code implementation is relatively simple, making it easy to understand and apply.
Risk Analysis
-
Parameter optimization risk: The performance of the strategy depends on the choice of parameters such as timeframes and EMA periods. Improper parameter settings may lead to poor strategy performance. Therefore, it is necessary to optimize and test the parameters to ensure robust performance of the strategy in different market environments.
-
Choppy market risk: In choppy market conditions, EMA crossover signals may occur frequently, causing the strategy to generate multiple false signals and frequent trades, reducing strategy profitability. Other filtering conditions, such as trading volume and volatility indicators, can be introduced to reduce false signals in choppy markets.
-
Trend reversal risk: When the market trend suddenly reverses, the strategy may delay exiting positions, leading to increased losses. Appropriate stop-loss conditions, such as fixed percentage stop-loss or trailing stop-loss, can be set to control the maximum loss of a single trade.
Optimization Directions
-
Introduce more timeframes: Based on the existing dual-timeframe approach, more timeframes can be introduced for EMA crossover signals, such as daily and weekly timeframes, to further confirm the trend direction and improve signal reliability.
-
Combine with other technical indicators: EMA crossover signals can be combined with other technical indicators, such as the Relative Strength Index (RSI) and Average True Range (ATR), to improve signal quality and filtering effects.
-
Optimize entry and exit rules: Entry and exit rules can be optimized. For example, after an EMA crossover signal occurs, wait for a certain confirmation period before entering a position; or set a certain buffer zone when an opposite signal appears before exiting a position, to reduce the impact of false signals.
-
Dynamic parameter adjustment: Strategy parameters can be dynamically adjusted according to changes in market conditions. For example, use longer EMA periods when the trend is clear, and use shorter EMA periods in choppy markets, to adapt to different market environments.
Summary
The dual-timeframe EMA crossover long-short strategy captures the main market trend by combining trend information from different timeframes, using the shorter timeframe to confirm the trend of the longer timeframe. The strategy has advantages such as strong trend-following ability, flexible parameter adjustment, and easy implementation. However, it also faces risks such as parameter optimization, choppy markets, and trend reversals. By introducing more timeframes, combining with other technical indicators, optimizing entry and exit rules, and dynamically adjusting parameters, the performance and robustness of the strategy can be further improved. In practical application, it is necessary to appropriately optimize and adjust the strategy according to specific market characteristics and trading styles to obtain better trading results.
[/trans]
Strategy Arguments
| Argument | Default | Description |
|---|---|---|
| v_input_timeframe_1 | 120 | Daha Uzun Zaman Dilimi |
| v_input_timeframe_2 | 3 | Daha Kısa Zaman Dilimi |
| v_input_int_1 | 5 | Kısa Vadeli EMA Periyodu |
| v_input_int_2 | 20 | Uzun Vadeli EMA Periyodu |
Source (PineScript)
/*backtest
start: 2023-03-16 00:00:00
end: 2024-03-21 00:00:00
period: 1d
basePeriod: 1h
exchanges: [{"eid":"Futures_Binance","currency":"BTC_USDT"}]
*/

//@version=5
strategy('EMA Crossover Multi-Timeframe Strategy', shorttitle='EMA Cross MTF', overlay=true)

// Kullanıcı girdileri
inputTimeframe1 = input.timeframe('120', title='Daha Uzun Zaman Dilimi')
inputTimeframe2 = input.timeframe('3', title='Daha Kısa Zaman Dilimi')
inputShortTermEma = input.int(5, title='Kısa Vadeli EMA Periyodu', minval=1)
inputLongTermEma = input.int(20, title='Uzun Vadeli EMA Periyodu', minval=1)

// EMA hesaplamaları
shortTermEma = ta.ema(close, inputShortTermEma)
longTermEma = ta.ema(close, inputLongTermEma)

// Daha uzun zaman dilimi için EMA crossover'larını kontrol et
longHourEma5 = request.security(syminfo.tickerid, inputTimeframe1, shortTermEma)
longHourEma20 = request.security(syminfo.tickerid, inputTimeframe1, longTermEma)
longHourCrossover = longHourEma5>longHourEma20 //ta.crossover(fourHourEma5, fourHourEma20)
longHourCrossunder = longHourEma5< longHourEma20//ta.crossunder(fourHourEma5, fourHourEma20)


// Daha kısa zaman dilimi için EMA crossover'larını kontrol et
shortMinuteEma5 = request.security(syminfo.tickerid, inputTimeframe2, shortTermEma)
shortMinuteEma20 = request.security(syminfo.tickerid, inputTimeframe2, longTermEma)
shortMinuteCrossover = ta.crossover(shortMinuteEma5, shortMinuteEma20)
shortMinuteCrossunder = ta.crossunder(shortMinuteEma5, shortMinuteEma20)

// Alım ve satım sinyalleri
longSignal = longHourCrossover and shortMinuteCrossover
shortSignal = longHourCrossunder and shortMinuteCrossunder

// Sinyalleri çiz
plotshape(series=longSignal, title='Al', location=location.belowbar, color=color.new(color.green, 0), style=shape.labelup, text='AL')
plotshape(series=shortSignal, title='Sat', location=location.abovebar, color=color.new(color.red, 0), style=shape.labeldown, text='SAT')

// Görselleştirme
plot(shortTermEma, "Kısa Vadeli EMA", color=color.rgb(154, 200, 238), linewidth=2)
plot(longTermEma, "Uzun Vadeli EMA", color=color.rgb(61, 32, 165), linewidth=2)

// Strateji
if (longSignal)
    strategy.entry("Long", strategy.long, comment="Long1")
   // strategy.exit("Exit Long", "Long", stop=longStopPrice, limit=longTargetPrice, comment="Exit Long1")
if (shortSignal)
    strategy.entry("Short", strategy.short, comment="Short1")
    //strategy.exit("Exit Short", "Short", stop=shortStopPrice, limit=shortTargetPrice, comment="Exit Short2")
Detail
https://www.fmz.com/strategy/445824
Last Modified
2024-03-22 15:01:39