
9.8 KiB
Name
基于双均线交叉RSI和随机指标的短线量化交易策略-Short-term-Quantitative-Trading-Strategy-Based-on-Dual-Moving-Average-Crossover-RSI-and-Stochastic-Indicators
Author
ChaoZhang
Strategy Description
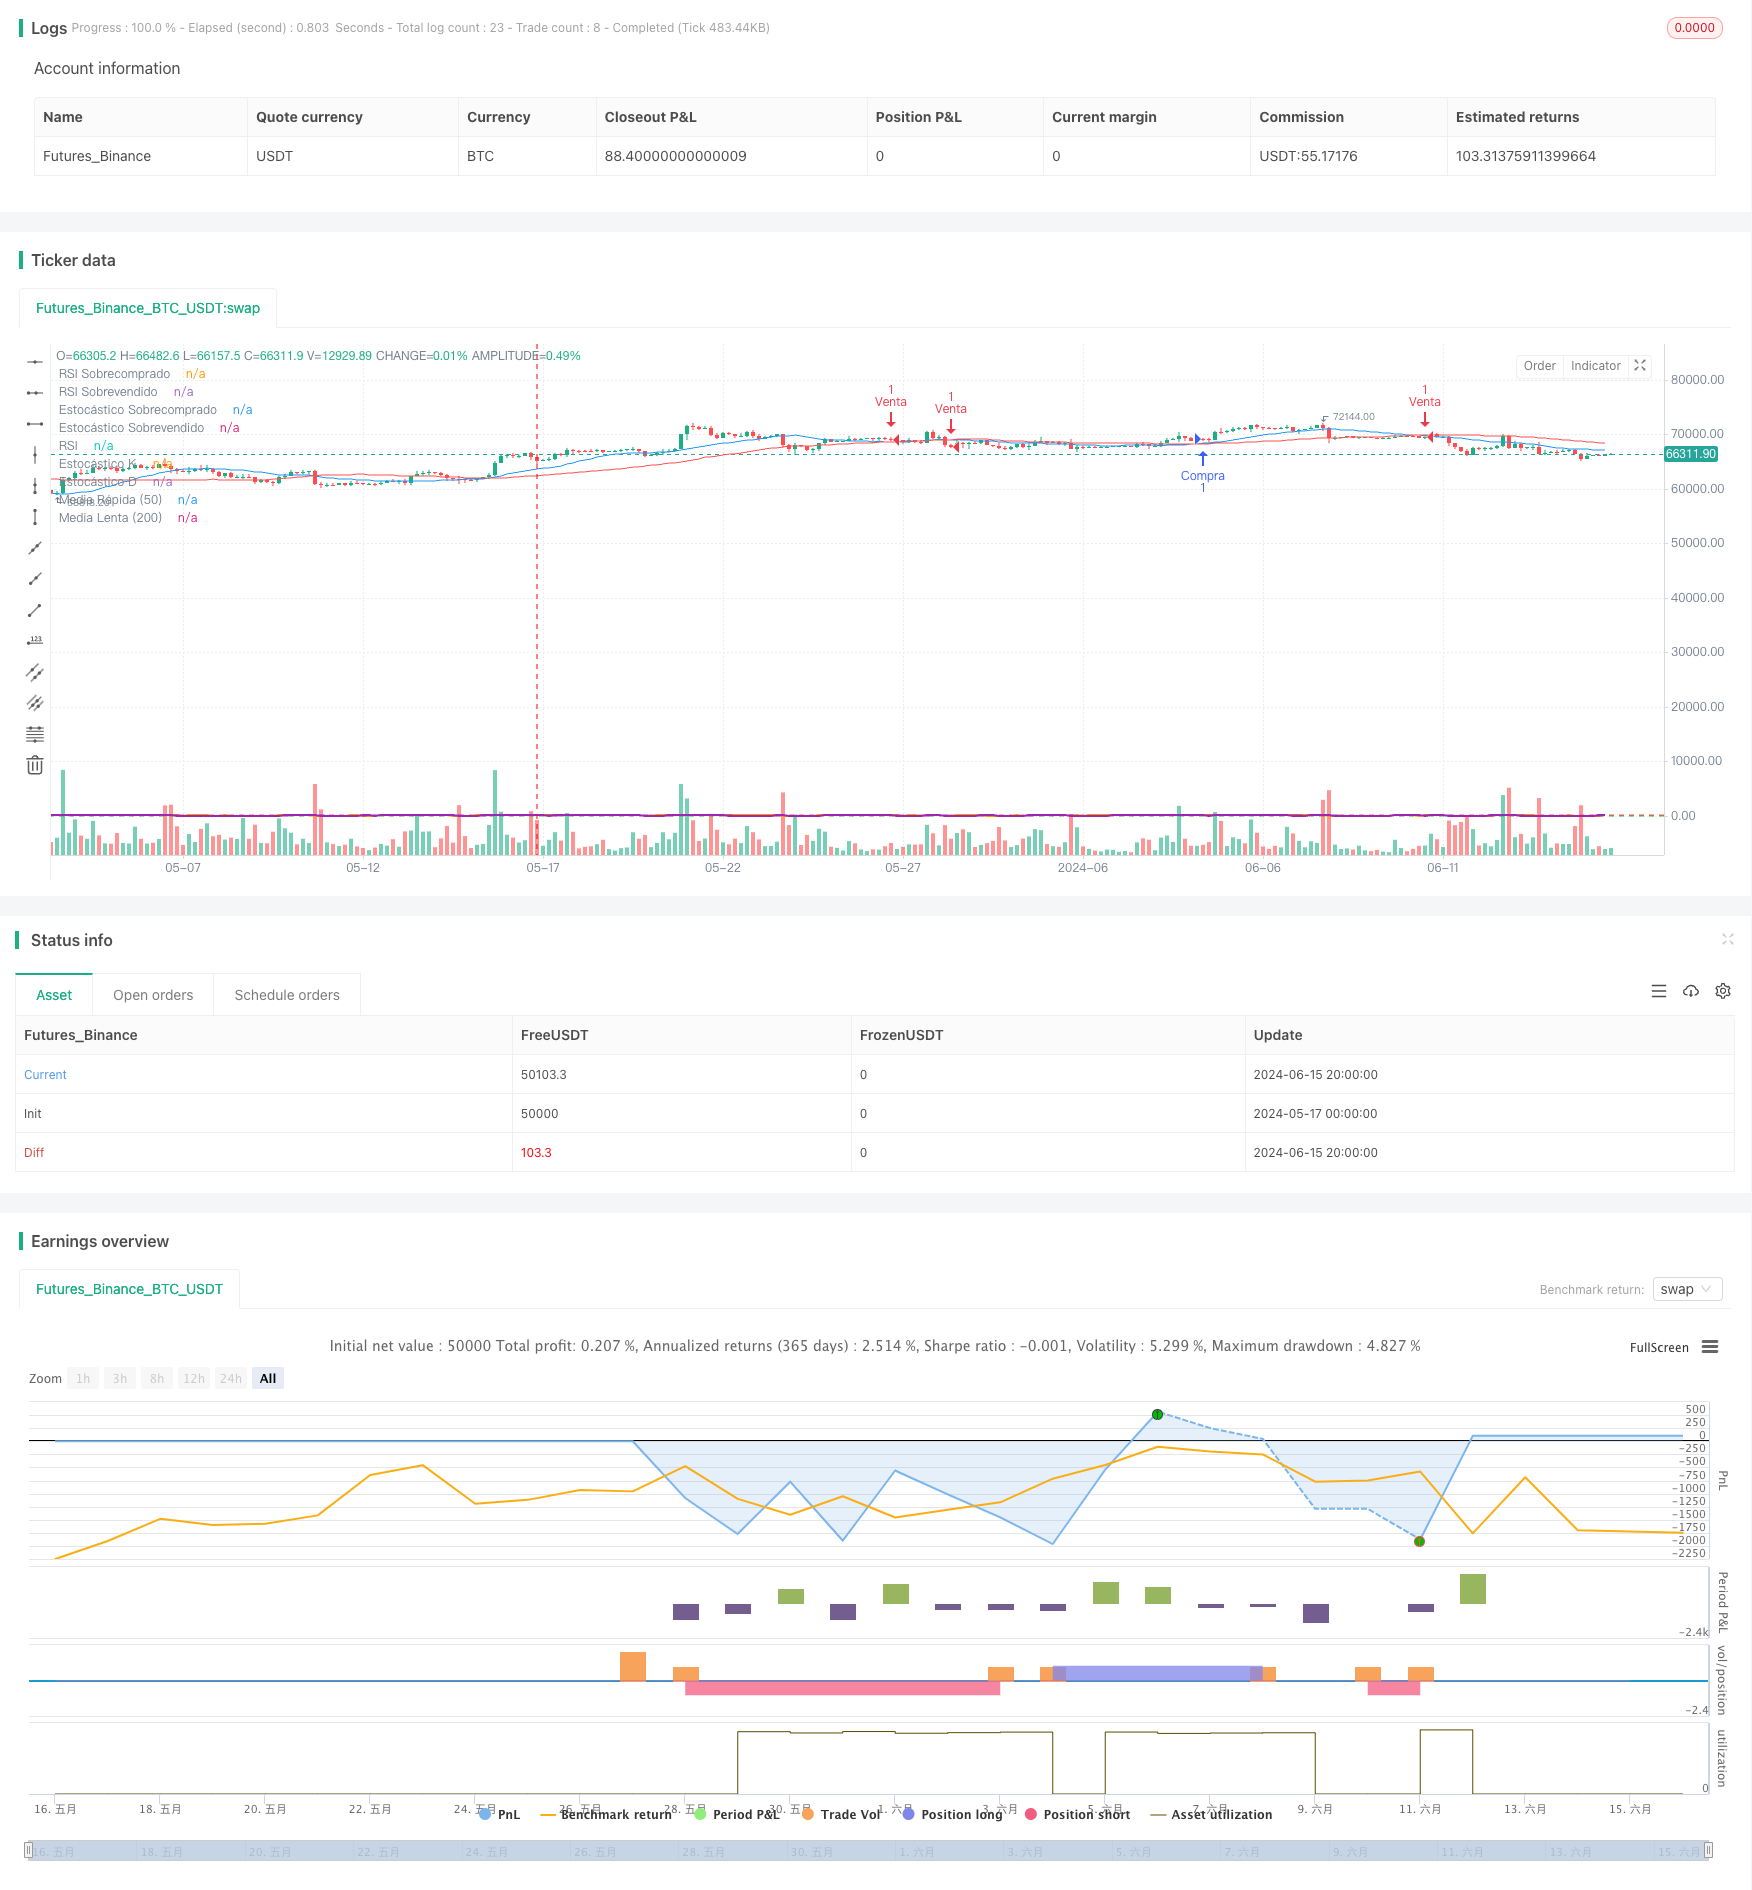
[trans]
概述
该策略结合了双均线交叉、RSI和随机指标,通过多个技术指标的共同确认,在短线交易中寻找高胜率的交易机会。策略使用20日和50日两条移动平均线的交叉作为主要交易信号,同时结合RSI和随机指标作为辅助判断,对交易信号进行二次确认。此外,该策略还采用了ATR作为止损和止盈的依据,以固定的风险收益比管理头寸,力求在控制风险的同时获取稳定收益。
策略原理
- 计算20日和50日两条移动平均线,当短期均线上穿长期均线时,产生做多信号;反之,产生做空信号。
- 引入RSI指标作为辅助判断,当RSI指标未达到超买或超卖区间时,才考虑建仓。
- 引入随机指标作为辅助判断,当随机指标K线未达到超买或超卖区间时,才考虑建仓。
- 使用ATR计算止损和止盈位置,按照1:2的风险收益比设置止损和止盈价位。
- 做多时,止损位置为最低价减去ATR,止盈位置为最高价加上2倍ATR;做空时,止损位置为最高价加上ATR,止盈位置为最低价减去2倍ATR。
策略优势
- 双均线交叉是一个简单易用的趋势判断指标,与RSI和随机指标的结合可以有效过滤假信号。
- RSI和随机指标可以帮助判断市场是否处于超买超卖状态,避免在极端行情下入场。
- 固定风险收益比的仓位管理方式,可以在控制整体风险的前提下,获得相对稳定的收益。
- 参数可调,适用于不同的市场环境和交易风格。
策略风险
- 趋势型策略在震荡市容易产生较多的假信号,导致频繁交易和资金损耗。
- 固定比例止损可能导致单次亏损过大,削弱资金曲线。
- 缺乏仓位管理和资金管理方面的考虑,难以应对极端行情。
策略优化方向
- 引入更多有效的技术指标,提高信号的准确性和可靠性。
- 优化止损止盈的设置方法,采用更加动态和智能的方式,提高策略收益水平。
- 在仓位管理方面,可以结合ATR等波动率指标,对仓位进行动态调整。
- 在资金管理方面,引入风险预算、凯利公式等方法,提高资金利用效率。
总结
该策略是一个基于双均线、RSI和随机指标的短线交易策略,通过多个技术指标的共同确认,在把握趋势性机会的同时,控制交易风险。策略逻辑清晰,参数易于优化,适合进行短线交易的投资者使用。但是,该策略也存在一些不足,如趋势把握能力有限,缺乏对仓位和资金的动态管理等。这些问题可以通过引入更多技术指标、优化信号和仓位管理等方式加以改进,以期进一步提高策略性能。
||
Overview
This strategy combines dual moving average crossover, RSI, and stochastic indicators to seek high-probability trading opportunities in short-term trading through the joint confirmation of multiple technical indicators. The strategy uses the crossover of 20-day and 50-day moving averages as the main trading signal, and incorporates RSI and stochastic indicators as auxiliary judgments to double-check the trading signals. In addition, the strategy also employs ATR as the basis for stop-loss and take-profit, managing positions with a fixed risk-reward ratio, striving to obtain stable returns while controlling risks.
Strategy Principles
- Calculate the 20-day and 50-day moving averages. When the short-term average crosses above the long-term average, it generates a long signal; conversely, it generates a short signal.
- Introduce the RSI indicator as an auxiliary judgment, only considering establishing positions when the RSI indicator has not reached the overbought or oversold range.
- Introduce the stochastic indicator as an auxiliary judgment, only considering establishing positions when the stochastic indicator's K line has not reached the overbought or oversold range.
- Use ATR to calculate stop-loss and take-profit levels, setting stop-loss and take-profit prices according to a 1:2 risk-reward ratio.
- When going long, the stop-loss level is the lowest price minus ATR, and the take-profit level is the highest price plus 2 times ATR; when going short, the stop-loss level is the highest price plus ATR, and the take-profit level is the lowest price minus 2 times ATR.
Strategy Advantages
- The dual moving average crossover is a simple and easy-to-use trend judgment indicator, and its combination with RSI and stochastic indicators can effectively filter out false signals.
- RSI and stochastic indicators can help determine whether the market is in an overbought or oversold state, avoiding entering positions in extreme market conditions.
- The position management method with a fixed risk-reward ratio can obtain relatively stable returns under the premise of controlling overall risks.
- Parameters are adjustable and suitable for different market environments and trading styles.
Strategy Risks
- Trend-following strategies are prone to generating more false signals in volatile markets, leading to frequent trading and capital losses.
- Fixed-ratio stop-loss may lead to excessive single losses, weakening the equity curve.
- Lack of consideration in position management and capital management makes it difficult to cope with extreme market conditions.
Strategy Optimization Directions
- Introduce more effective technical indicators to improve the accuracy and reliability of signals.
- Optimize the setting method of stop-loss and take-profit, adopting more dynamic and intelligent methods to increase the strategy's profitability.
- In terms of position management, dynamic adjustments to positions can be made in conjunction with volatility indicators such as ATR.
- In terms of capital management, methods such as risk budgeting and the Kelly formula can be introduced to improve capital utilization efficiency.
Summary
This strategy is a short-term trading strategy based on dual moving averages, RSI, and stochastic indicators. It controls trading risks while grasping trend opportunities through the joint confirmation of multiple technical indicators. The strategy logic is clear, parameters are easy to optimize, and it is suitable for investors engaged in short-term trading. However, the strategy also has some shortcomings, such as limited trend-grasping ability and lack of dynamic management of positions and capital. These problems can be improved by introducing more technical indicators, optimizing signals and position management, etc., in order to further enhance the strategy's performance. [/trans]
Source (PineScript)
/*backtest
start: 2024-05-17 00:00:00
end: 2024-06-16 00:00:00
period: 4h
basePeriod: 15m
exchanges: [{"eid":"Futures_Binance","currency":"BTC_USDT"}]
*/

//@version=5
strategy("Cruce de Medias con Filtros de RSI y Estocástico", overlay=true)

// Definir parámetros de las medias móviles
fast_length = input(20, title="Periodo de Media Rápida")
slow_length = input(50, title="Periodo de Media Lenta")

// Calcular medias móviles
fast_ma = ta.sma(close, fast_length)
slow_ma = ta.sma(close, slow_length)

// Añadir filtro RSI
rsi_length = input(7, title="Periodo del RSI")
rsi = ta.rsi(close, rsi_length)
rsi_overbought = input(70, title="RSI Sobrecomprado")
rsi_oversold = input(30, title="RSI Sobrevendido")

// Añadir filtro Estocástico
k_period = input(7, title="K Periodo del Estocástico")
d_period = input(3, title="D Periodo del Estocástico")
smooth_k = input(3, title="Suavización del Estocástico")
stoch_k = ta.sma(ta.stoch(close, high, low, k_period), smooth_k)
stoch_d = ta.sma(stoch_k, d_period)
stoch_overbought = input(80, title="Estocástico Sobrecomprado")
stoch_oversold = input(20, title="Estocástico Sobrevendido")

// Definir niveles de stop-loss y take-profit con ratio 2:1
risk = input(1, title="Riesgo en ATR")
reward_ratio = input(2, title="Ratio Riesgo/Beneficio")
atr_length = input(14, title="Periodo del ATR")
atr = ta.atr(atr_length)
stop_loss = risk * atr
take_profit = reward_ratio * stop_loss

// Señal de compra
long_condition = ta.crossover(fast_ma, slow_ma) and rsi < rsi_overbought and stoch_k < stoch_overbought
if (long_condition)
    strategy.entry("Compra", strategy.long)

// Señal de venta
short_condition = ta.crossunder(fast_ma, slow_ma) and rsi > rsi_oversold and stoch_k > stoch_oversold
if (short_condition)
    strategy.entry("Venta", strategy.short)

// Configurar Stop-Loss y Take-Profit para posiciones largas
if (strategy.position_size > 0)
    strategy.exit("Take Profit/Stop Loss", from_entry="Compra", stop=low - stop_loss, limit=high + take_profit)

// Configurar Stop-Loss y Take-Profit para posiciones cortas
if (strategy.position_size < 0)
    strategy.exit("Take Profit/Stop Loss", from_entry="Venta", stop=high + stop_loss, limit=low - take_profit)

// Plotear las medias móviles en el gráfico
plot(fast_ma, title="Media Rápida (50)", color=color.blue)
plot(slow_ma, title="Media Lenta (200)", color=color.red)

// Plotear RSI y Estocástico en subgráficos
hline(rsi_overbought, "RSI Sobrecomprado", color=color.red)
hline(rsi_oversold, "RSI Sobrevendido", color=color.green)
plot(rsi, title="RSI", color=color.orange, linewidth=2)
hline(stoch_overbought, "Estocástico Sobrecomprado", color=color.red)
hline(stoch_oversold, "Estocástico Sobrevendido", color=color.green)
plot(stoch_k, title="Estocástico K", color=color.purple, linewidth=2)
plot(stoch_d, title="Estocástico D", color=color.purple, linewidth=1, style=plot.style_stepline)
Detail
https://www.fmz.com/strategy/454352
Last Modified
2024-06-17 15:35:40