
18 KiB
Name
基于双均线交叉和多时间周期DMI指标的趋势策略Trend-Following-Strategy-Based-on-Dual-Moving-Average-Crossover-and-Multi-Timeframe-DMI-Indicator
Author
ChaoZhang
Strategy Description
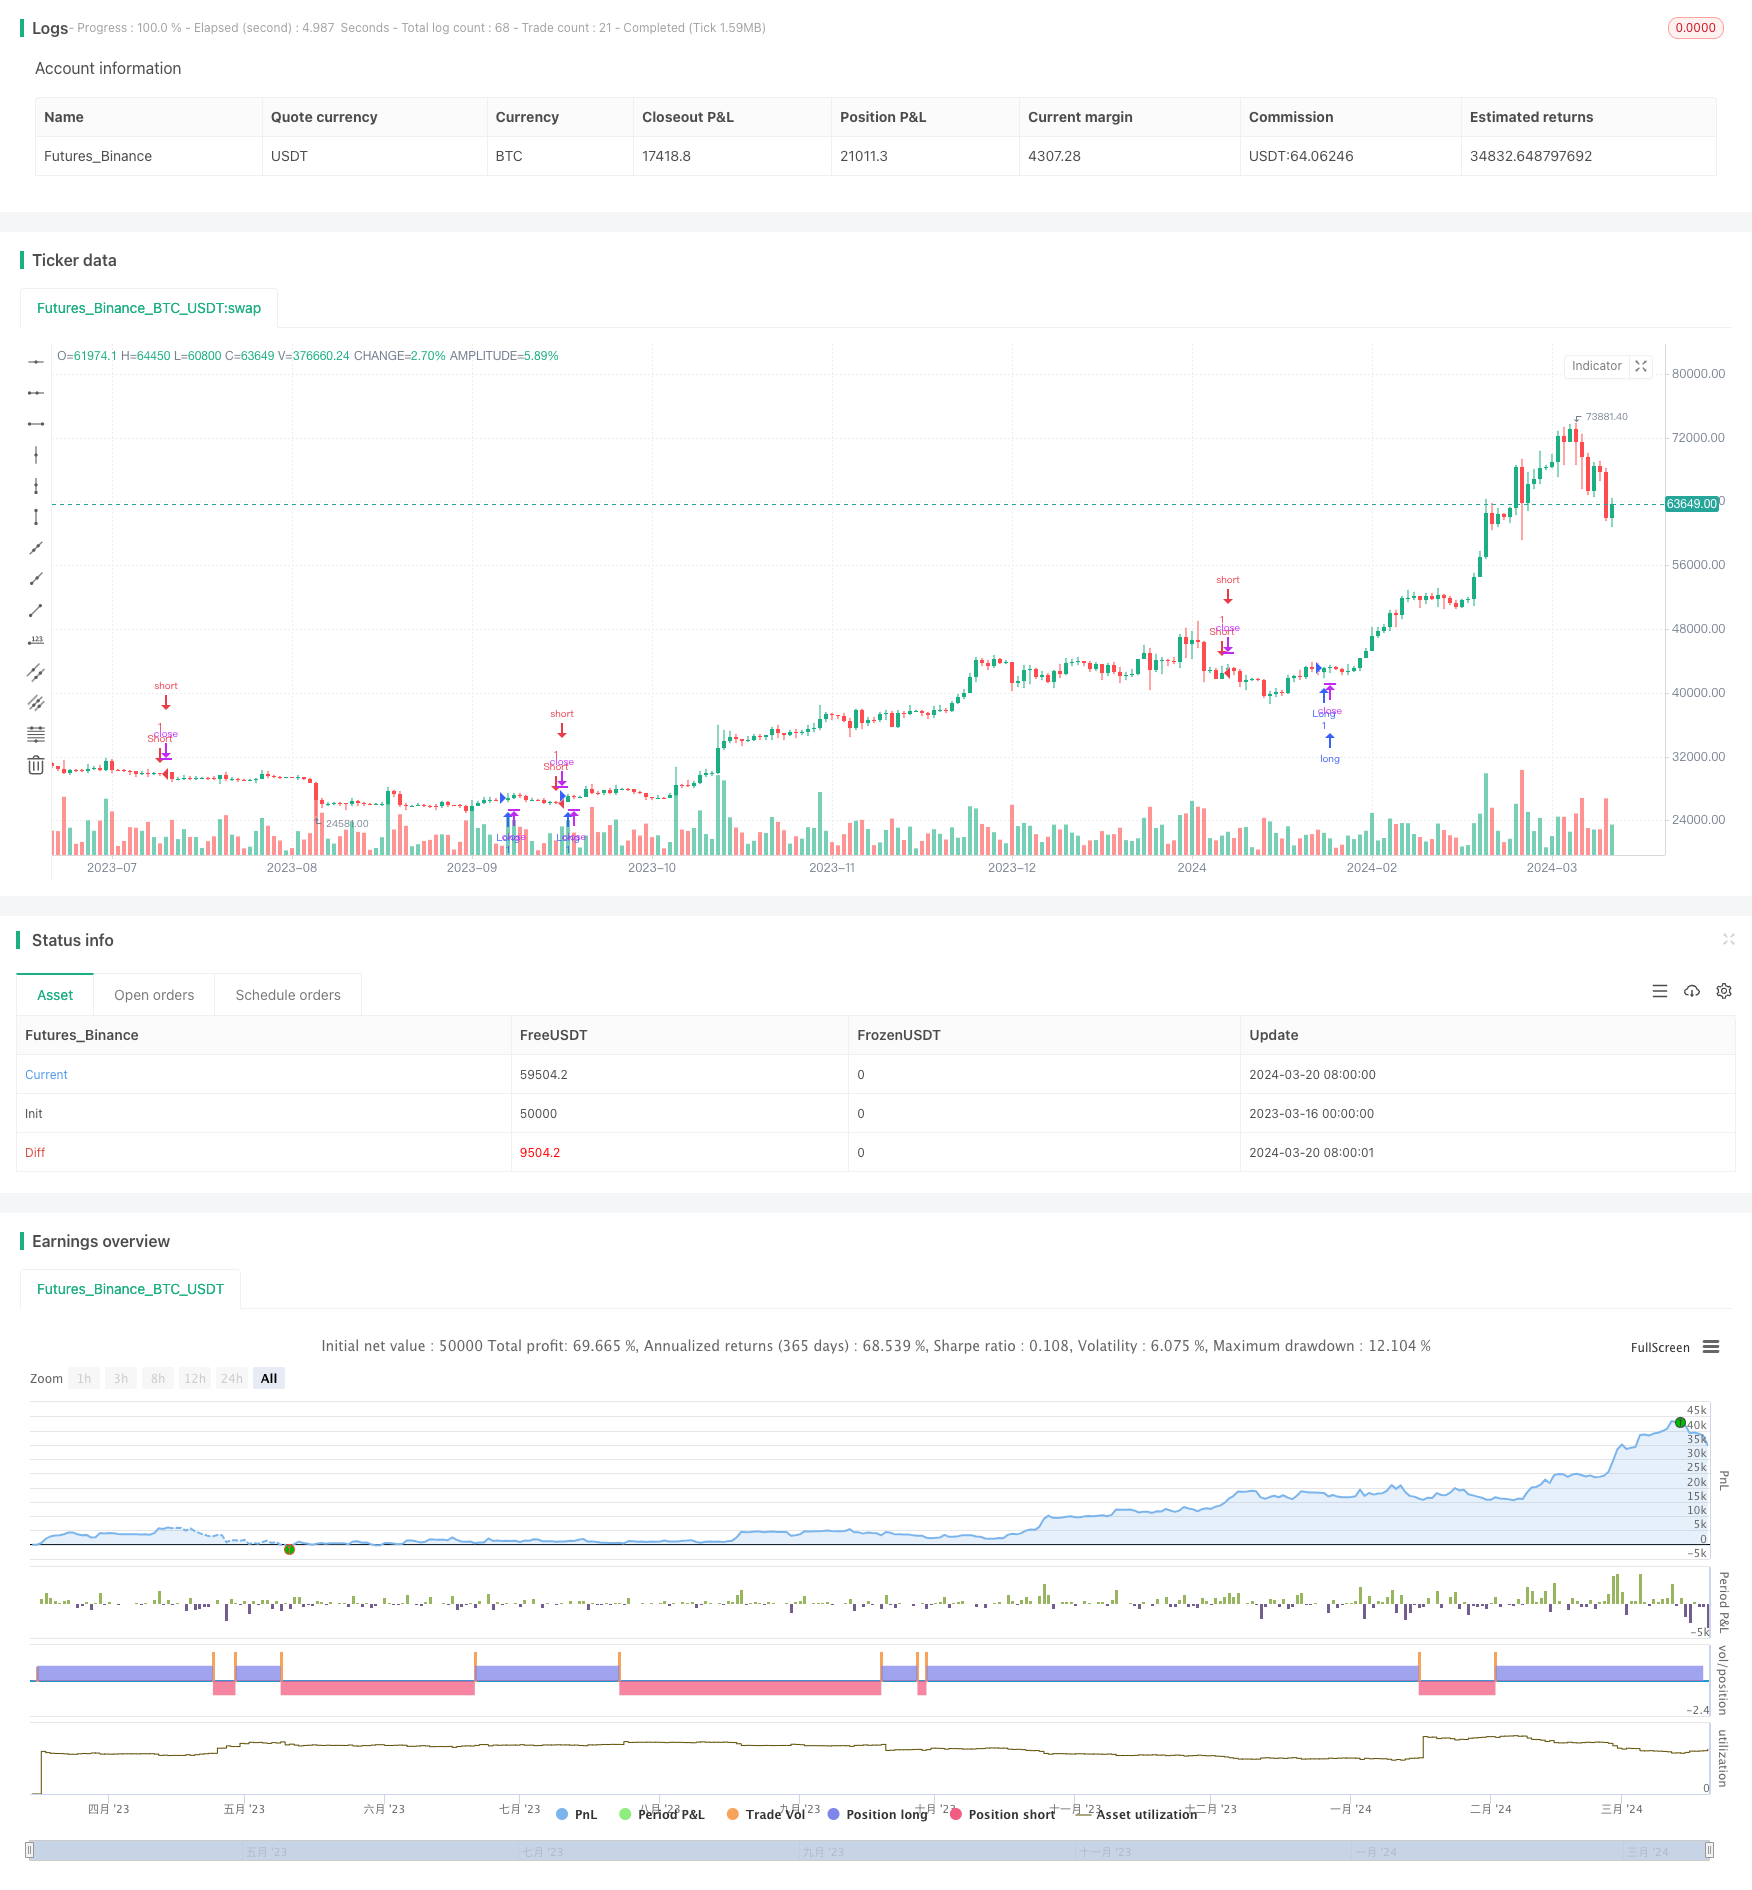 [trans]
策略概述
本文介绍了一个名为"Kyrie Crossover @zaytrade"的量化交易策略。该策略结合了双均线交叉和多时间周期DMI指标,通过捕捉市场趋势来进行交易决策。策略的核心是利用短期均线(10周期EMA)和长期均线(323周期EMA)的交叉信号,同时结合5分钟、15分钟、30分钟和1小时等多个时间周期的DMI指标来确认趋势的方向和强度。
策略原理
该策略的原理可以分为以下几个部分:
-
双均线交叉: 策略使用短期EMA(10周期)和长期EMA(323周期)来捕捉市场趋势。当短期EMA上穿长期EMA时,表示潜在的做多机会;当短期EMA下穿长期EMA时,表示潜在的做空机会。这种均线交叉的方法可以有效地识别市场的转折点和趋势方向。
-
多时间周期DMI指标: 为了进一步确认趋势的方向和强度,策略采用了多时间周期的DMI指标。DMI指标由ADX(平均方向性指数)、+DI(上升方向指标)和-DI(下降方向指标)组成。通过比较+DI和-DI的相对强度,可以判断当前趋势是看涨还是看跌。策略在5分钟、15分钟、30分钟和1小时等多个时间周期上计算DMI指标,以获得更全面的趋势信息。
-
趋势确认: 策略通过综合考虑均线交叉信号和多时间周期DMI指标来确认趋势。当均线交叉信号与DMI指标的趋势方向一致时,策略会产生相应的交易信号。例如,当短期EMA上穿长期EMA,并且多个时间周期的DMI指标都显示看涨趋势时,策略会产生做多信号。
-
风险管理: 策略采用了基于风险百分比的头寸管理方法。用户可以通过设置
riskPercentageEMA参数来控制每笔交易的风险敞口。此外,策略还利用止损单来限制潜在损失。
策略优势
-
捕捉市场趋势: 通过结合双均线交叉和多时间周期DMI指标,策略能够有效地捕捉市场的主要趋势。这种方法可以帮助交易者顺应市场的大方向,提高交易成功的概率。
-
多时间周期确认: 策略在多个时间周期上计算DMI指标,包括5分钟、15分钟、30分钟和1小时。这种多时间周期的分析方法可以提供更全面和可靠的趋势确认信号,减少假信号的出现。
-
灵活的参数设置: 策略提供了多个可调整的参数,如短期EMA周期、长期EMA周期、ADX平滑周期和DI长度等。用户可以根据自己的交易风格和市场特点来优化这些参数,以获得更好的交易表现。
-
风险管理: 策略内置了基于风险百分比的头寸管理方法,用户可以通过设置
riskPercentageEMA参数来控制每笔交易的风险敞口。此外,策略还利用止损单来限制潜在损失,提高了风险管理的效果。
策略风险
-
参数优化: 策略的性能在很大程度上取决于参数的选择。不当的参数设置可能导致策略表现不佳,甚至产生较大的回撤。因此,在实际应用中,需要对参数进行优化和测试,以找到适合当前市场条件的最佳参数组合。
-
趋势延迟: 由于策略依赖于均线交叉和DMI指标来确认趋势,在市场快速变化的情况下,信号的产生可能会有一定的延迟。这意味着策略可能错过一些早期的趋势机会,或者在趋势已经反转时才产生信号。
-
震荡市场: 在震荡市场中,价格的波动可能导致频繁的均线交叉和DMI指标的变化。这可能导致策略产生较多的交易信号,增加交易成本和回撤风险。因此,在震荡市场中,策略的表现可能会受到影响。
-
黑天鹅事件: 策略基于历史数据和统计模型,对于一些极端的市场事件,如黑天鹅事件,策略可能无法及时作出正确的反应。这可能导致策略在这些特殊情况下遭受较大损失。
优化方向
-
动态参数调整: 可以考虑引入动态参数调整机制,根据市场的波动性和趋势强度来自适应地调整策略参数。这可以帮助策略更好地适应不同的市场环境,提高策略的稳健性。
-
多因子确认: 除了均线交叉和DMI指标,可以引入其他技术指标或基本面因子来进一步确认趋势。例如,可以结合成交量、波动率、市场情绪等指标,以获得更可靠的交易信号。
-
止盈止损优化: 可以对止盈止损的位置进行优化,例如采用移动止损、动态止损等方法。这可以帮助策略更好地保护利润,同时限制潜在损失。
-
仓位管理: 可以引入更高级的仓位管理方法,如凯利公式、固定比例投资等。这可以帮助策略在不同的市场环境中动态调整仓位,提高资金利用效率和风险控制能力。
-
机器学习优化: 可以尝试将机器学习算法与该策略相结合,通过对历史数据的学习和模式识别,优化策略的参数选择和信号生成。这可以帮助策略自动适应市场的变化,提高策略的适应性和稳健性。
总结
本文介绍了一个基于双均线交叉和多时间周期DMI指标的量化交易策略。该策略通过捕捉市场趋势来进行交易决策,同时采用了风险管理措施来控制潜在损失。策略的优势在于能够有效地识别市场的主要趋势,并通过多时间周期的确认来提高信号的可靠性。然而,策略也存在一些风险,如参数优化、趋势延迟、震荡市场和黑天鹅事件等。为了进一步优化策略,可以考虑引入动态参数调整、多因子确认、止盈止损优化、仓位管理和机器学习等方法。总的来说,该策略为量化交易者提供了一种基于趋势跟踪的交易思路,通过合理的优化和改进,有望在实际交易中取得良好的表现。
||
Strategy Overview
This article introduces a quantitative trading strategy named "Kyrie Crossover @zaytrade". The strategy combines dual moving average crossover and multi-timeframe DMI indicator to capture market trends for trading decisions. The core of the strategy is to utilize the crossover signals of a short-term moving average (10-period EMA) and a long-term moving average (323-period EMA), while confirming the trend direction and strength using DMI indicators across multiple timeframes such as 5-minute, 15-minute, 30-minute, and 1-hour.
Strategy Principles
The principles of this strategy can be divided into the following parts:
-
Dual Moving Average Crossover: The strategy uses a short-term EMA (10-period) and a long-term EMA (323-period) to capture market trends. When the short-term EMA crosses above the long-term EMA, it indicates a potential long opportunity; when the short-term EMA crosses below the long-term EMA, it indicates a potential short opportunity. This moving average crossover method can effectively identify market turning points and trend directions.
-
Multi-Timeframe DMI Indicator: To further confirm the trend direction and strength, the strategy employs DMI indicators across multiple timeframes. The DMI indicator consists of ADX (Average Directional Index), +DI (Positive Directional Indicator), and -DI (Negative Directional Indicator). By comparing the relative strength of +DI and -DI, it can be determined whether the current trend is bullish or bearish. The strategy calculates DMI indicators on 5-minute, 15-minute, 30-minute, and 1-hour timeframes to obtain more comprehensive trend information.
-
Trend Confirmation: The strategy confirms the trend by comprehensively considering the moving average crossover signals and multi-timeframe DMI indicators. When the moving average crossover signal aligns with the trend direction indicated by the DMI indicators, the strategy generates corresponding trading signals. For example, when the short-term EMA crosses above the long-term EMA, and multiple timeframes of DMI indicators show a bullish trend, the strategy generates a long signal.
-
Risk Management: The strategy employs a risk percentage-based position sizing method. Users can control the risk exposure of each trade by setting the
riskPercentageEMAparameter. Additionally, the strategy utilizes stop-loss orders to limit potential losses.
Strategy Advantages
-
Trend Capturing: By combining dual moving average crossover and multi-timeframe DMI indicators, the strategy can effectively capture the main trends in the market. This approach helps traders align with the market's overall direction, increasing the probability of successful trades.
-
Multi-Timeframe Confirmation: The strategy calculates DMI indicators on multiple timeframes, including 5-minute, 15-minute, 30-minute, and 1-hour. This multi-timeframe analysis approach provides more comprehensive and reliable trend confirmation signals, reducing the occurrence of false signals.
-
Flexible Parameter Settings: The strategy offers various adjustable parameters, such as short-term EMA period, long-term EMA period, ADX smoothing period, and DI length. Users can optimize these parameters based on their trading style and market characteristics to achieve better trading performance.
-
Risk Management: The strategy incorporates a risk percentage-based position sizing method, allowing users to control the risk exposure of each trade by setting the
riskPercentageEMAparameter. Moreover, the strategy utilizes stop-loss orders to limit potential losses, enhancing risk management effectiveness.
Strategy Risks
-
Parameter Optimization: The performance of the strategy largely depends on the choice of parameters. Improper parameter settings may lead to suboptimal strategy performance or even significant drawdowns. Therefore, in practical application, it is necessary to optimize and test the parameters to find the best parameter combination suitable for the current market conditions.
-
Trend Delay: As the strategy relies on moving average crossovers and DMI indicators to confirm trends, there may be a certain delay in signal generation during rapidly changing market conditions. This means that the strategy may miss some early trend opportunities or generate signals after the trend has already reversed.
-
Choppy Markets: In choppy markets, price fluctuations may lead to frequent moving average crossovers and changes in DMI indicators. This can result in the strategy generating more trading signals, increasing trading costs and drawdown risks. Therefore, the strategy's performance may be affected in choppy market conditions.
-
Black Swan Events: The strategy is based on historical data and statistical models. For extreme market events, such as black swan events, the strategy may not be able to react correctly in a timely manner. This can lead to significant losses for the strategy in these special circumstances.
Optimization Directions
-
Dynamic Parameter Adjustment: Consider introducing a dynamic parameter adjustment mechanism that adaptively adjusts strategy parameters based on market volatility and trend strength. This can help the strategy better adapt to different market environments and improve its robustness.
-
Multi-Factor Confirmation: In addition to moving average crossovers and DMI indicators, other technical indicators or fundamental factors can be introduced to further confirm trends. For example, combining volume, volatility, market sentiment, and other indicators can provide more reliable trading signals.
-
Stop-Loss and Take-Profit Optimization: Optimize the placement of stop-loss and take-profit levels, such as using trailing stops or dynamic stop-loss methods. This can help the strategy better protect profits while limiting potential losses.
-
Position Sizing: Introduce more advanced position sizing methods, such as the Kelly Criterion or fixed fractional investing. This can help the strategy dynamically adjust positions in different market environments, improving capital utilization efficiency and risk control capabilities.
-
Machine Learning Optimization: Attempt to combine machine learning algorithms with the strategy. Through learning and pattern recognition of historical data, optimize the strategy's parameter selection and signal generation. This can help the strategy automatically adapt to market changes, enhancing its adaptability and robustness.
Conclusion
This article introduced a quantitative trading strategy based on dual moving average crossover and multi-timeframe DMI indicator. The strategy makes trading decisions by capturing market trends while employing risk management measures to control potential losses. The strategy's advantages lie in its ability to effectively identify the main trends in the market and improve signal reliability through multi-timeframe confirmation. However, the strategy also has certain risks, such as parameter optimization, trend delay, choppy markets, and black swan events. To further optimize the strategy, methods such as dynamic parameter adjustment, multi-factor confirmation, stop-loss and take-profit optimization, position sizing, and machine learning can be considered. Overall, this strategy provides quantitative traders with a trend-following trading approach. With reasonable optimization and improvement, it has the potential to achieve good performance in actual trading.
[/trans]
Strategy Arguments
| Argument | Default | Description |
|---|---|---|
| v_input_int_1 | 9 | Short-Term EMA Period |
| v_input_int_2 | 21 | Long-Term EMA Period |
| v_input_float_1 | true | Risk Percentage EMA |
| v_input_1 | 14 | ADX Smoothing |
| v_input_2 | 14 | DI Length |
Source (PineScript)
/*backtest
start: 2023-03-16 00:00:00
end: 2024-03-21 00:00:00
period: 1d
basePeriod: 1h
exchanges: [{"eid":"Futures_Binance","currency":"BTC_USDT"}]
*/

//@version=5
strategy("Kyrie Crossover @zaytrade ", overlay=true, calc_on_every_tick=true)

// Input parameters for EMA
shortTermEMA = input.int(9, title="Short-Term EMA Period")
longTermEMA = input.int(21, title="Long-Term EMA Period")
riskPercentageEMA = input.float(1, title="Risk Percentage EMA", minval=0.1, maxval=5, step=0.1)

// Calculate EMAs
emaShort = ta.ema(close, shortTermEMA)
emaLong = ta.ema(close, longTermEMA)

// EMA Crossover Strategy
longConditionEMA = ta.crossover(emaShort, emaLong)
shortConditionEMA = ta.crossunder(emaShort, emaLong)

// Input parameters for DMI
adxlen = input(14, title="ADX Smoothing")
dilen = input(14, title="DI Length")

// DMI Logic
dirmov(len) =>
    up = ta.change(high)
    down = -ta.change(low)
    truerange = ta.tr
    plus = fixnan(100 * ta.rma((up > down ? up : 0), len) / truerange)
    minus = fixnan(100 * ta.rma((down > up ? down : 0), len) / truerange)
    [plus, minus]

adx(dilen, adxlen) =>
    [plus, minus] = dirmov(dilen)
    sum = plus + minus
    adxValue = 100 * ta.rma(math.abs(plus - minus) / (sum == 0 ? 1 : sum), adxlen)
    [adxValue, plus, minus]

// Function to get trend and strength for a given timeframe
getTrendAndStrength(_source, _dilen, _adxlen) =>
    [adxValue, up, down] = adx(_dilen, _adxlen)
    var string trendIndication = ""
    var string trendStrength = ""
    if (up > down) or ((up > down) and (up > down) and (up > adxValue)) // Bullish condition
        trendIndication := "Bullish"
        trendStrength := "Strengthening"
    else if (down > up) or ((down > up) and (down > up) and (down > adxValue)) // Bearish condition
        trendIndication := "Bearish"
        trendStrength := "Weakening"
    else
        trendIndication := "No Clear Trend"
        trendStrength := "Sideways"
    [trendIndication, trendStrength]

// Get trend and strength for selected timeframes
[tf1_trend, tf1_strength] = request.security(syminfo.tickerid, "5", getTrendAndStrength(close, dilen, adxlen))
[tf2_trend, tf2_strength] = request.security(syminfo.tickerid, "15", getTrendAndStrength(close, dilen, adxlen))
[tf3_trend, tf3_strength] = request.security(syminfo.tickerid, "30", getTrendAndStrength(close, dilen, adxlen))
[tf4_trend, tf4_strength] = request.security(syminfo.tickerid, "60", getTrendAndStrength(close, dilen, adxlen))
[current_trend, _] = getTrendAndStrength(close, dilen, adxlen)

// Define colors based on trend indication
tf1_color = tf1_trend == "Bullish" ? color.green : (tf1_trend == "Bearish" ? color.red : color.white)
tf2_color = tf2_trend == "Bullish" ? color.green : (tf2_trend == "Bearish" ? color.red : color.white)
tf3_color = tf3_trend == "Bullish" ? color.green : (tf3_trend == "Bearish" ? color.red : color.white)
tf4_color = tf4_trend == "Bullish" ? color.green : (tf4_trend == "Bearish" ? color.red : color.white)
current_color = current_trend == "Bullish" ? color.green : (current_trend == "Bearish" ? color.red : color.white)

// Create and fill the enhanced table for DMI
var table dmiTable = na
if (barstate.islast)
    dmiTable := table.new(position.top_right, 6, 1)
    table.cell(dmiTable, 0, 0, "DMI Metrics", bgcolor=color.new(color.black, 90), width=15, height=4, text_color=color.white)
    table.cell(dmiTable, 1, 0, "5m Trend: " + tf1_trend, bgcolor=tf1_color, width=15, height=4, text_color=color.white)
    table.cell(dmiTable, 2, 0, "15m Trend: " + tf2_trend, bgcolor=tf2_color, width=15, height=4, text_color=color.white)
    table.cell(dmiTable, 3, 0, "30m Trend: " + tf3_trend, bgcolor=tf3_color, width=15, height=4, text_color=color.white)
    table.cell(dmiTable, 4, 0, "1h Trend: " + tf4_trend, bgcolor=tf4_color, width=15, height=4, text_color=color.white)
    table.cell(dmiTable, 5, 0, "Current Trend: " + current_trend, bgcolor=current_color, width=15, height=4, text_color=color.white)

// Strategy logic
if (longConditionEMA)
    strategy.entry("Long", strategy.long)
if (shortConditionEMA)
    strategy.entry("Short", strategy.short)
Detail
https://www.fmz.com/strategy/445813
Last Modified
2024-03-22 14:23:30