
8.2 KiB
Name
基于历史Delta-SMA高低点的交易趋势捕捉策略-Delta-SMA-Historical-High-Low-Based-Trend-Capture-Strategy
Author
ChaoZhang
Strategy Description
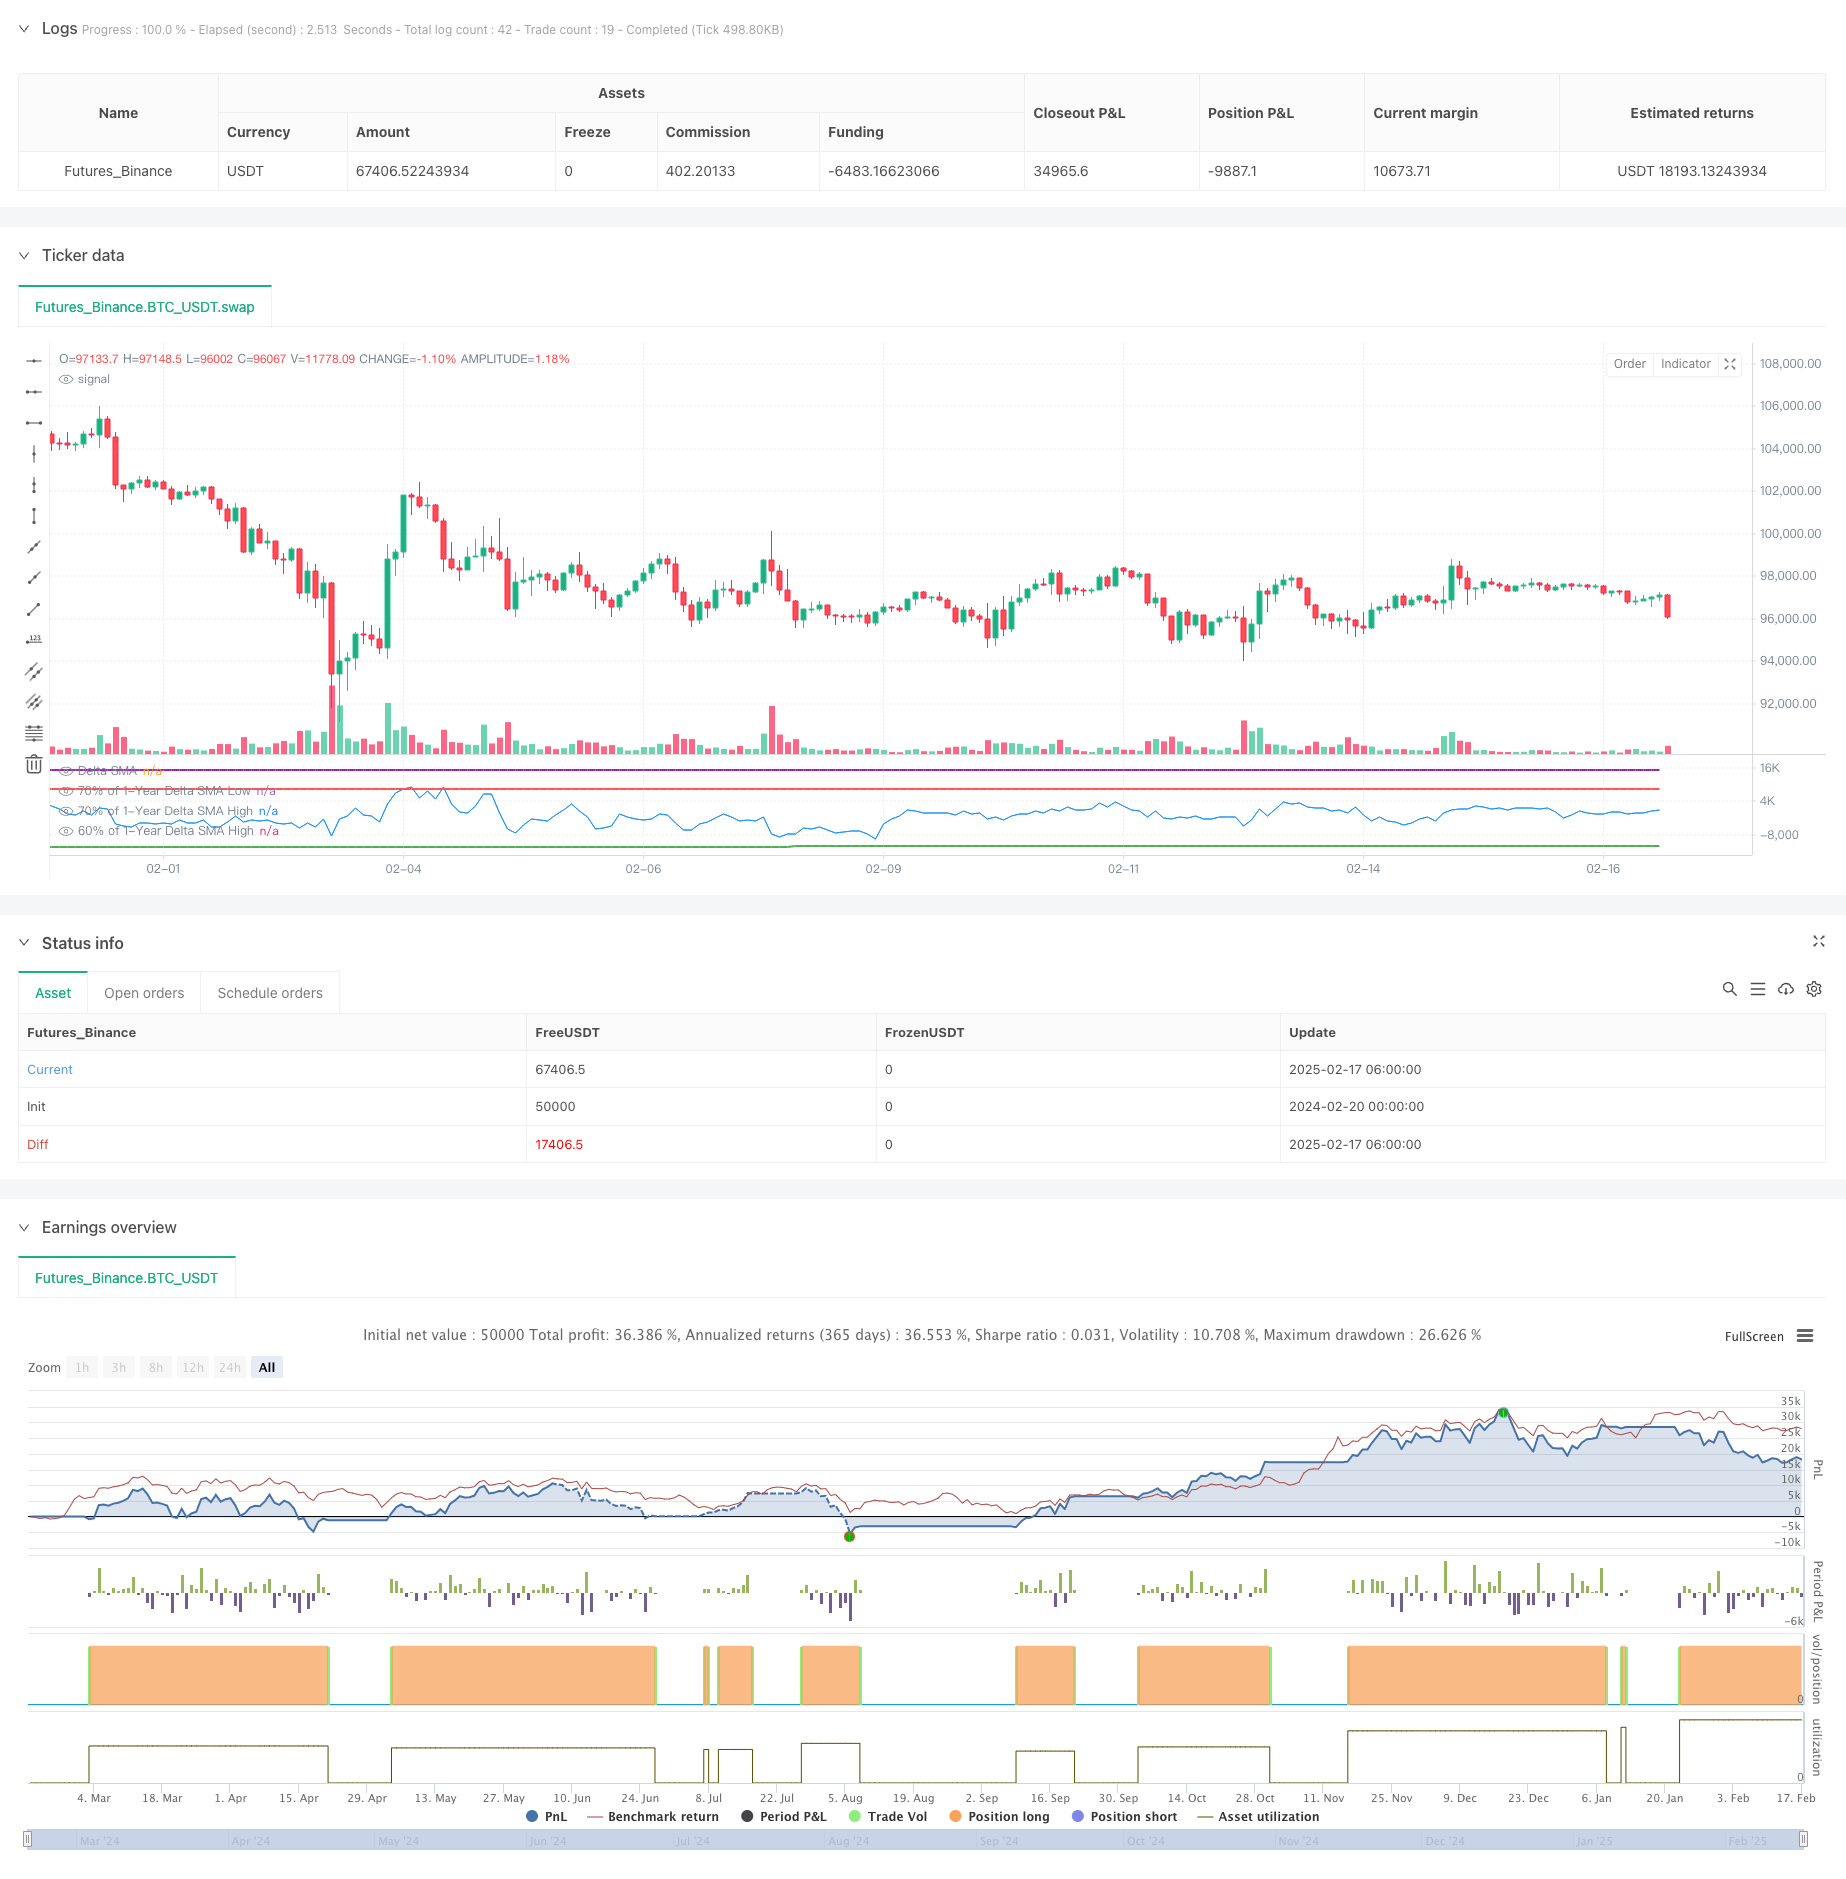
[trans]
概述
这是一个基于买卖量Delta值的SMA(简单移动平均线)在一年期间高低点分析的交易策略。该策略通过计算买卖量差值的移动平均线,并将其与历史高低点阈值进行比较来识别潜在的交易信号。策略采用长期的回溯期,适合中长期趋势交易。
策略原理
策略的核心逻辑基于以下几个关键步骤:
- Delta计算: 通过分析价格走势计算买卖量差值。当收盘价高于开盘价时记录为买入量,反之为卖出量。
- SMA平滑处理: 对Delta值进行14周期的移动平均处理,以减少噪声。
- 一年期高低点确定: 计算Delta SMA在过去一年的最高值和最低值。
- 信号触发条件:
- 买入信号: 当Delta SMA在低于一年低点70%后突破0时触发
- 卖出信号: 当Delta SMA突破一年高点90%后,跌破60%时触发
策略优势
- 长期趋势把握能力强: 通过一年期的历史数据分析,能够有效捕捉主要趋势。
- 噪声过滤效果好: 采用SMA平滑处理和多重阈值条件,有效降低假信号。
- 风险控制合理: 设置了明确的入场和出场条件,避免过度交易。
- 适应性强: 策略参数可根据不同市场条件进行调整。
策略风险
- 滞后性风险: 由于使用SMA和长期回溯期,可能导致信号滞后。
- 假突破风险: 在震荡市场中可能产生错误信号。
- 市场环境依赖: 在趋势不明显的市场中表现可能不佳。
- 参数敏感性: 阈值设置对策略性能影响较大。
策略优化方向
- 动态阈值调整: 可根据市场波动性动态调整高低点阈值。
- 增加辅助指标: 结合其他技术指标提高信号可靠性。
- 引入止损机制: 设置动态止损以控制风险。
- 市场环境筛选: 添加市场环境判断逻辑,在适合的环境下运行策略。
总结
这是一个基于成交量分析的中长期趋势跟踪策略,通过分析买卖量差值的历史高低点来捕捉市场趋势。策略设计合理,风险控制到位,但需要注意市场环境的适应性和参数优化问题。通过提出的优化方向,策略还有进一步提升的空间。 ||
Overview
This is a trading strategy based on analyzing the historical highs and lows of the Delta SMA (Simple Moving Average) of buy/sell volumes over a one-year period. The strategy identifies potential trading signals by comparing the Delta SMA with historical threshold values. It employs a long-term lookback period, making it suitable for medium to long-term trend trading.
Strategy Principles
The core logic of the strategy is based on the following key steps:
- Delta Calculation: Calculate the difference between buy and sell volumes based on price movement. Volume is recorded as buy volume when closing price is above opening price, and vice versa.
- SMA Smoothing: Apply a 14-period moving average to the Delta value to reduce noise.
- One-Year High/Low Determination: Calculate the highest and lowest values of Delta SMA over the past year.
- Signal Trigger Conditions:
- Buy Signal: Triggered when Delta SMA crosses above 0 after falling below 70% of the yearly low
- Sell Signal: Triggered when Delta SMA falls below 60% after crossing above 90% of the yearly high
Strategy Advantages
- Strong Long-term Trend Capture: Effectively captures major trends through one-year historical data analysis.
- Excellent Noise Filtering: Uses SMA smoothing and multiple threshold conditions to effectively reduce false signals.
- Reasonable Risk Control: Sets clear entry and exit conditions to avoid overtrading.
- High Adaptability: Strategy parameters can be adjusted for different market conditions.
Strategy Risks
- Lag Risk: Use of SMA and long lookback period may lead to delayed signals.
- False Breakout Risk: May generate false signals in ranging markets.
- Market Environment Dependency: May underperform in markets without clear trends.
- Parameter Sensitivity: Threshold settings significantly impact strategy performance.
Strategy Optimization Directions
- Dynamic Threshold Adjustment: Dynamically adjust high/low thresholds based on market volatility.
- Additional Indicators: Incorporate other technical indicators to improve signal reliability.
- Stop-Loss Implementation: Implement dynamic stop-loss mechanisms for risk control.
- Market Environment Filtering: Add market environment assessment logic to run the strategy in suitable conditions.
Summary
This is a medium to long-term trend following strategy based on volume analysis, capturing market trends by analyzing historical highs and lows of buy/sell volume differences. The strategy is well-designed with proper risk control, but attention needs to be paid to market environment adaptability and parameter optimization. Through the proposed optimization directions, there is room for further strategy improvement.[/trans]
Source (PineScript)
/*backtest
start: 2024-02-20 00:00:00
end: 2025-02-17 08:00:00
period: 2h
basePeriod: 2h
exchanges: [{"eid":"Futures_Binance","currency":"BTC_USDT"}]
*/

//@version=5
strategy("Delta SMA 1-Year High/Low Strategy", overlay = false, margin_long = 100, margin_short = 100)

// Inputs
delta_sma_length = input.int(14, title="Delta SMA Length", minval=1)  // SMA length for Delta
lookback_days = 365  // Lookback period fixed to 1 year

// Function to calculate buy and sell volume
buy_volume = close > open ? volume : na
sell_volume = close < open ? volume : na

// Calculate the Delta
delta = nz(buy_volume, 0) - nz(sell_volume, 0)

// Calculate Delta SMA
delta_sma = ta.sma(delta, delta_sma_length)

// Lookback period in bars (1 bar = 1 day)
desired_lookback_bars = lookback_days

// Ensure lookback doesn't exceed available historical data
max_lookback_bars = math.min(desired_lookback_bars, 365)  // Cap at 365 bars (1 year)

// Calculate Delta SMA low and high within the valid lookback period
delta_sma_low_1yr = ta.lowest(delta_sma, max_lookback_bars)
delta_sma_high_1yr = ta.highest(delta_sma, max_lookback_bars)

// Define thresholds for buy and sell conditions
very_low_threshold = delta_sma_low_1yr * 0.7
above_70_threshold = delta_sma_high_1yr * 0.9
below_60_threshold = delta_sma_high_1yr * 0.5

// Track if `delta_sma` was very low and persist the state
var bool was_very_low = false
if delta_sma < very_low_threshold
    was_very_low := true
if ta.crossover(delta_sma, 10000)
    was_very_low := false  // Reset after crossing 0

// Track if `delta_sma` crossed above 70% of the high
var bool crossed_above_70 = false
if ta.crossover(delta_sma, above_70_threshold)
    crossed_above_70 := true
if delta_sma < below_60_threshold*0.5 and crossed_above_70
    crossed_above_70 := false  // Reset after triggering sell

// Buy condition: `delta_sma` was very low and now crosses 0
buy_condition = was_very_low and ta.crossover(delta_sma, 0)

// Sell condition: `delta_sma` crossed above 70% of the high and now drops below 60%
sell_condition = crossed_above_70 and delta_sma < below_60_threshold

// Place a long order when buy condition is met
if buy_condition
    strategy.entry("Buy", strategy.long)

// Place a short order when sell condition is met
if sell_condition
    strategy.close("Buy")

// Plot Delta SMA and thresholds for visualization
plot(delta_sma, color=color.blue, title="Delta SMA")
plot(very_low_threshold, color=color.green, title="70% of 1-Year Delta SMA Low", linewidth=2)
plot(above_70_threshold, color=color.purple, title="70% of 1-Year Delta SMA High", linewidth=2)
plot(below_60_threshold, color=color.red, title="60% of 1-Year Delta SMA High", linewidth=2)

// Optional: Plot Buy and Sell signals on the chart
//plotshape(series=buy_condition, title="Buy Signal", location=location.belowbar, color=color.new(color.green, 0), style=shape.labelup, text="BUY")
//plotshape(series=sell_condition, title="Sell Signal", location=location.abovebar, color=color.new(color.red, 0), style=shape.labeldown, text="SELL")
Detail
https://www.fmz.com/strategy/482588
Last Modified
2025-02-19 10:47:50