
6.1 KiB
Name
基于历史数据的动态支撑阻力策略Dynamic-Support-and-Resistance-Strategy-Based-on-Historical-Data
Author
ChaoZhang
Strategy Description
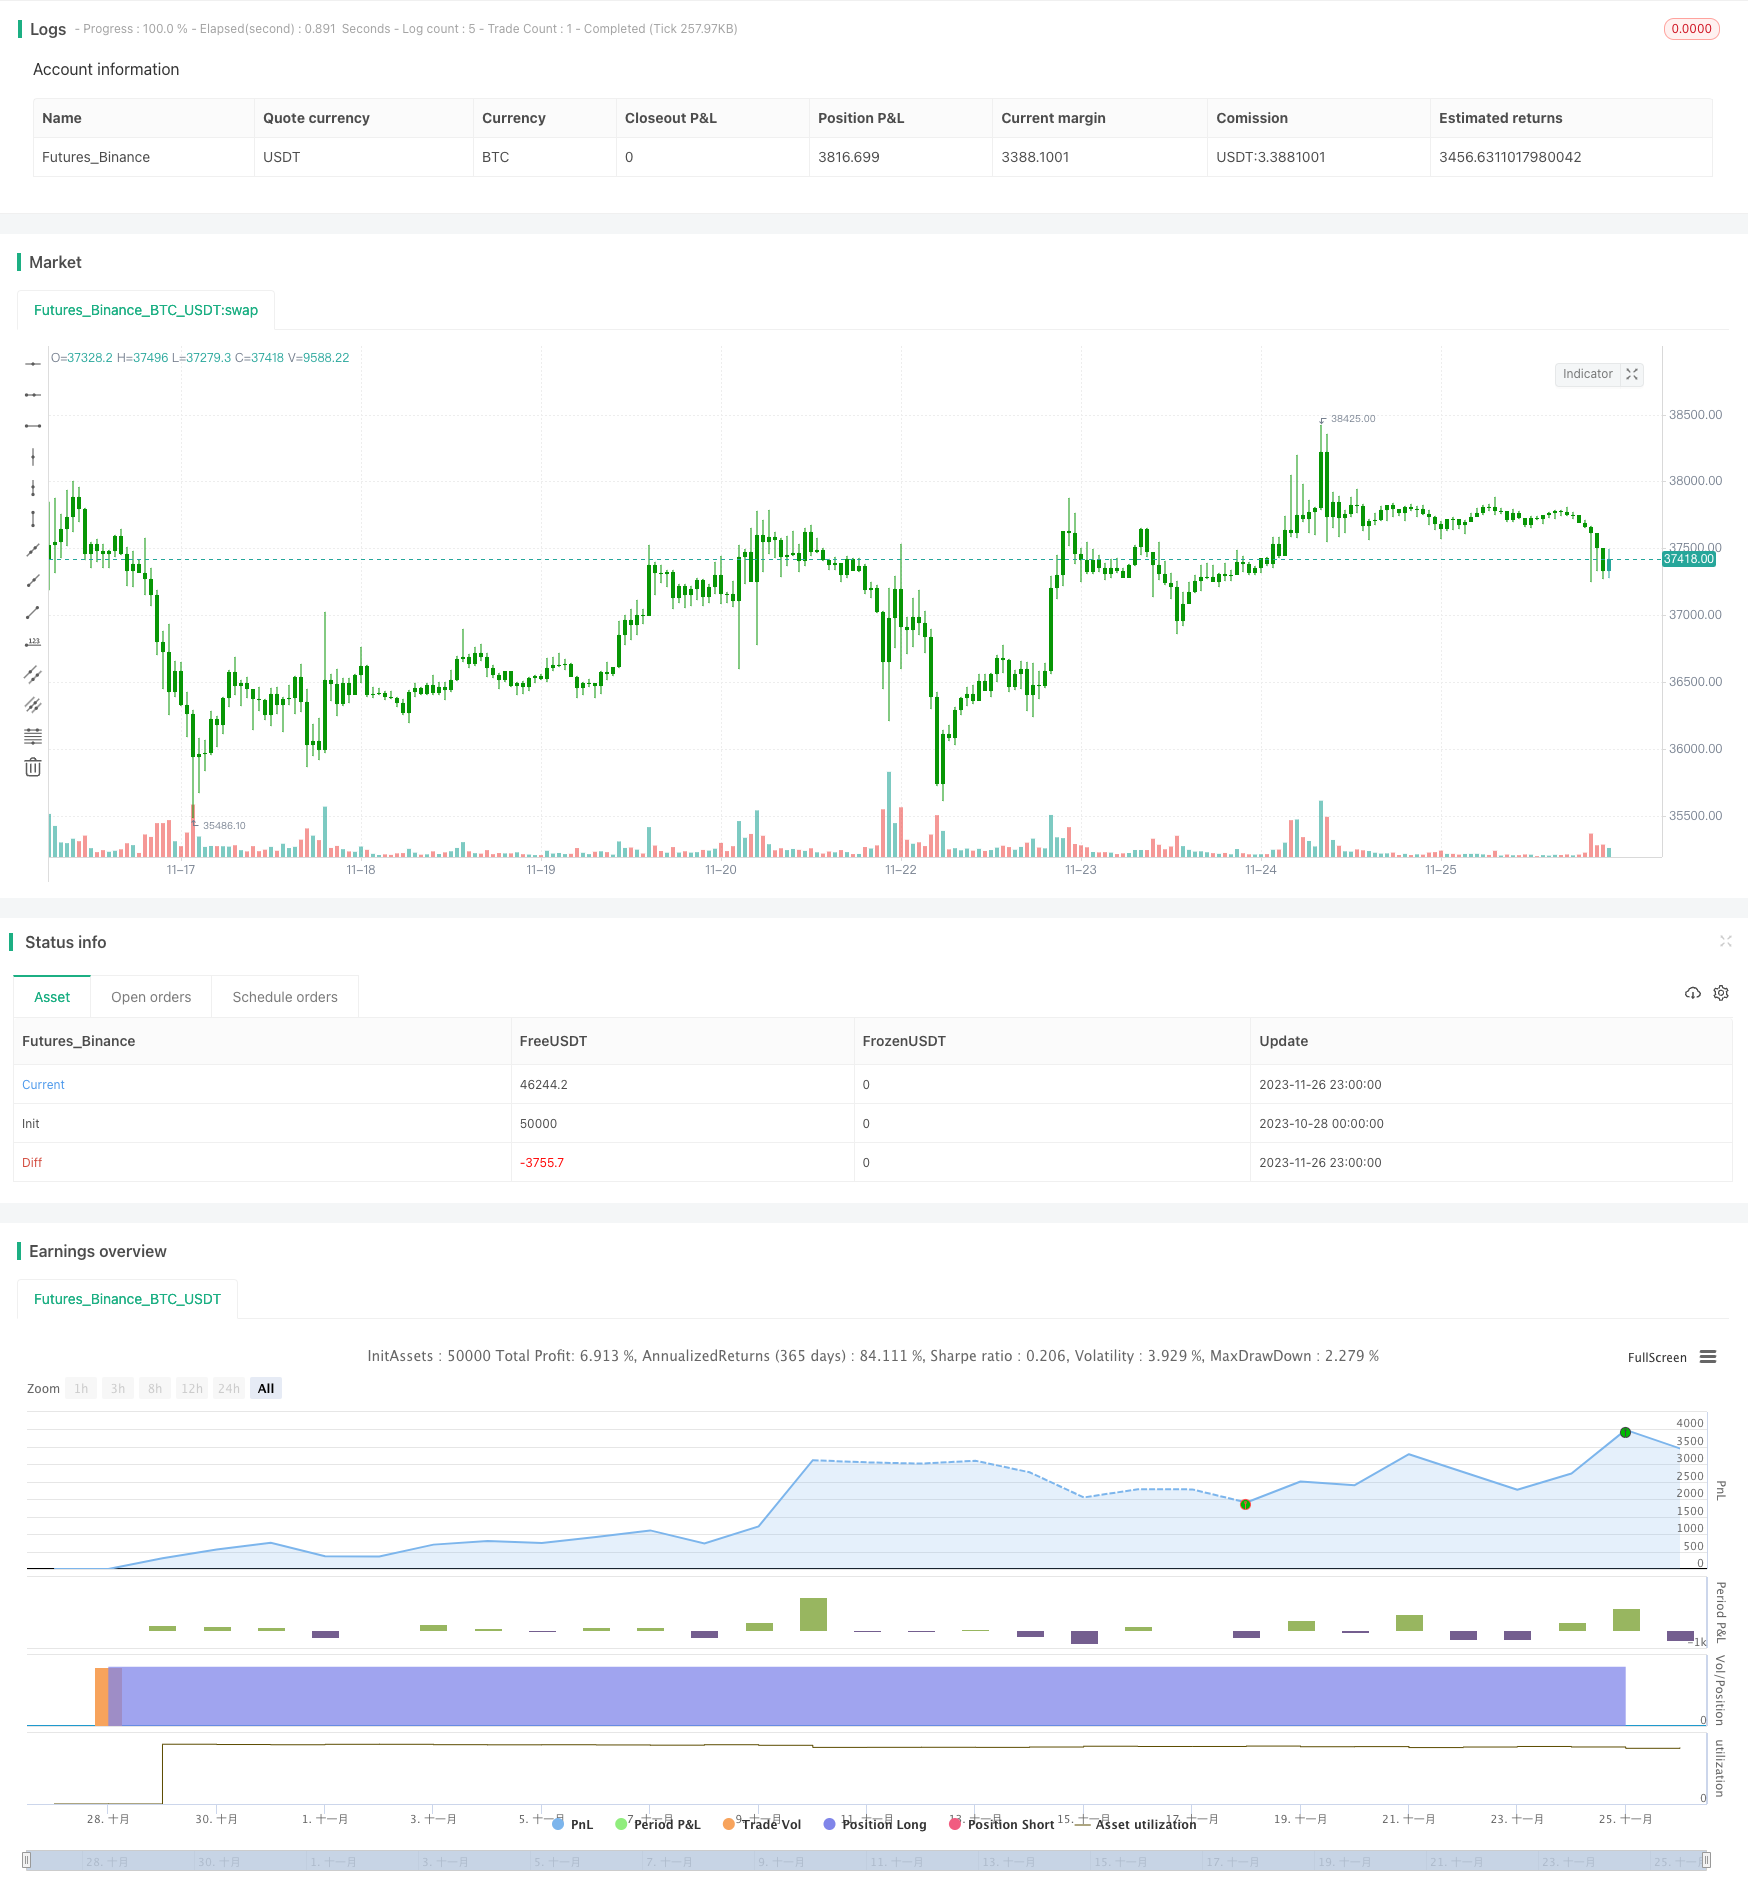 [trans]
概述
本策略基于历史高点、低点和收盘价的动态计算,得到支撑阻力位,并以此进行交易信号生成。该策略适用于中长线持仓,可以有效利用市场中的支撑阻力进行获利。
策略原理
-
计算上一周期的最高价、最低价和收盘价的平均值,得到基准点PP。
-
计算3条支撑线:S1 = 2PP - 最高价;S2 = PP - (R1-S1); S3 = 最低价 - 2(最高价-PP)。
-
计算3条阻力线:R1 = 2PP - 最低价;R2 = PP + (R1-S1); R3 = 最高价 + 2(PP-最低价)。
-
当价格上穿阻力线时,做多;当价格下穿支撑线时,做空。
优势分析
-
基于历史数据计算的支撑阻力位变化动态,能够实时捕捉市场结构。
-
多层级的支撑阻力设定,可以进行风险管理优化。
-
简单直观的交易信号和止损方式。
风险分析
-
在高波动行情中,历史数据提供的参考价位可能会失效。
-
多空仓位之间的切换需要考虑交易成本。
-
需要确保数据质量,避免计算错误。
优化方向
-
可以考虑引入更多历史数据的参考,如百日线等。
-
优化仓位管理,如基于波动率调整仓位比例。
-
增加止损策略,如跟踪止损或资金管理止损。
总结
本策略基于历史支撑阻力概念,提供多层级的参考价位。策略简单直接,适合中长线持仓获利。同时也需要注意高波动市场的风险,以及交易成本的控制。通过进一步优化,可以使策略在复杂环境中依然稳定运行。
||
Overview
This strategy dynamically calculates support and resistance levels based on historical high, low and close prices, and generates trading signals accordingly. It is suitable for medium-to-long-term positions and can effectively utilize support and resistance levels in the market for profit.
Strategy Logic
-
Calculate the average of previous period's high, low and close prices as the pivot point (PP).
-
Calculate 3 support lines: S1 = 2PP - highest price; S2 = PP - (R1-S1); S3 = lowest price - 2(highest price - PP).
-
Calculate 3 resistance lines: R1 = 2PP - lowest price; R2 = PP + (R1-S1); R3 = highest price + 2(PP - lowest price).
-
Take long position when price breaks through resistance lines, take short position when price breaks through support lines.
Advantage Analysis
-
The dynamic support and resistance levels based on historical data can capture market structure changes timely.
-
The multi-layer support and resistance settings allow better risk management optimization.
-
Simple and intuitive trading signals and stop loss mechanism.
Risk Analysis
-
The reference price levels provided by historical data may become invalid in high volatility scenarios.
-
The switching between long and short positions should consider trading cost.
-
Data quality needs to ensured to avoid calculation errors.
Optimization Directions
-
Consider incorporating more historical data references like 100-day moving average etc.
-
Optimize position sizing, e.g. adjust position size based on volatility.
-
Add stop loss strategies like trailing stop loss or risk-based stop loss.
Summary
This strategy provides multi-layer support and resistance reference price levels based on history. It has simple and straightforward logic suitable for medium-to-long-term positions. Meanwhile, risks under high volatility market and trading costs should be monitored. Further optimizations can make the strategy robust under complex environments.
[/trans]
Strategy Arguments
| Argument | Default | Description |
|---|---|---|
| v_input_1 | D | Resolution |
| v_input_2 | 0 | Sell from : R1 |
| v_input_3 | 0 | Buy from : S1 |
| v_input_4 | true | width |
| v_input_5 | false | Trade reverse |
Source (PineScript)
/*backtest
start: 2023-10-28 00:00:00
end: 2023-11-27 00:00:00
period: 1h
basePeriod: 15m
exchanges: [{"eid":"Futures_Binance","currency":"BTC_USDT"}]
*/

//@version=4
////////////////////////////////////////////////////////////
//  Copyright by HPotter v1.0 09/06/2020
// Pivot points simply took the high, low, and closing price from the previous period and
// divided by 3 to find the pivot. From this pivot, traders would then base their
// calculations for three support, and three resistance levels. The calculation for the most
// basic flavor of pivot points, known as ‘floor-trader pivots’, along with their support and
// resistance levels.
//
// WARNING:
//  - For purpose educate only
//  - This script to change bars colors.
////////////////////////////////////////////////////////////
strategy(title="Pivot Point V2", shorttitle="Pivot Point V2", overlay = true)
res = input(title="Resolution", type=input.resolution, defval="D")
SellFrom = input(title="Sell from ", defval="R1", options=["R1", "R2", "R3"])
BuyFrom = input(title="Buy from ", defval="S1", options=["S1", "S2", "S3"])
width = input(1, minval=1)
reverse = input(false, title="Trade reverse")
xHigh  = security(syminfo.tickerid,res, high)
xLow   = security(syminfo.tickerid,res, low)
xClose = security(syminfo.tickerid,res, close)
vPP = (xHigh+xLow+xClose) / 3
vS1 = 2*vPP - xHigh
vR1 = 2*vPP-xLow
vS2 = vPP - (vR1 - vS1)
vR2 = vPP + (vR1 - vS1)
vS3 = xLow - 2 * (xHigh - vPP)
vR3 = xHigh + 2 * (vPP - xLow)
pos = 0
S = iff(BuyFrom == "S1", vS1,
      iff(BuyFrom == "S2", vS2,
         iff(BuyFrom == "S3", vS3,0)))
B = iff(SellFrom == "R1", vR1,
      iff(SellFrom == "R2", vR2,
         iff(SellFrom == "R3", vR3,0)))
pos := iff(close > B, 1,
       iff(close < S, -1, nz(pos[1], 0)))
possig = iff(reverse and pos == 1, -1,
          iff(reverse and pos == -1 , 1, pos))
if (possig == 1)
    strategy.entry("Long", strategy.long)
if (possig == -1)
    strategy.entry("Short", strategy.short)
if (possig == 0)
    strategy.close_all()
barcolor(possig == -1 ? #b50404: possig == 1 ? #079605 : #0536b3 )
Detail
https://www.fmz.com/strategy/433589
Last Modified
2023-11-28 17:04:16