
14 KiB
Name
基于华尔街捕鼠光环指标的加密货币看涨看跌策略Correlation-based-Bullish-Bearish-Crypto-Trading-Strategy-Based-on-Wall-Street-CCI-Index
Author
ChaoZhang
Strategy Description
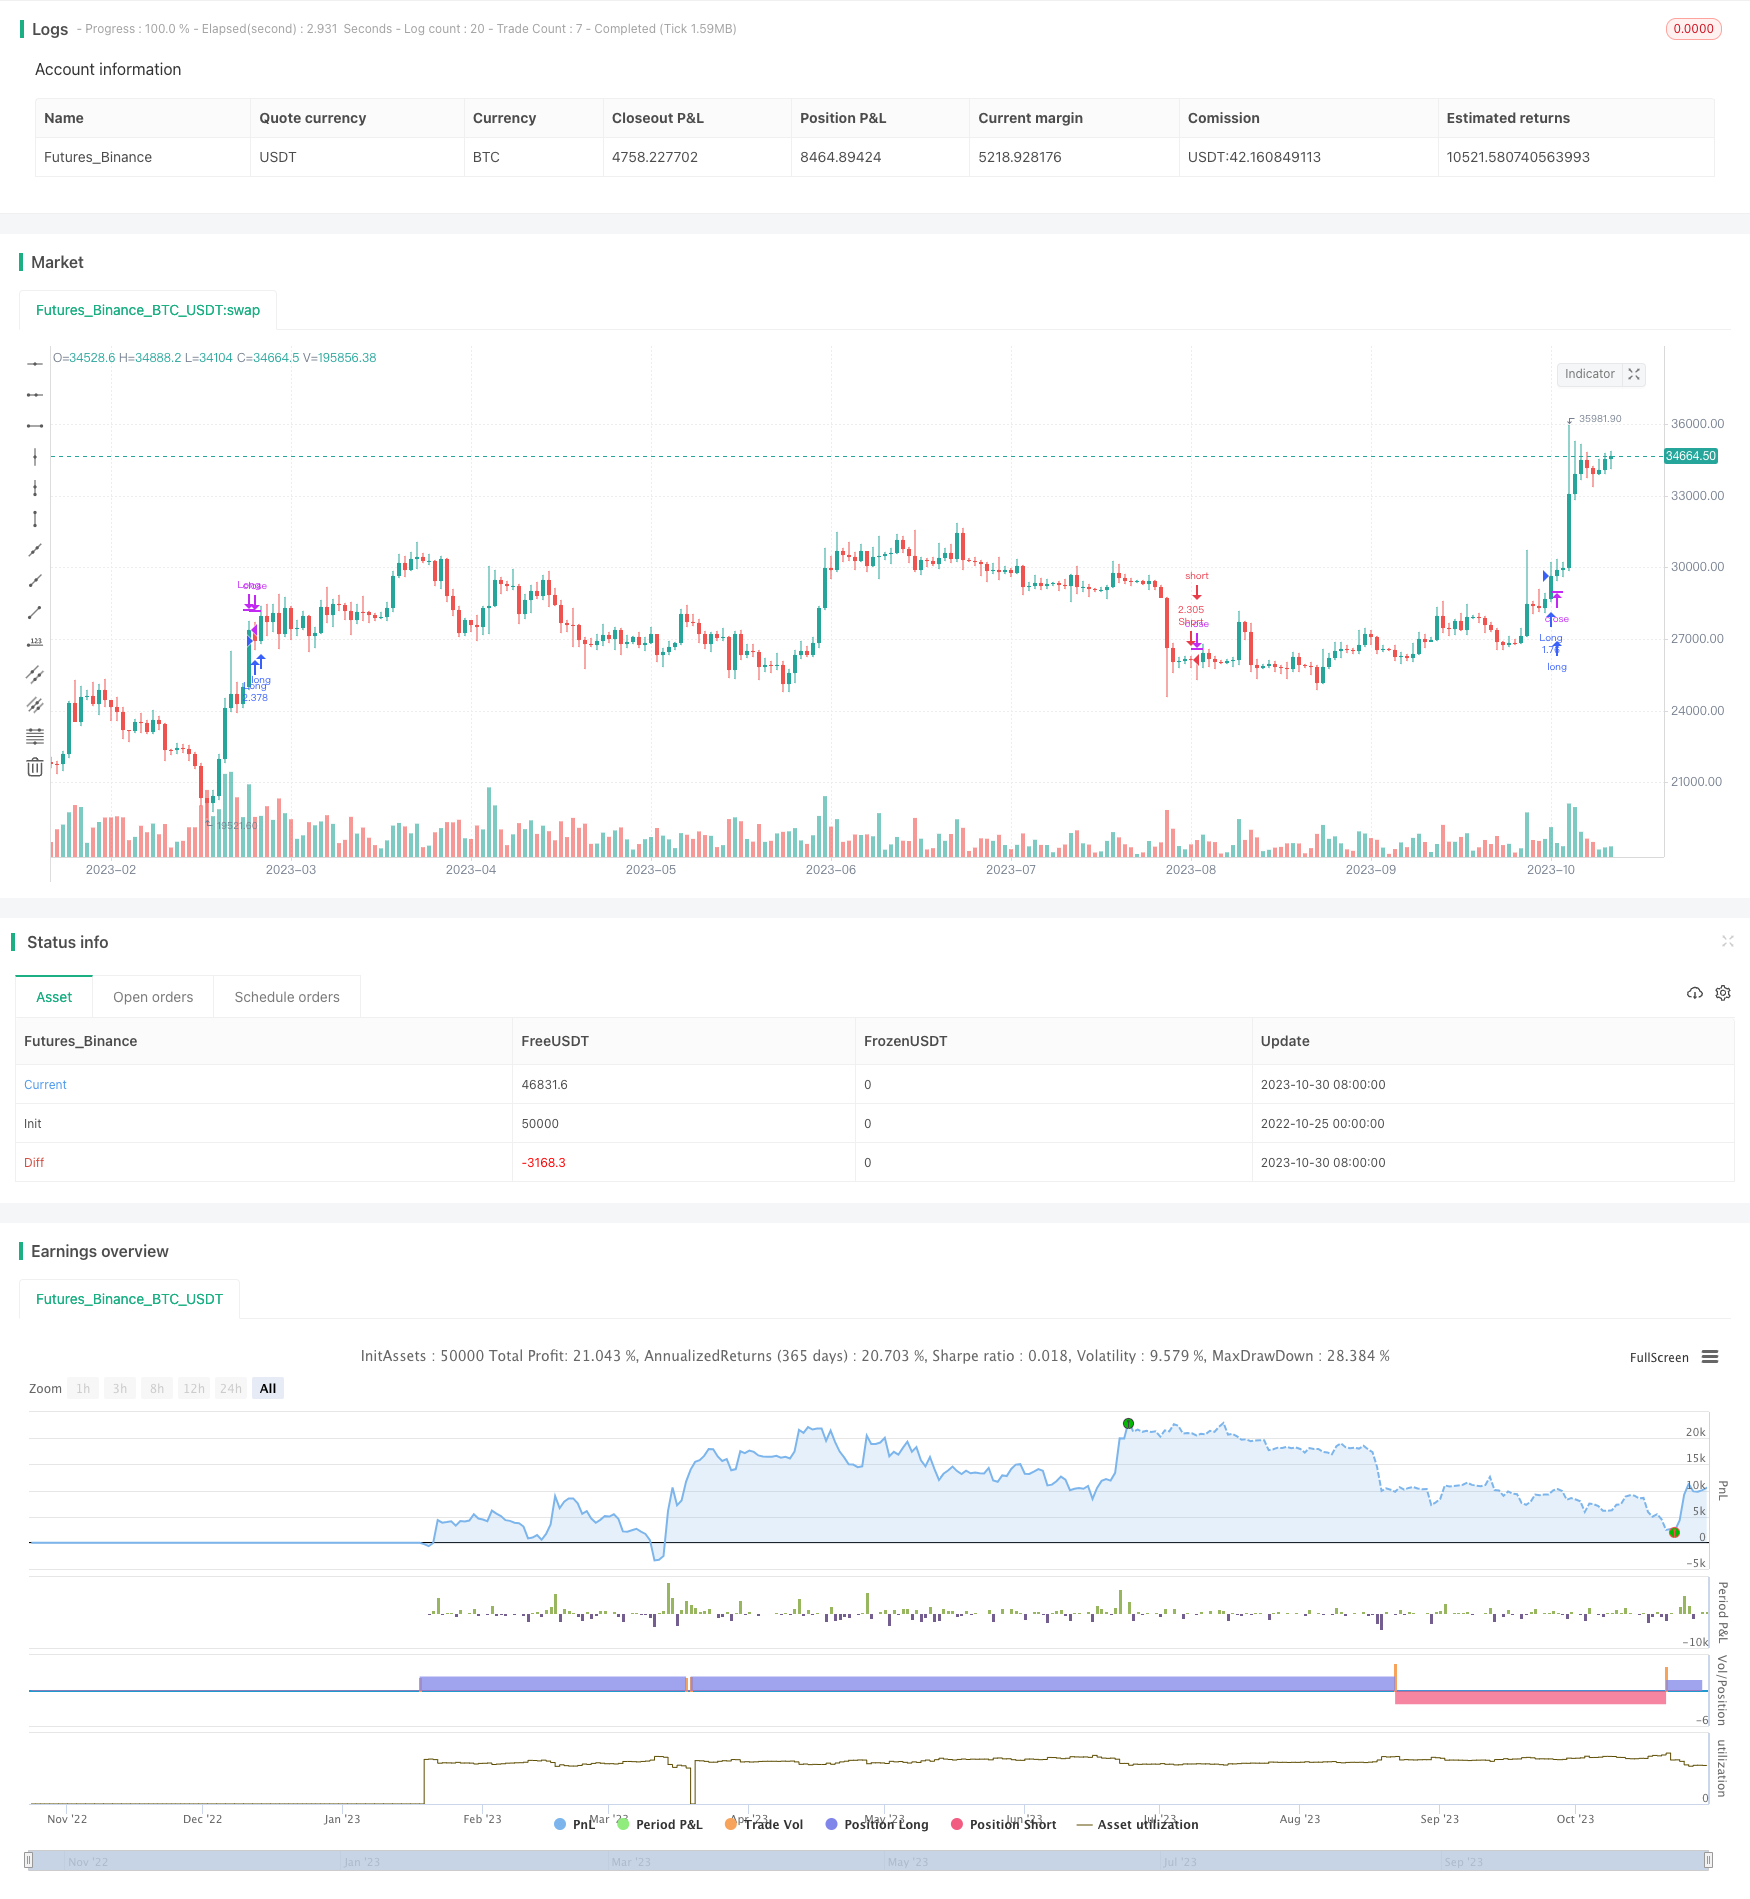 [trans]
概述
该策略基于华尔街捕鼠光环指标,对比基准加密货币市场的涨跌态势,实现对目标加密货币进行看涨看跌操作的自动交易策略。策略可根据不同加密货币设置支持度指标参数,实现对多种加密货币的跟踪交易。
策略原理
-
计算基准加密货币的华尔街捕鼠光环指标均线,设置均线长度为200周期。
-
判断均线的涨跌状态:当均线上涨时,策略采取看涨操作;当均线下跌时,策略采取看跌操作。
-
策略根据均线的涨跌状态,以及当前头寸情况,实现自动开仓和平仓:
-
当均线上涨且当前无头寸时,策略市价自动开仓做多;
-
当均线下跌且当前无头寸时,策略市价自动开仓做空;
-
当做多头寸利润达到设置的止盈比例时,策略市价自动平掉做多单;
-
当做空头寸利润达到设置的止盈比例时,策略市价自动平掉做空单;
-
当做多头寸亏损达到设置的止损比例时,策略市价自动平掉做多单;
-
当做空头寸亏损达到设置的止损比例时,策略市价自动平掉做空单。
-
-
策略根据基准加密货币行情变化,实时更新止盈止损价格。
优势分析
-
策略具有较强的适应性,可针对不同的加密货币设置不同的参数,实现对多种加密货币的跟踪交易。
-
利用华尔街捕鼠光环指标判断市场趋势,可避免噪音导致的错误交易。该指标对突破上下轨有一定的滞后性,可以减少虚假突破带来的损失。
-
策略加入止盈止损机制,可以把握趋势进行追涨杀跌,且可控制单笔损失。
-
策略进行全自动化交易,无需人工干预,可24小时运行。
风险分析
-
存在某些加密货币价格与基准加密货币脱钩的可能,从而导致策略无法正常交易的风险。可以优化为采用多个基准加密货币计算相关系数,选择相关性最强的基准加密货币。
-
存在由于市场异常波动导致止损被突破的风险。可以适当调整止损比例或加入止损追踪。
-
存在止盈比例设置过小导致无法捕捉足够趋势收益的风险。可以加入趋势跟踪或动态止盈。
-
存在假突破导致平仓止损的风险。可以适当调整指标参数, identificationsettings或加入再入场机制。
优化方向
-
利用相关性分析选择多个基准加密货币,组合计算指标,降低单一基准货币风险。
-
增加趋势跟踪机制,根据波动率动态调整止盈止损。
-
增加级别止损,防止极端行情止损被突破。
-
增加再入场机制,避免止损后错过后续行情。
-
优化指标参数,identificationsettings,提高指标效果。
-
针对不同加密货币分别优化参数,提升策略适应性。
-
优化仓位管理,根据资金规模动态调整仓位。
总结
该策略整体来看是一种典型的趋势跟踪策略。核心思路是根据华尔街捕鼠光环指标判断基准加密货币的趋势方向,以此来确定目标加密货币的交易方向。策略具有一定的优势,但也存在一些风险需要注意。通过持续优化参数以及增加趋势跟踪、风险控制等机制,可以进一步增强策略的稳定性和收益率。总体来说,该策略为自动化程序化加密货币交易提供了思路和借鉴。
||
Overview
This is an automated trading strategy that generates long/short/close signals on the target crypto currency based on the calculated trend of a benchmark crypto currency considered correlated with it, using the Wall Street Chasing Ring Index.
With default parameters and ETH/USDT as base symbol, the strategy shows good backtest results on symbols like DENT/USDT, BTT/USDT, FTT/USDT, DOT/USDT etc. This makes sense as ETH is quite influential in crypto markets so many cryptos tend to follow ETH's major movements.
Note: The strategy with default parameters is intended for 4h timeframe. On other timeframes, try different support length.
How The Strategy Works
-
A WMA is calculated on the base symbol, with length 200 by default.
-
When WMA is rising, go long. When falling go short.
-
TakeProfit for Long/Short and StopLoss for Long/Short are calculated percentages so 0.05 = 5% etc. Also, TakeProfit/StopLoss are calculated on the base symbol not chart's symbol.
-
The strategy uses market orders for entry and exit based on following logic:
-
When WMA rising and no position, long entry
-
When WMA falling and no position, short entry
-
When long position profit >= TakeProfitLong percent, close long
-
When short position profit >= TakeProfitShort percent, close short
-
When long position loss >= StopLossLong percent, close long
-
When short position loss >= StopLossShort percent, close short
-
-
TakeProfit and StopLoss prices are updated in realtime based on base symbol price changes.
Advantage Analysis
-
The strategy is highly adaptable for use on multiple crypto currencies by tuning parameters.
-
Using Wall Street CCI to determine trend avoids noise-led wrong trades. CCI has lag in breakouts helping avoid false breakout losses.
-
Incorporating TakeProfit and StopLoss allows trend following while controlling loss per trade.
-
Fully automated trading without manual intervention allows 24/7 runtime.
Risk Analysis
-
Risk of target crypto price decoupling from base crypto, leading to failure of strategy. Can optimize by using multiple base cryptos and choosing the highest correlated one.
-
Risk of sudden volatility stopping out positions. Can adjust StopLoss percent or use trailing stops.
-
Risk of TakeProfit percent too small to capture sufficient trend gains. Can incorporate trend tracking or dynamic take profit.
-
Risk of false breakout leading to stop loss exit. Can tune CCI parameters or add re-entry logic.
Optimization Directions
-
Use correlation analysis across multiple base cryptos and combine indicators to reduce single base crypto risk.
-
Add trend tracking to dynamically adjust TakeProfit/StopLoss based on volatility.
-
Add staged stops to prevent extreme moves stopping out positions.
-
Add re-entry logic to avoid missing further trends after stop loss exit.
-
Optimize CCI parameters and settings to improve signal effectiveness.
-
Optimize parameters separately for each target crypto to improve adaptability.
-
Optimize position sizing based on account size.
Summary
Overall this is a typical trend following strategy. The core idea is to determine the trend direction of a benchmark crypto using Wall Street CCI and trade the target crypto accordingly. The strategy has some advantages but also risks to note. Further enhancements in tuning, trend tracking, risk control etc. can improve stability and profitability. In summary, the strategy provides ideas and reference for automated systematic crypto trading.
[/trans]
Strategy Arguments
| Argument | Default | Description |
|---|---|---|
| v_input_int_1 | 200 | Support Length |
| v_input_1 | BTC_USDT:swap | Correlated Symbol |
| v_input_2_hlc3 | 0 | Price Source: hlc3 |
| v_input_float_1 | 0.2 | Take Profit Long |
| v_input_float_2 | 0.15 | Take Profit Short |
| v_input_float_3 | 0.1 | Stop Loss Long |
| v_input_float_4 | 0.04 | Stop Loss Short |
| v_input_3 | timestamp(01 Jan 2016 00:00 +0000) | Start Time |
| v_input_4 | timestamp(31 Dec 2050 23:59 +0000) | End Time |
Source (PineScript)
/*backtest
start: 2022-10-25 00:00:00
end: 2023-10-31 00:00:00
period: 1d
basePeriod: 1h
exchanges: [{"eid":"Futures_Binance","currency":"BTC_USDT"}]
*/

// This source code is subject to the terms of the Mozilla Public License 2.0 at https://mozilla.org/MPL/2.0/
// © levieux

//@version=5
strategy(title='Correlation Strategy', shorttitle='Correlation Strategy', initial_capital=1000, overlay=true, default_qty_type=strategy.percent_of_equity, default_qty_value=100, commission_type=strategy.commission.percent, commission_value=0.1)

supportLength = input.int(200, minval=1, title='Support Length')
supportSymbol = input('BTC_USDT:swap', title='Correlated Symbol')
supportSource = input(hlc3, title='Price Source')
takeprofitLong = input.float(0.2, 'Take Profit Long', step=0.01)
takeprofitShort = input.float(0.15, 'Take Profit Short', step=0.01)
stoplossLong = input.float(0.1, 'Stop Loss Long', step=0.01)
stoplossShort = input.float(0.04, 'Stop Loss Short', step=0.01)
start = input(defval = timestamp("01 Jan 2016 00:00 +0000"), title = "Start Time")
end = input(defval = timestamp("31 Dec 2050 23:59 +0000"), title = "End Time")

supportTicker = request.security(supportSymbol, timeframe.period, supportSource, lookahead=barmerge.lookahead_off)  //input(close, title="Source")
supportLine = ta.wma(supportTicker, supportLength)

window() => true

if not window()
    strategy.cancel_all()

supportLongPrice = close
supportShortPrice = close

if strategy.position_size > 0
    supportLongPrice := supportLongPrice[1]
if strategy.position_size < 0
    supportShortPrice := supportShortPrice[1]

longCondition = ta.rising(supportLine, 5) and window() and strategy.position_size <= 0
shortCondition = ta.falling(supportLine, 5) and window() and window() and strategy.position_size > 0
takeprofitLongCondition = takeprofitLong > 0 and window() and strategy.position_size > 0 and supportTicker > supportLongPrice * (1 + takeprofitLong)
stoplossLongCondition = stoplossLong > 0 and window() and strategy.position_size > 0 and supportTicker < supportLongPrice * (1 - stoplossLong)
takeprofitShortCondition = takeprofitShort > 0 and window() and strategy.position_size < 0 and supportTicker > supportShortPrice * (1 + takeprofitShort)
stoplossShortCondition = stoplossShort > 0 and window() and strategy.position_size < 0 and supportTicker < supportShortPrice * (1 - stoplossShort)

if longCondition
    strategy.entry('Long', strategy.long)
    supportLongPrice := supportTicker

if shortCondition
    strategy.entry('Short', strategy.short)
    supportShortPrice := supportTicker

if takeprofitLongCondition
    strategy.close('Long')
if stoplossLongCondition
    strategy.close('Long')
if takeprofitShortCondition
    strategy.close('Short')
if stoplossShortCondition
    strategy.close('Short')

///////////////////
// MONTHLY TABLE //

new_month = month(time) != month(time[1])
new_year  = year(time)  != year(time[1])

eq = strategy.equity

bar_pnl = eq / eq[1] - 1
bar_bh = (close-close[1])/close[1]

cur_month_pnl = 0.0
cur_year_pnl  = 0.0
cur_month_bh = 0.0
cur_year_bh  = 0.0

// Current Monthly P&L
cur_month_pnl := new_month ? 0.0 :
                 (1 + cur_month_pnl[1]) * (1 + bar_pnl) - 1
cur_month_bh := new_month ? 0.0 :
                 (1 + cur_month_bh[1]) * (1 + bar_bh) - 1

// Current Yearly P&L
cur_year_pnl := new_year ? 0.0 :
                 (1 + cur_year_pnl[1]) * (1 + bar_pnl) - 1
cur_year_bh := new_year ? 0.0 :
                 (1 + cur_year_bh[1]) * (1 + bar_bh) - 1

// Arrays to store Yearly and Monthly P&Ls
var month_pnl  = array.new_float(0)
var month_time = array.new_int(0)
var month_bh  = array.new_float(0)

var year_pnl  = array.new_float(0)
var year_time = array.new_int(0)
var year_bh  = array.new_float(0)

end_time = false

end_time:= time_close + (time_close - time_close[1]) > timenow or barstate.islastconfirmedhistory

if (not na(cur_month_pnl[1]) and (new_month or end_time))
    if (end_time[1])
        array.pop(month_pnl)
        array.pop(month_time)

    array.push(month_pnl , cur_month_pnl[1])
    array.push(month_time, time[1])
    array.push(month_bh , cur_month_bh[1])

if (not na(cur_year_pnl[1]) and (new_year or end_time))
    if (end_time[1])
        array.pop(year_pnl)
        array.pop(year_time)

    array.push(year_pnl , cur_year_pnl[1])
    array.push(year_time, time[1])
    array.push(year_bh , cur_year_bh[1])

// Monthly P&L Table
var monthly_table = table(na)

getCellColor(pnl, bh)  =>
    if pnl > 0
        if bh < 0 or pnl > 2 * bh
            color.new(color.green, transp = 20)
        else if pnl > bh
            color.new(color.green, transp = 50)
        else
            color.new(color.green, transp = 80)
    else
        if bh > 0 or pnl < 2 * bh
            color.new(color.red, transp = 20)
        else if pnl < bh
            color.new(color.red, transp = 50)
        else
            color.new(color.red, transp = 80)

if end_time
    monthly_table := table.new(position.bottom_right, columns = 14, rows = array.size(year_pnl) + 1, border_width = 1)

    table.cell(monthly_table, 0,  0, "",     bgcolor = #cccccc)
    table.cell(monthly_table, 1,  0, "Jan",  bgcolor = #cccccc)
    table.cell(monthly_table, 2,  0, "Feb",  bgcolor = #cccccc)
    table.cell(monthly_table, 3,  0, "Mar",  bgcolor = #cccccc)
    table.cell(monthly_table, 4,  0, "Apr",  bgcolor = #cccccc)
    table.cell(monthly_table, 5,  0, "May",  bgcolor = #cccccc)
    table.cell(monthly_table, 6,  0, "Jun",  bgcolor = #cccccc)
    table.cell(monthly_table, 7,  0, "Jul",  bgcolor = #cccccc)
    table.cell(monthly_table, 8,  0, "Aug",  bgcolor = #cccccc)
    table.cell(monthly_table, 9,  0, "Sep",  bgcolor = #cccccc)
    table.cell(monthly_table, 10, 0, "Oct",  bgcolor = #cccccc)
    table.cell(monthly_table, 11, 0, "Nov",  bgcolor = #cccccc)
    table.cell(monthly_table, 12, 0, "Dec",  bgcolor = #cccccc)
    table.cell(monthly_table, 13, 0, "Year", bgcolor = #999999)


    for yi = 0 to array.size(year_pnl) - 1
        table.cell(monthly_table, 0,  yi + 1, str.tostring(year(array.get(year_time, yi))), bgcolor = #cccccc)

        y_color = getCellColor(array.get(year_pnl, yi), array.get(year_bh, yi))
        table.cell(monthly_table, 13, yi + 1, str.tostring(math.round(array.get(year_pnl, yi) * 100)) + " (" + str.tostring(math.round(array.get(year_bh, yi) * 100)) + ")", bgcolor = y_color)

    for mi = 0 to array.size(month_time) - 1
        m_row   = year(array.get(month_time, mi))  - year(array.get(year_time, 0)) + 1
        m_col   = month(array.get(month_time, mi))
        m_color = getCellColor(array.get(month_pnl, mi), array.get(month_bh, mi))

        table.cell(monthly_table, m_col, m_row, str.tostring(math.round(array.get(month_pnl, mi) * 100)) + " (" + str.tostring(math.round(array.get(month_bh, mi) * 100)) +")", bgcolor = m_color)
Detail
https://www.fmz.com/strategy/430742
Last Modified
2023-11-01 11:27:20