
10 KiB
Name
基于动态ATR和双均线交叉的自适应风险管理策略-Adaptive-Risk-Management-Strategy-Based-on-Dynamic-ATR-and-Moving-Average-Crossover
Author
ianzeng123
Strategy Description
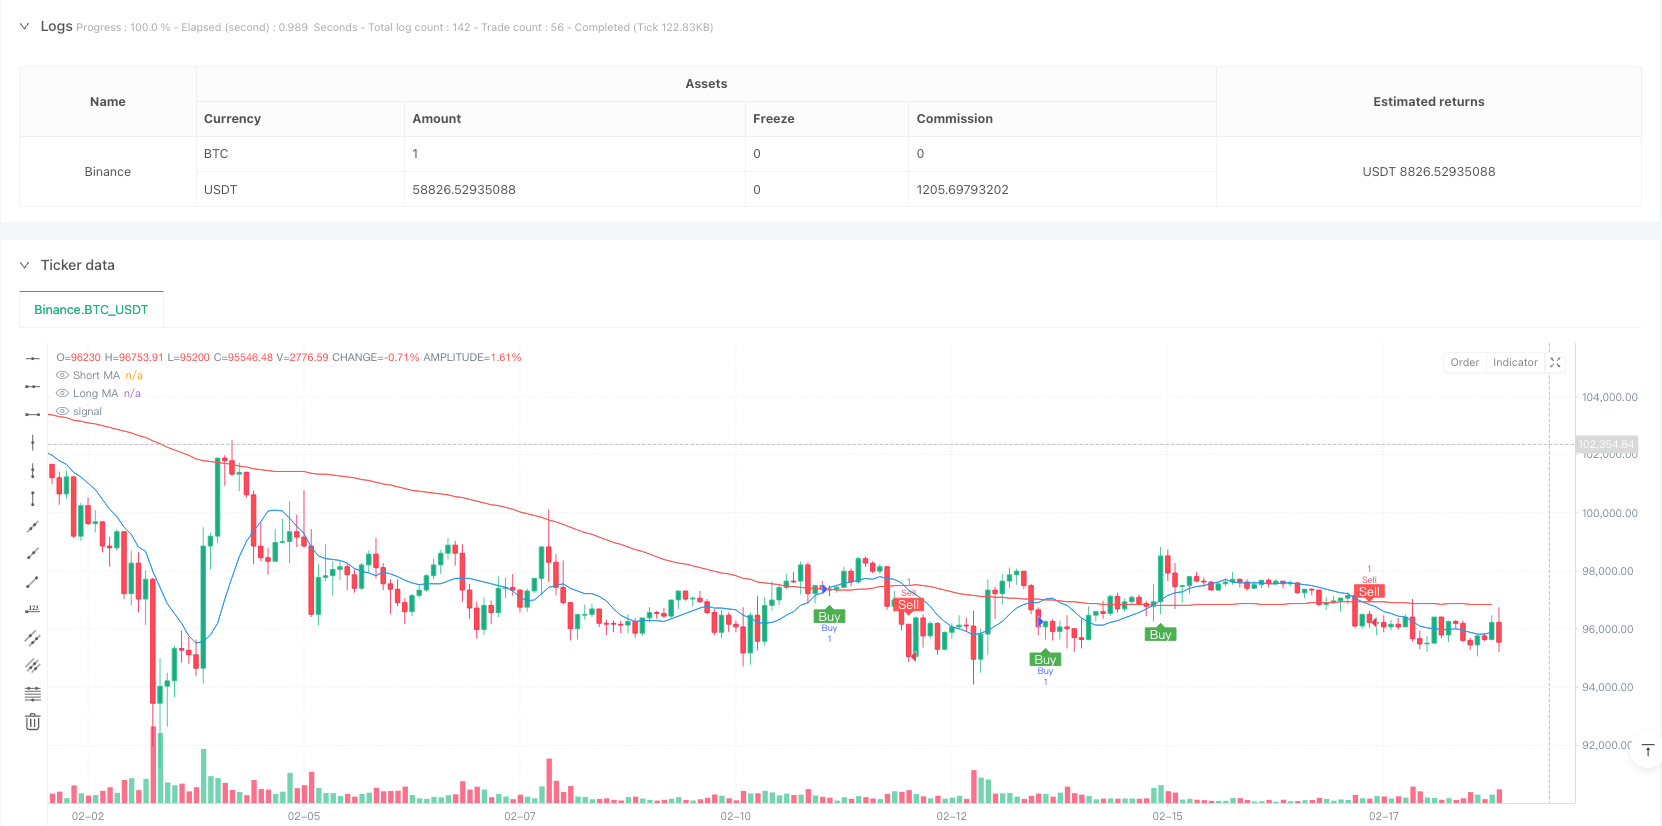
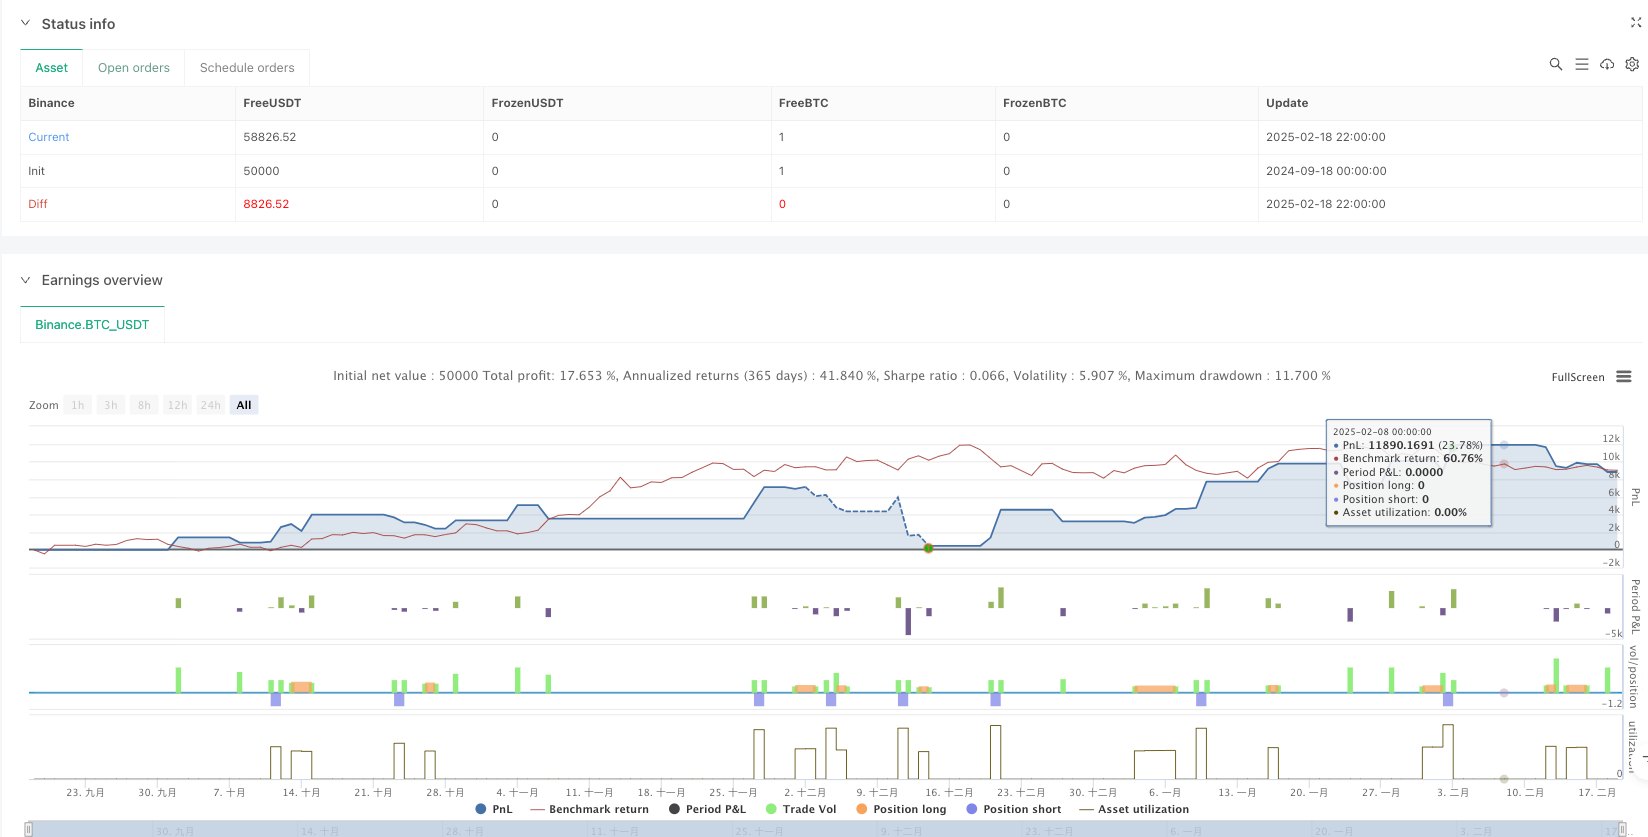
[trans]
概述
该策略是一个结合了双均线交叉信号和动态风险管理的交易系统。通过短期和长期移动平均线的交叉来产生交易信号,同时利用ATR指标动态调整止损和获利点位,并引入时间过滤和冷却期来优化交易质量。该策略还包含了风险收益比和每笔交易风险百分比的管理机制。
策略原理
策略主要基于以下几个核心组件:
- 信号生成系统采用短期(10周期)和长期(100周期)简单移动平均线的交叉来触发交易。当短期均线向上穿越长期均线时产生做多信号,反之产生做空信号。
- 风险管理系统使用14周期ATR乘以1.5倍系数来设置动态止损距离,获利目标则是止损距离的2倍(可调整的风险收益比)。
- 时间过滤器允许用户设定交易的具体时间段,仅在指定时间范围内执行交易。
- 交易冷却期机制设置10个周期的等待时间,防止过度交易。
- 每笔交易的风险控制在账户的1%(可调整)。
策略优势
- 动态风险管理: 使用ATR指标自适应市场波动性,在不同市场环境下自动调整止损和获利距离。
- 完整的风险控制: 通过设定风险收益比和每笔交易风险比例,实现系统化的资金管理。
- 灵活的时间管理: 可以根据不同市场的交易时段特点调整交易时间。
- 防过度交易: 冷却期机制有效避免在剧烈波动时期产生过多交易信号。
- 可视化效果: 在图表上清晰显示交易信号和移动平均线,便于分析和优化。
策略风险
- 趋势反转风险: 在震荡市场中可能产生虚假突破信号,导致连续止损。
- 参数敏感性: 移动平均线周期、ATR倍数等参数的选择会显著影响策略表现。
- 时间过滤器设置不当可能错过重要交易机会。
- 固定的风险收益比在不同市场环境下可能不够灵活。
策略优化方向
- 引入趋势强度过滤器: 可以添加ADX或类似指标来判断趋势强度,仅在强趋势期间交易。
- 动态调整风险收益比: 根据市场波动性或趋势强度自动调整风险收益比。
- 增加成交量分析: 将成交量作为信号确认的补充指标。
- 优化冷却期机制: 使冷却期长度根据市场波动性动态调整。
- 加入市场环境分类: 在不同的市场环境下使用不同的参数组合。
总结
该策略通过结合经典的技术分析方法和现代风险管理理念,构建了一个完整的交易系统。其核心优势在于动态风险管理和多重过滤机制,但仍需要在实际应用中根据具体市场特点进行参数优化。策略的成功运行需要交易者深入理解各个组件的作用,并根据市场变化及时调整参数。通过建议的优化方向,策略有望在不同市场环境下获得更稳定的表现。 ||
Overview
This strategy is a trading system that combines dual moving average crossover signals with dynamic risk management. It generates trading signals through the crossover of short-term and long-term moving averages while using the ATR indicator to dynamically adjust stop-loss and take-profit levels. The strategy also incorporates time filtering and a cooldown period to optimize trade quality, along with risk-reward ratio and per-trade risk percentage management mechanisms.
Strategy Principles
The strategy is based on several core components:
- The signal generation system uses the crossover of short-term (10-period) and long-term (100-period) simple moving averages to trigger trades. A buy signal is generated when the short-term MA crosses above the long-term MA, and vice versa.
- The risk management system uses a 14-period ATR multiplied by 1.5 to set dynamic stop-loss distances, with the profit target being twice the stop-loss distance (adjustable risk-reward ratio).
- A time filter allows users to set specific trading hours, executing trades only within the specified time range.
- A trading cooldown mechanism sets a 10-period waiting time to prevent overtrading.
- Risk per trade is controlled at 1% of the account (adjustable).
Strategy Advantages
- Dynamic Risk Management: Uses the ATR indicator to adapt to market volatility, automatically adjusting stop-loss and take-profit distances in different market conditions.
- Comprehensive Risk Control: Achieves systematic money management through set risk-reward ratios and per-trade risk percentages.
- Flexible Time Management: Can adjust trading hours according to different market characteristics.
- Overtrading Prevention: Cooldown mechanism effectively prevents excessive trading signals during volatile periods.
- Visualization: Clearly displays trading signals and moving averages on the chart for analysis and optimization.
Strategy Risks
- Trend Reversal Risk: May generate false breakout signals in ranging markets, leading to consecutive stops.
- Parameter Sensitivity: The choice of moving average periods, ATR multiplier, and other parameters significantly affects strategy performance.
- Improper time filter settings may miss important trading opportunities.
- Fixed risk-reward ratio may not be flexible enough for different market conditions.
Strategy Optimization Directions
- Introduce Trend Strength Filter: Add ADX or similar indicators to assess trend strength, trading only during strong trends.
- Dynamic Risk-Reward Ratio Adjustment: Automatically adjust risk-reward ratio based on market volatility or trend strength.
- Add Volume Analysis: Incorporate volume as a supplementary indicator for signal confirmation.
- Optimize Cooldown Mechanism: Make cooldown period length dynamically adjust based on market volatility.
- Implement Market Environment Classification: Use different parameter combinations in different market environments.
Summary
This strategy builds a complete trading system by combining classical technical analysis methods with modern risk management concepts. Its core advantages lie in dynamic risk management and multiple filtering mechanisms, but parameters still need to be optimized based on specific market characteristics in practical applications. Successful strategy operation requires traders to deeply understand the function of each component and adjust parameters timely according to market changes. Through the suggested optimization directions, the strategy has the potential to achieve more stable performance across different market environments.[/trans]
Source (PineScript)
/*backtest
start: 2024-09-18 00:00:00
end: 2025-02-19 00:00:00
period: 2h
basePeriod: 2h
exchanges: [{"eid":"Binance","currency":"BTC_USDT"}]
*/

//@version=5
strategy("Profitable Moving Average Crossover Strategy", shorttitle="Profitable MA Crossover", overlay=true)

// Input parameters for the moving averages
shortPeriod = input.int(10, title="Short Period", minval=1)
longPeriod = input.int(100, title="Long Period", minval=1)

// Input parameters for time filter
startHour = input.int(0, title="Start Hour (UTC)", minval=0, maxval=23)
startMinute = input.int(0, title="Start Minute (UTC)", minval=0, maxval=59)
endHour = input.int(23, title="End Hour (UTC)", minval=0, maxval=23)
endMinute = input.int(59, title="End Minute (UTC)", minval=0, maxval=59)

// Cooldown period input (bars)
cooldownBars = input.int(10, title="Cooldown Period (Bars)", minval=1)

// Risk management inputs
riskRewardRatio = input.float(2, title="Risk-Reward Ratio", minval=1)
riskPercent = input.float(1, title="Risk Per Trade (%)", minval=0.1)

// ATR settings
atrLength = input.int(14, title="ATR Length")
atrMultiplier = input.float(1.5, title="ATR Multiplier for Stop-Loss and Take-Profit")

// Calculate the moving averages
shortMA = ta.sma(close, shortPeriod)
longMA = ta.sma(close, longPeriod)

// Plot the moving averages
plot(shortMA, color=color.blue, title="Short MA")
plot(longMA, color=color.red, title="Long MA")

// Calculate ATR for dynamic stop-loss and take-profit
atr = ta.atr(atrLength)
stopLossOffset = atr * atrMultiplier
takeProfitOffset = stopLossOffset * riskRewardRatio

// Identify the crossover points
bullishCross = ta.crossover(shortMA, longMA)
bearishCross = ta.crossunder(shortMA, longMA)

// Get the current bar's time in UTC
currentTime = na(time("1", "UTC")) ? na : timestamp("UTC", year, month, dayofmonth, hour, minute)

// Define the start and end time in seconds from the start of the day
startTime = timestamp("UTC", year, month, dayofmonth, startHour, startMinute)
endTime = timestamp("UTC", year, month, dayofmonth, endHour, endMinute)

// Check if the current time is within the valid time range
isTimeValid = (currentTime >= startTime) and (currentTime <= endTime)

// Functions to check cooldown
var int lastSignalBar = na
isCooldownActive = (na(lastSignalBar) ? false : (bar_index - lastSignalBar) < cooldownBars)

// Handle buy signals
if (bullishCross and isTimeValid and not isCooldownActive)
    entryPrice = close
    stopLossBuy = entryPrice - stopLossOffset
    takeProfitBuy = entryPrice + takeProfitOffset
    strategy.entry("Buy", strategy.long)
    strategy.exit("TakeProfit/StopLoss", "Buy", stop=stopLossBuy, limit=takeProfitBuy)
    lastSignalBar := bar_index

// Handle sell signals
if (bearishCross and isTimeValid and not isCooldownActive)
    entryPrice = close
    stopLossSell = entryPrice + stopLossOffset
    takeProfitSell = entryPrice - takeProfitOffset
    strategy.entry("Sell", strategy.short)
    strategy.exit("TakeProfit/StopLoss", "Sell", stop=stopLossSell, limit=takeProfitSell)
    lastSignalBar := bar_index

// Plot signals on the chart
plotshape(series=bullishCross and isTimeValid and not isCooldownActive, location=location.belowbar, color=color.green, style=shape.labelup, text="Buy", title="Buy Signal", textcolor=color.white)
plotshape(series=bearishCross and isTimeValid and not isCooldownActive, location=location.abovebar, color=color.red, style=shape.labeldown, text="Sell", title="Sell Signal", textcolor=color.white)

// Strategy performance tracking
strategy.close("Buy", when=not isTimeValid)
strategy.close("Sell", when=not isTimeValid)
Detail
https://www.fmz.com/strategy/482836
Last Modified
2025-02-20 14:07:26