
6.4 KiB
Name
基于动态双均线追踪止损策略Dynamic-Dual-Moving-Average-Trailing-Stop-Strategy
Author
ChaoZhang
Strategy Description
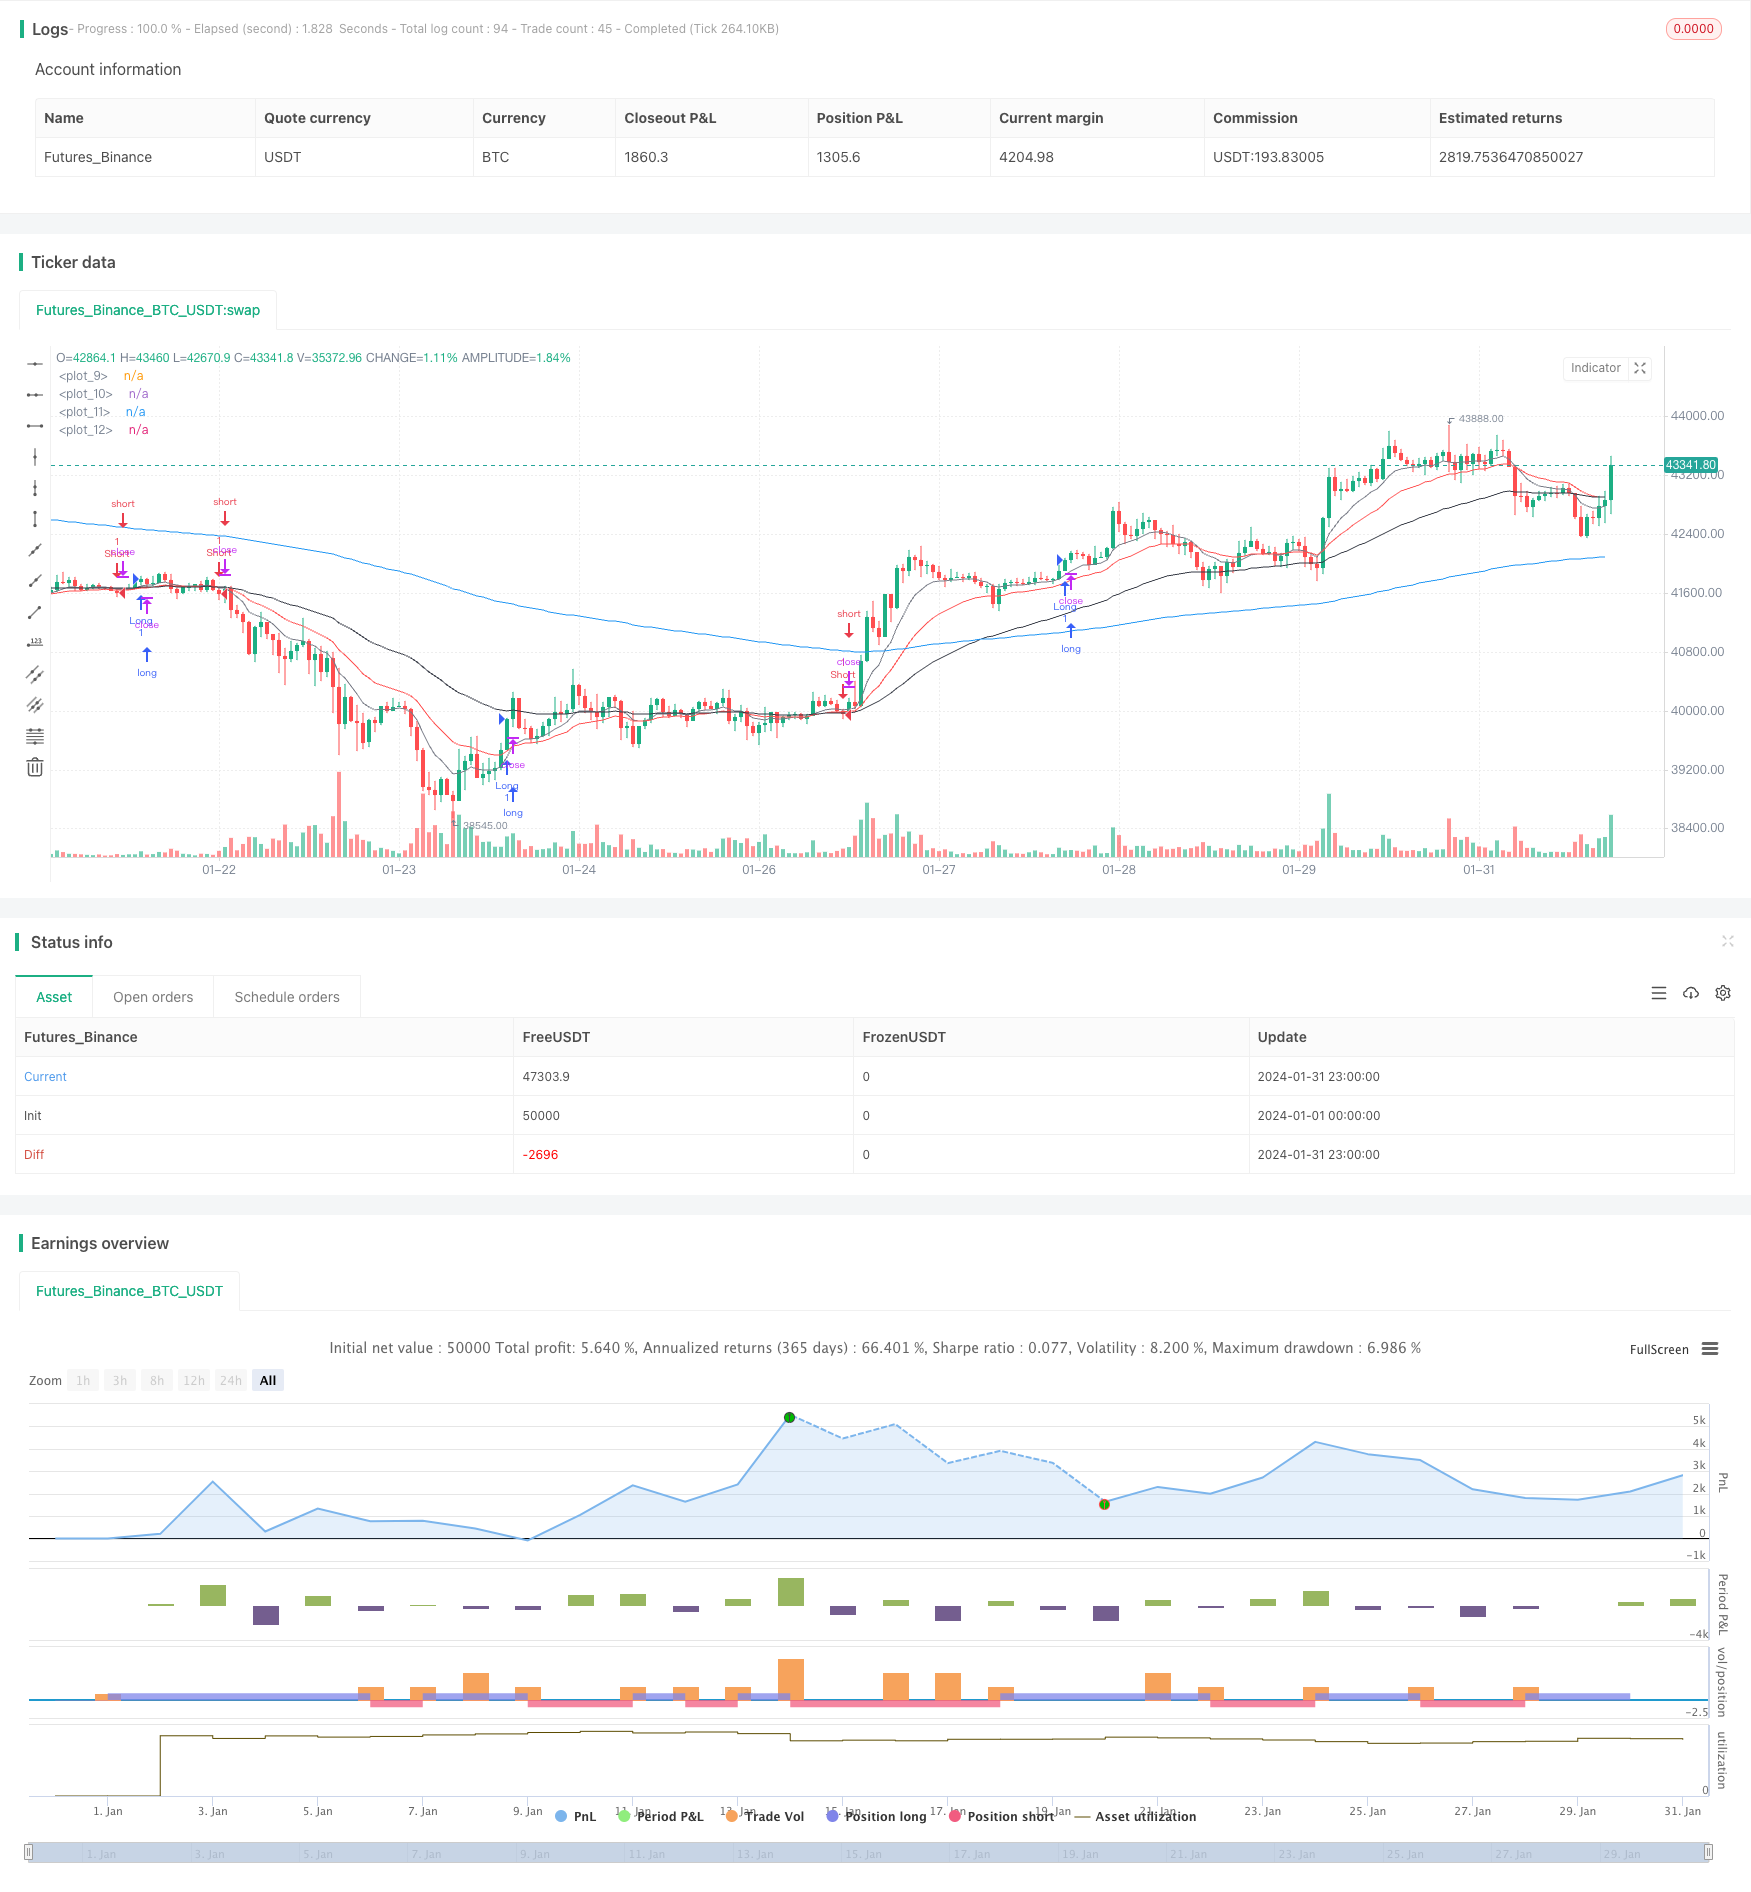 [trans]
概述
该策略是一个基于双EMA均线的动态止损追踪策略。它使用9日线、20日线判断市场趋势方向,结合RSI指标过滤假断裂。同时使用ATR指标计算动态止损位和止盈位。该策略适用于中长线持仓。
策略原理
该策略使用9日EMA作为短期均线,20日EMA作为中期均线,判断价格趋势。当价格上穿短期均线,并且收盘价高于前一日最高价,同时RSI高于30时,做多;当价格下穿短期均线,并且收盘价低于前一日最低价,同时RSI低于70时,做空。
止损位设置为收盘价减去1.5倍的ATR值,止盈位为收盘价加上ATR值乘以止盈系数。同时使用ATR的2倍设定趋势跟踪止损。
策略优势
- 使用双EMA判断市场主要趋势,避免被噪音承压
- 结合RSI指标过滤假突破,提高入场准确率
- 动态止损止盈,可以根据市场波动程度来调整止损止盈位
- 趋势跟踪止损,让利润最大化
风险分析
- EMA均线具有滞后性,可能错过短期机会
- RSI参数设置不当可能导致错过入场机会
- 止损止盈比例设置不当,可能过于宽松或严格
- 行情剧烈波动时,止损可能被突破
优化方向
1.测试不同参数的EMA组合,找到最优参数 2.优化RSI参数,平衡入场准确率和把握机会之间的关系 3.测试不同的止损止盈比例,找到最优配置 4.加入更多过滤指标条件,减少止损被突破概率
总结
该策略整体来说是一种较为稳定的中长线持仓策略。它结合双EMA判断市场主要趋势,避免被短期市场噪音影响决策。RSI指标的加入也在一定程度上过滤了假突破。此外,动态止损止盈机制也让该策略可以根据市场波动程度来调整自己的止损止盈水平。但是该策略也存在一定的风险,比如均线的滞后性,以及止损突破的可能性。这需要我们在实际应用中,通过不同的参数调整和优化来找到最佳配置。
||
Overview
This is a dynamic trailing stop strategy based on dual EMA lines. It uses 9-day and 20-day EMAs to determine market trend direction, combined with RSI indicator to filter false breaks. It also uses ATR indicator to calculate dynamic stop loss and take profit levels. This strategy is suitable for medium to long term holdings.
Strategy Logic
The strategy uses 9-day EMA as the short term line and 20-day EMA as the medium term line to determine price trend. It goes long when price crosses above the short term line and closing price is higher than previous day's high, with RSI lower than 70 and close higher than 20-day EMA minus 1 ATR. It goes short when price crosses below the short term line and closing price is lower than previous day's low, with RSI higher than 30 and close higher than 20-day EMA minus 1 ATR.
The stop loss is set at closing price minus 1.5 times ATR. Take profit is set at closing price plus ATR multiplied by a take profit coefficient. It also uses 2 times ATR to set trend trailing stop loss.
Advantage Analysis
- Using dual EMAs to determine major market trend, avoids being pressured by noise
- Combining RSI indicator to filter false breaks, improves entry accuracy
- Dynamic stop loss and take profit adapts to market volatility
- Trend trailing stop loss maximizes profits
Risk Analysis
- EMA lines have lagging effect, may miss short term opportunities
- Improper RSI parameter setting may miss entries
- Improper stop loss/take profit ratio may be too loose or strict
- Stop loss may be penetrated during violent market swings
Optimization Directions
- Test different EMA combinations to find optimal parameters
- Optimize RSI parameters to balance entry accuracy and catching opportunities
- Test different stop loss/take profit ratios to find optimal configuration
- Add more filter conditions to reduce stop loss penetration probability
Summary
Overall this is a relatively stable medium to long term holding strategy. It uses dual EMAs to determine major market trend, avoiding being affected by short term noise. The addition of RSI also filters false breaks to some extent. Moreover, the dynamic stop loss/take profit mechanism allows the strategy to adjust based on market volatility. However, there are still risks like lagging of moving averages and potential of stop loss penetration. We need to find the optimum configuration through parameter tuning and optimization during practical application.
[/trans]
Strategy Arguments
| Argument | Default | Description |
|---|---|---|
| v_input_1 | 2 | Take Profit Multiplier |
Source (PineScript)
/*backtest
start: 2024-01-01 00:00:00
end: 2024-01-31 23:59:59
period: 1h
basePeriod: 15m
exchanges: [{"eid":"Futures_Binance","currency":"BTC_USDT"}]
*/

//@version=4
strategy("CJTrade", overlay=true)

short = ema(close, 9)
medium = ema(close, 20)
long = ema(close, 50)
very_long = ema(close, 200)

plot(short, color=color.gray, linewidth=1)
plot(medium, color=color.red, linewidth=1)
plot(long, color=color.black, linewidth=1)
plot(very_long, color=color.blue, linewidth=1)

rsiValue = rsi(close, 14)

near20EMA = close > medium - atr(14)

longCond = crossover(close[1], short) and close >= high[1] and rsiValue < 70 and near20EMA
shortCond = crossunder(close[1], short) and close <= low[1] and rsiValue > 30 and near20EMA

strategy.entry("Long", strategy.long, when=longCond)
strategy.entry("Short", strategy.short, when=shortCond)

atrValue = atr(14)
stopLossLevel = close - atrValue * 1.5

// Dynamic take profit level based on ATR
takeProfitMultiplier = input(2, title="Take Profit Multiplier", minval=0.1, maxval=10, step=0.1)
takeProfitLevel = close + atrValue * takeProfitMultiplier

// Trailing stop loss for long positions
longTrailingStop = close - atrValue * 2
strategy.exit("LongTrailingStop", from_entry="Long", loss=longTrailingStop)

// Trailing stop loss for short positions
shortTrailingStop = close + atrValue * 2
strategy.exit("ShortTrailingStop", from_entry="Short", loss=shortTrailingStop)

strategy.exit("Take Profit/Stop Loss", from_entry="Long", loss=stopLossLevel, profit=takeProfitLevel)
strategy.exit("Take Profit/Stop Loss", from_entry="Short", loss=stopLossLevel, profit=takeProfitLevel)
Detail
https://www.fmz.com/strategy/442816
Last Modified
2024-02-26 11:13:17