
8.3 KiB
Name
基于加权移动平均线交叉的量化交易策略Weighted-Quantitative-Moving-Average-Crossover-Trading-Strategy
Author
ChaoZhang
Strategy Description
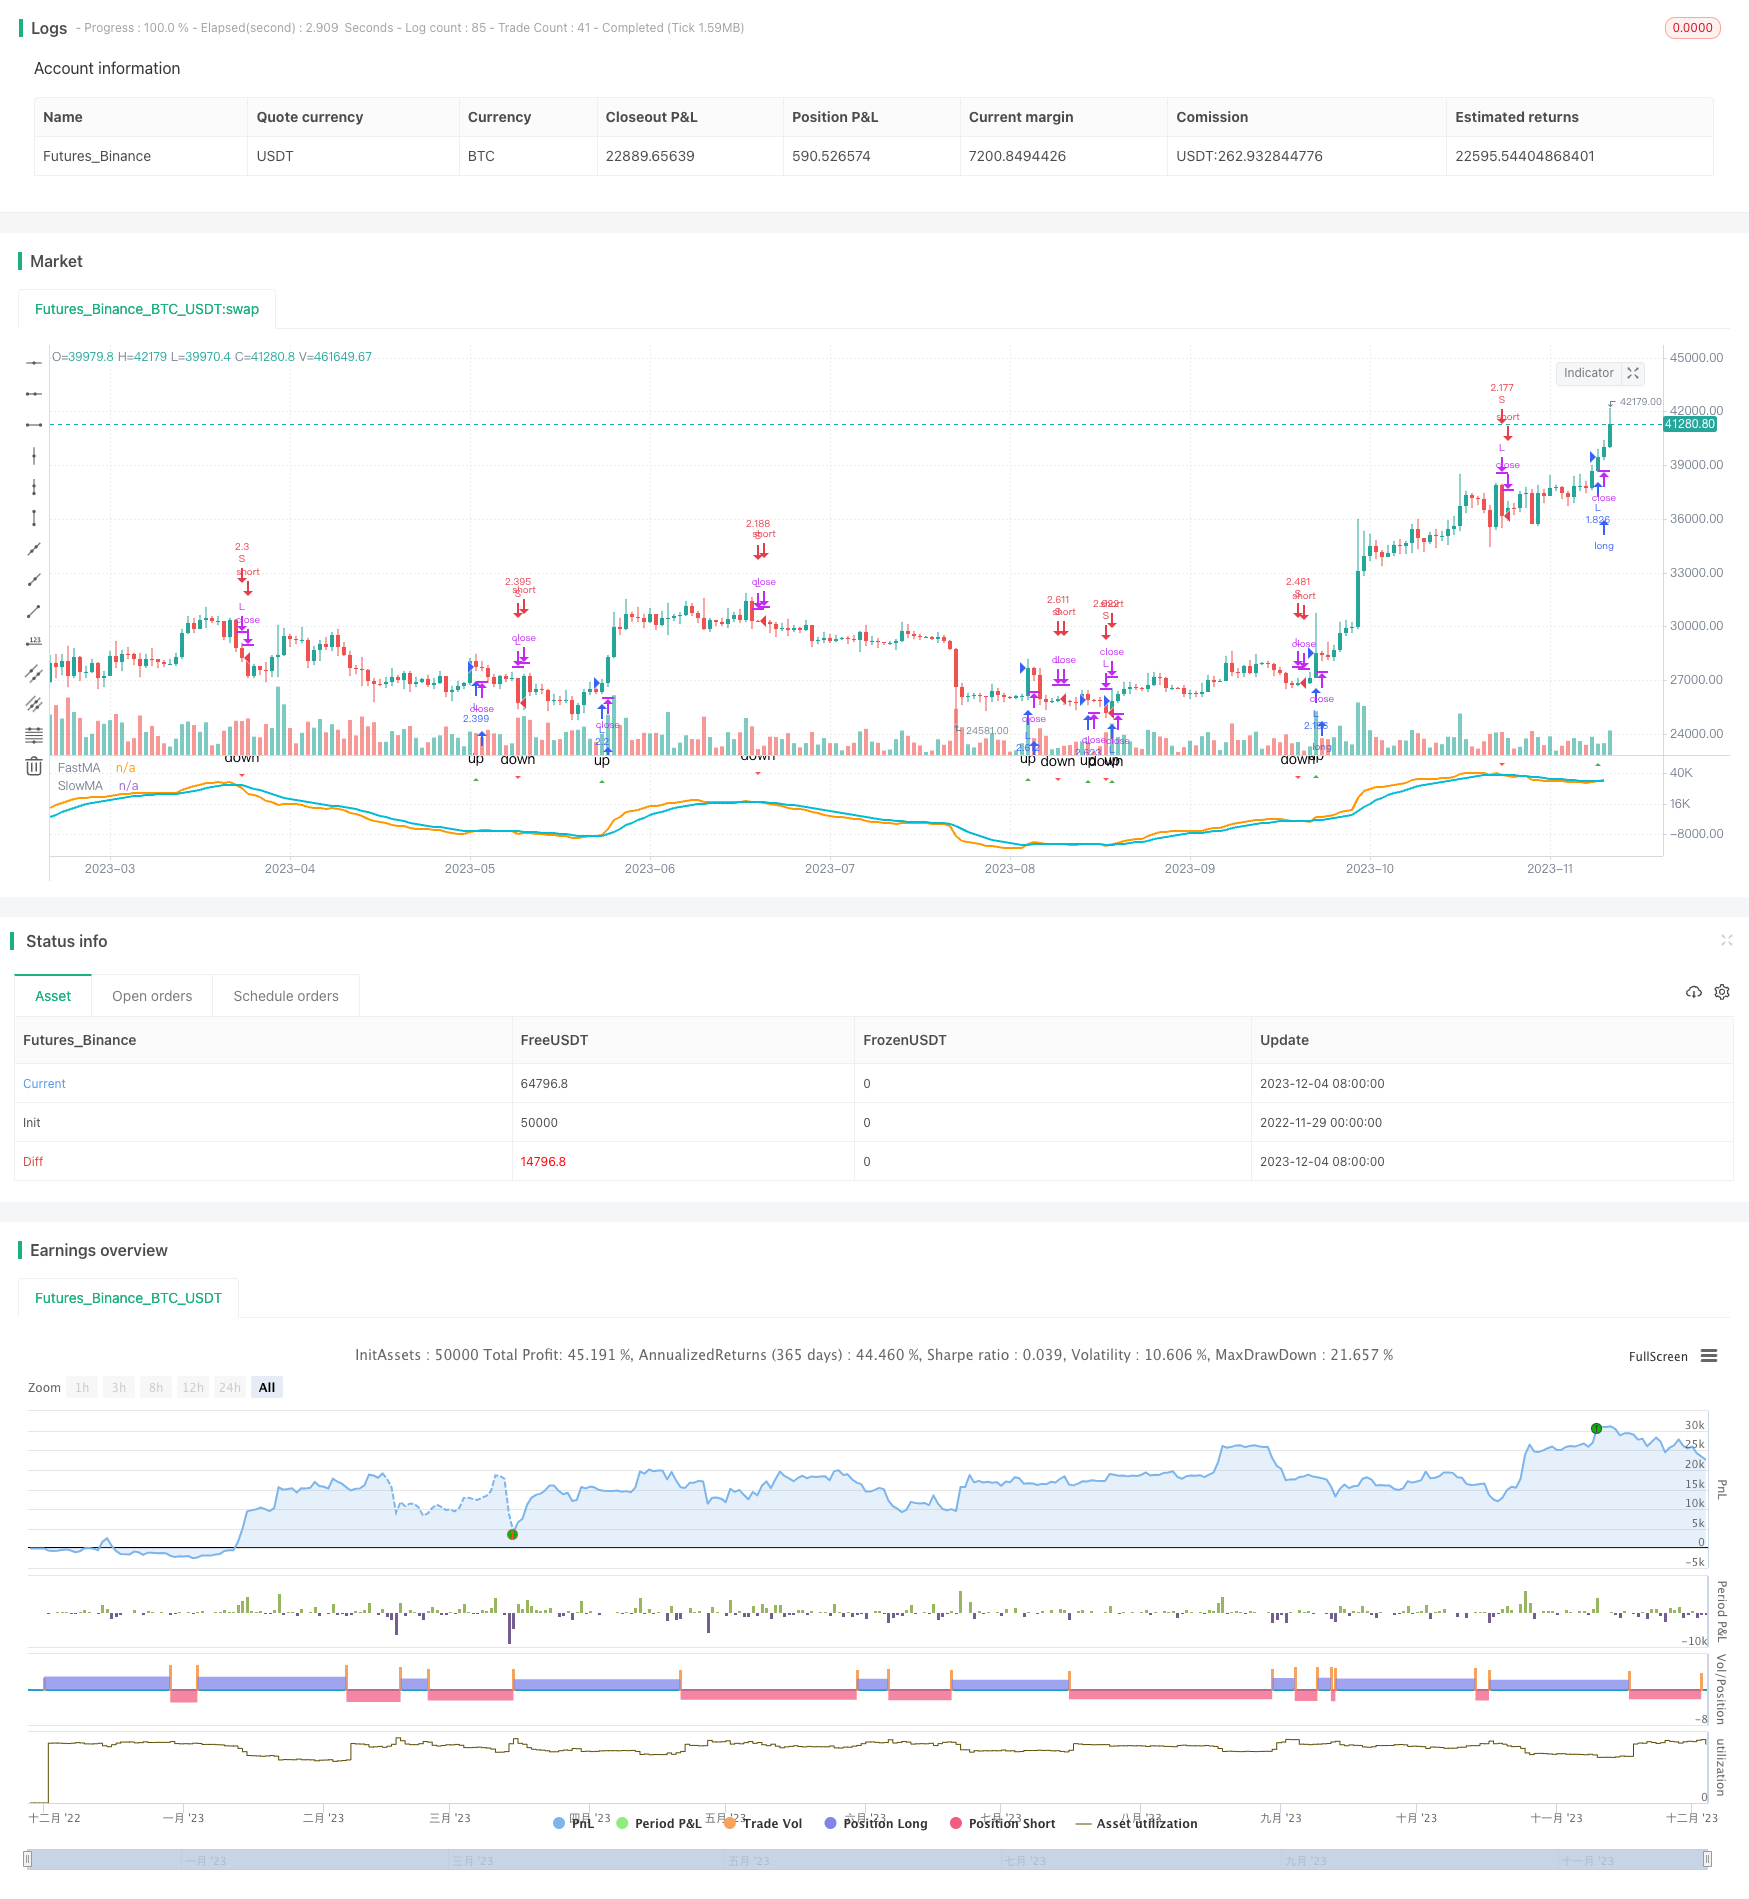 [trans]
概述
本策略名为加权量化移动平均线交叉策略(Weighted Quantitative Moving Average Crossover Strategy),其基本思路是结合价格、交易量等多种指标,设计快速线和慢速线,并在它们发生金叉和死叉时发出买入和卖出信号。
策略原理
本策略的核心指标是量化移动平均线(Quantitative Moving Average,QMA)。QMA通过计算一段时间内的加权平均价格来测量趋势方向,它与普通移动平均线的不同之处在于其中价格的权重(权重=价格*交易量)会随着时间的推移而衰减。这样,最近期价格的权重更大,可以更快速地响应市场变化。
具体来说,本策略构建了快速QMA线和慢速QMA线。快速线参数设置为25天,慢速线参数设置为29天。当快速线从下方上穿慢速线时产生买入信号;当快速线从上方下穿慢速线时产生卖出信号。
优势分析
相比普通移动平均线,本策略具有以下优势:
- 更快捷地响应市场,可以及时抓住短线机会
- 结合了价格和交易量多个维度,具有更强的稳定性
- 参数设置灵活,可适应不同市场环境
风险分析
本策略也存在一些风险:
- 短线操作频繁,容易增大交易成本和滑点
- PARAMETERS过度优化,可能导致曲线拟合
- 交易量不足时,指标效果可能会打折扣
可以通过适当调整参数频率,严格的walk forward analysis,以及结合其他指标来缓解上述风险。
优化方向
本策略仍有进一步优化的空间:
- 动态调整QMA的参数,使其能根据市场波动程度进行自适应
- 结合波动率、交易量等指标过滤入场机会
- 增加止损策略,控制单笔损失
总结
本策略总体来说是一个稳定性较好的短期交易策略。相比单一价格平均,其指标更能反映市场供需关系。通过参数调整和风控手段的引入,本策略可以长期稳定运作,获得良好收益。
||
Overview
This strategy is named Weighted Quantitative Moving Average Crossover Strategy. The basic idea is to design fast and slow lines based on price, trading volume and other indicators, and generate buy and sell signals when golden cross and dead cross occur between them.
Strategy Logic
The core indicator of this strategy is Quantitative Moving Average (QMA). QMA measures the trend direction by calculating the weighted average price over a period of time. Different from regular moving average, the weights (weight = price * trading volume) of prices in QMA will decay over time. Thus, the latest prices have bigger weights which can respond to the market change more rapidly.
Specifically, this strategy builds fast QMA line with 25 days and slow QMA line with 29 days. It will generate buy signal when fast line crosses above slow line, and sell signal when fast line crosses below slow line.
Advantage Analysis
Compared with regular moving average, this strategy has the following advantages:
- Respond to the market more promptly, which enables it to capture short-term opportunities.
- Combine multiple dimensions including price and trading volume, which makes it more stable.
- Flexible parameter settings to adapt to different market environments.
Risk Analysis
This strategy also has some risks:
- High trading frequency of short-term operations, which may lead to increased transaction costs and slippages.
- Overfitting due to excessive parameter optimization.
- Indicator effect may be compromised when the trading volume is insufficient.
The above risks could be mitigated by appropriately adjusting the frequency, strictly walk forward analysis, and incorporating other indicators.
Improvement Directions
There is still room for further optimization of this strategy:
- Dynamically adjust the parameters of QMA to make it self-adaptive to market volatility.
- Filter trading opportunities with indicators like volatility and trading volume.
- Add stop loss strategies to control single loss.
Conclusion
In general, this is a stable short-term trading strategy. Compared with single price average, its indicator can better reflect the supply-demand relationship in the market. With proper parameter tuning and risk management, this strategy can operate steadily for the long run and gain sound profit.
[/trans]
Strategy Arguments
| Argument | Default | Description |
|---|---|---|
| v_input_1 | 9 | From Month |
| v_input_2 | true | From Day |
| v_input_3 | 2018 | From Year |
| v_input_4 | true | To Month |
| v_input_5 | true | To Day |
| v_input_6 | 9999 | To Year |
| v_input_7 | 25 | FastMA |
| v_input_8 | 29 | SlowMA |
| v_input_9 | 9 | Smoothing_period |
Source (PineScript)
/*backtest
start: 2022-11-29 00:00:00
end: 2023-12-05 00:00:00
period: 1d
basePeriod: 1h
exchanges: [{"eid":"Futures_Binance","currency":"BTC_USDT"}]
*/

//@version=3
strategy("Brad VWMACD Strategy 2233", overlay=false, max_bars_back=500,default_qty_type=strategy.percent_of_equity,commission_type=strategy.commission.percent, commission_value=0.18, default_qty_value=100)

// === INPUT BACKTEST RANGE ===
FromMonth = input(defval = 9, title = "From Month", minval = 1, maxval = 12)
FromDay   = input(defval = 1, title = "From Day", minval = 1, maxval = 31)
FromYear  = input(defval = 2018, title = "From Year", minval = 2017)
ToMonth   = input(defval = 1, title = "To Month", minval = 1, maxval = 12)
ToDay     = input(defval = 1, title = "To Day", minval = 1, maxval = 31)
ToYear    = input(defval = 9999, title = "To Year", minval = 2017)

// === FUNCTION EXAMPLE ===
start     = timestamp(FromYear, FromMonth, FromDay, 00, 00)  // backtest start window
finish    = timestamp(ToYear, ToMonth, ToDay, 23, 59)        // backtest finish window
window()  => time >= start and time <= finish ? true : false // create function "within window of time"

// === INPUT SMA ===
//fastMA    = input(defval = 16, type = integer, title = "FastMA", minval = 1 )
//slowMA    = input(defval = 23, type = integer, title = "SlowMA", minval = 1)

fastMA    = input(defval = 25, title = "FastMA", minval = 1 )
slowMA    = input(defval = 29,  title = "SlowMA", minval = 1)

Long_period = slowMA
Short_period = fastMA
Smoothing_period = input(9, minval=1)
xLongMAVolPrice = ema(volume * close, Long_period)
xLongMAVol = ema(volume, Long_period)
xResLong = (xLongMAVolPrice * Long_period) / (xLongMAVol * Long_period)
xShortMAVolPrice = ema(volume * close, Short_period)
xShortMAVol = ema(volume, Short_period)
xResShort = (xShortMAVolPrice * Short_period) / (xShortMAVol * Short_period)
xVMACD = xResShort - xResLong
xVMACDSignal = ema(xVMACD, Smoothing_period)
nRes = xVMACD - xVMACDSignal
//plot(nRes*20+slowMA, color=blue, style = line )
//plot(3000, color=red, style = line )


// === SERIES SETUP ===

buy  = crossover( xVMACD,xVMACDSignal)     // buy when fastMA crosses over slowMA
sell = crossunder( xVMACD,xVMACDSignal)  // sell when fastMA crosses under slowMA


// === SERIES SETUP ===

//buy  = crossover(vwma(close, fastMA),7+vwma(close, slowMA))     // buy when fastMA crosses over slowMA
//sell = crossunder(vwma(close, fastMA),vwma(close, slowMA)-7)    // sell when fastMA crosses under slowMA

// === EXECUTION ===
strategy.entry("L", strategy.long, when = window() and buy)  // buy long when "within window of time" AND crossover
strategy.close("L", when = window() and sell)                // sell long when "within window of time" AND crossunder

// === EXECUTION ===
strategy.entry("S", strategy.short, when = window() and sell)  // buy long when "within window of time" AND crossover
strategy.close("S", when = window() and buy)                // sell long when "within window of time" AND crossunder

plotshape(window() and buy, style=shape.triangleup, color=green, text="up")
plotshape(window() and sell, style=shape.triangledown, color=red, text="down")
plot(xVMACD*100, title = 'FastMA', color = orange, linewidth = 2, style = line)  // plot FastMA
plot(xVMACDSignal*100, title = 'SlowMA', color = aqua, linewidth = 2, style = line)    // plot SlowMA
Detail
https://www.fmz.com/strategy/434436
Last Modified
2023-12-06 12:05:01