
8.8 KiB
Name
基于三连阳-阴和双均线的量化交易策略Quantitative-Trading-Strategy-Based-on-Three-Consecutive-Bullish-Bearish-Candles-and-Dual-Moving-Averages
Author
ChaoZhang
Strategy Description
 [trans]
策略概述
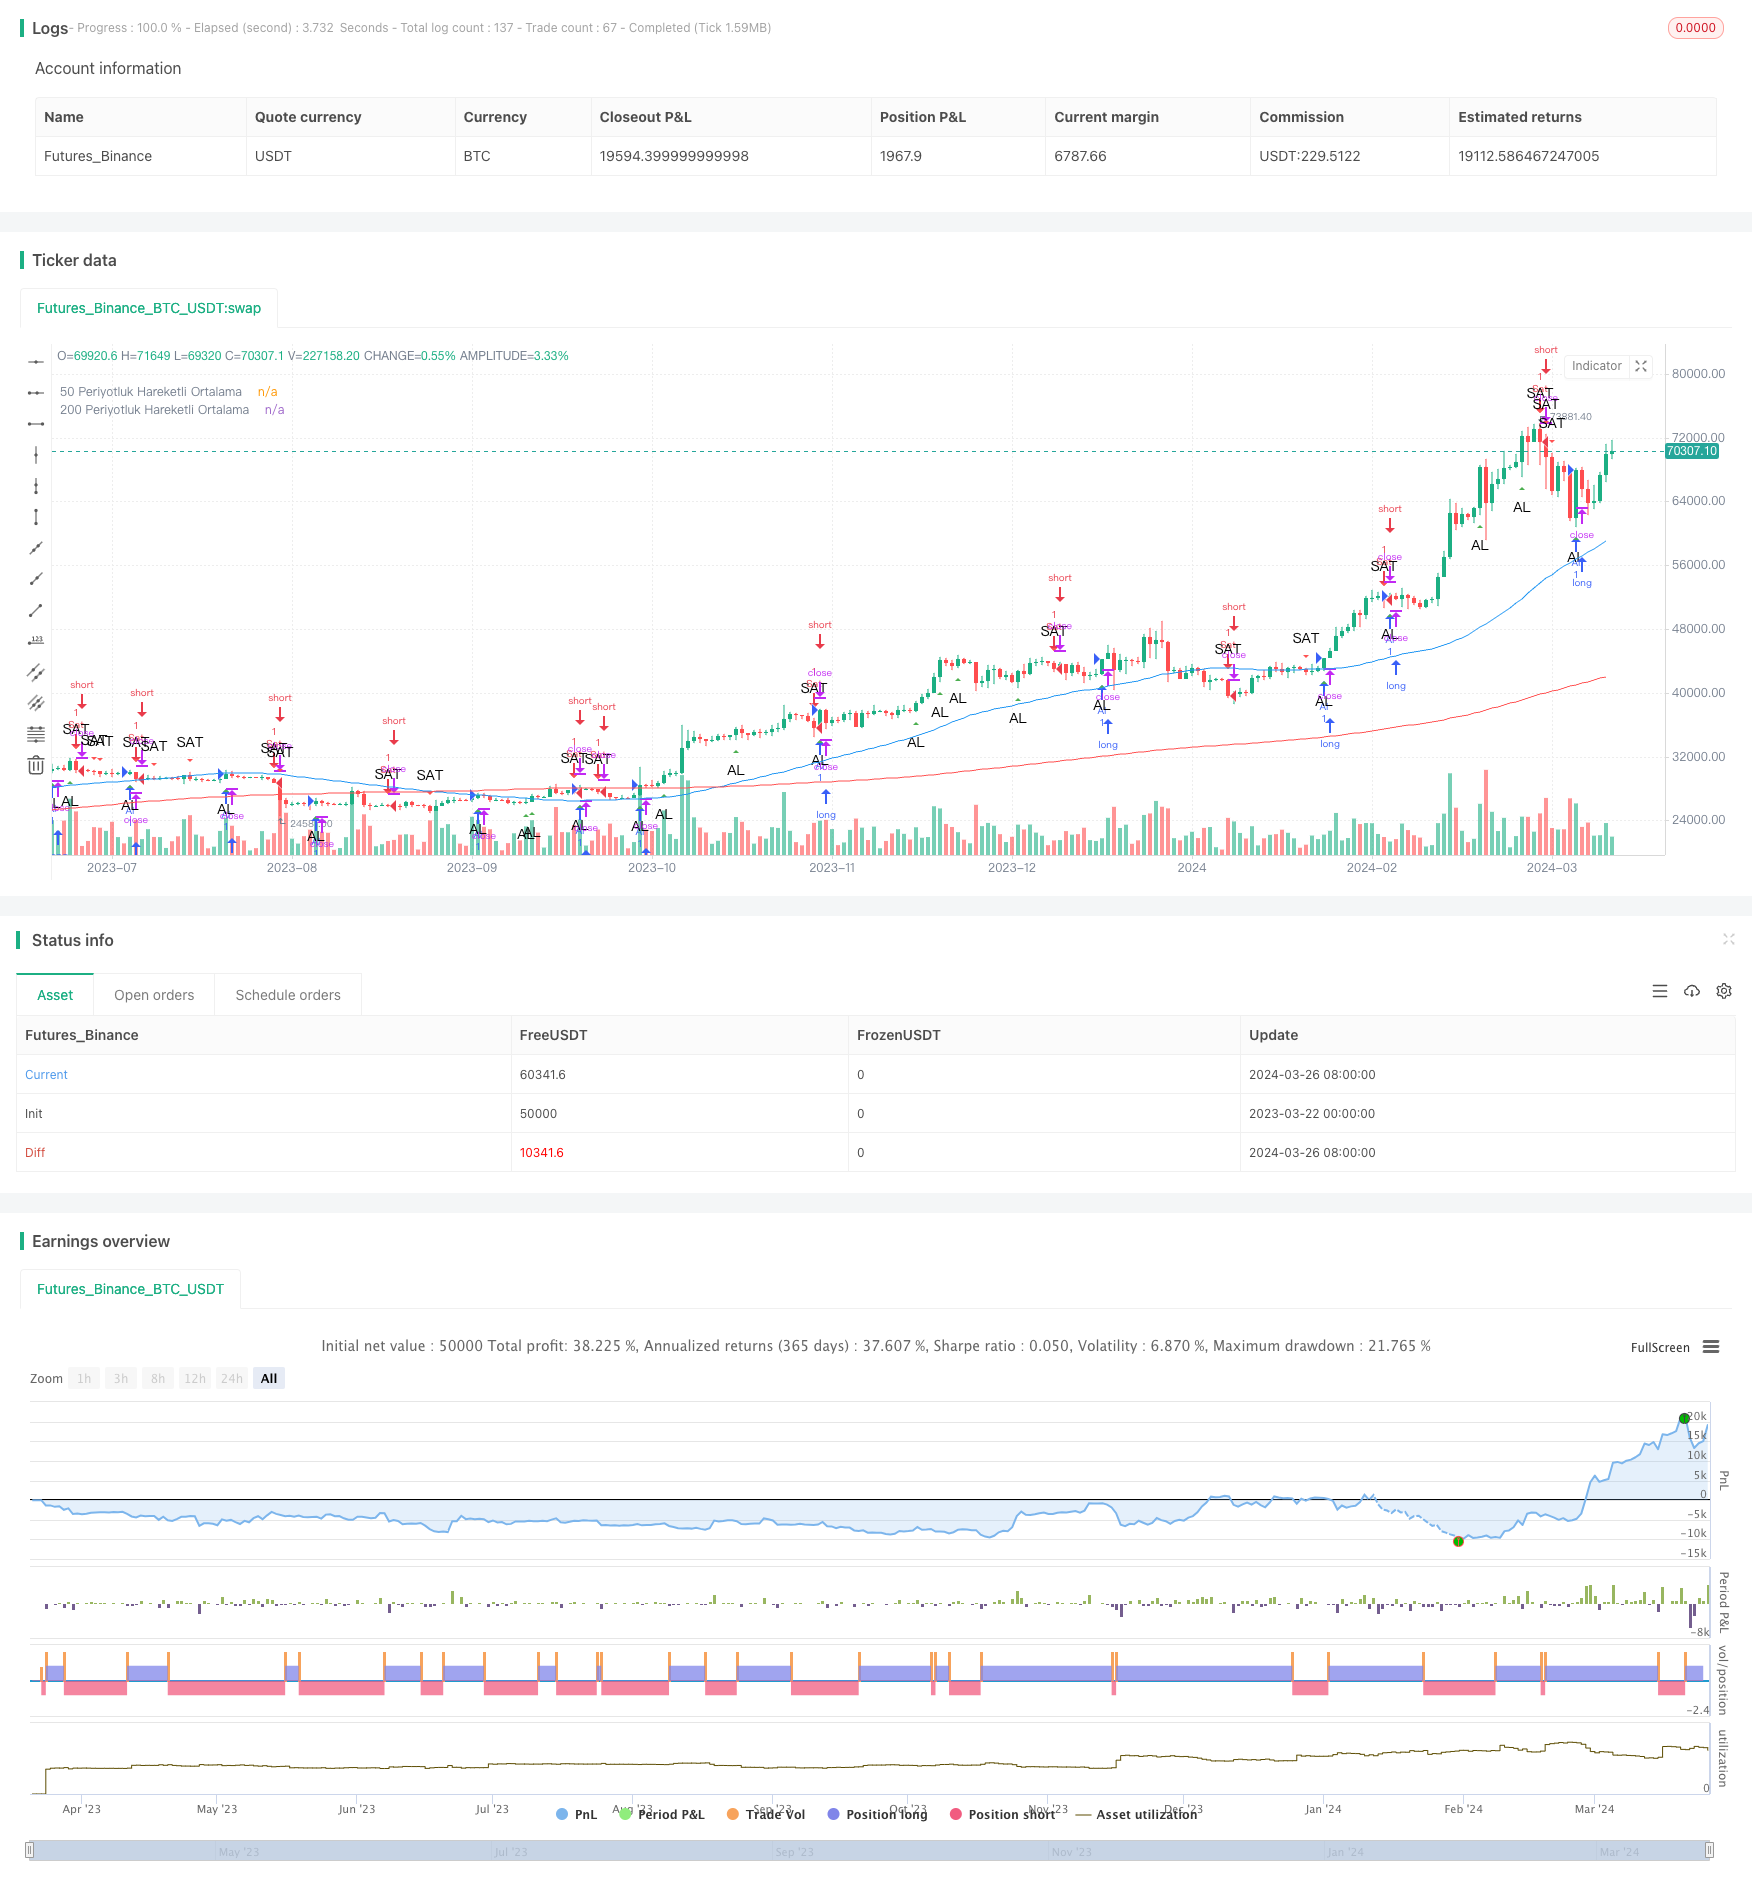
该策略基于三连阳/阴形态和双均线系统,通过判断三根连续K线的实体大小变化和均线系统的交叉信号,在第三根K线收盘时产生买入或卖出信号,以捕捉潜在的趋势拐点和价格反转机会。
策略原理
- 计算连续三根K线的实体大小,判断是否呈现递增趋势。
- 如果连续三根K线实体递增且第三根K线收阳,则产生买入信号;如果连续三根K线实体递增且第三根K线收阴,则产生卖出信号。
- 引入50日和200日两条移动平均线,分别代表中短期和长期趋势。
- 在图表上标注买卖信号和两条均线,直观展现策略逻辑和趋势状态。
- 根据买卖信号执行相应的开仓操作。
该策略的核心在于通过三连阳/阴形态捕捉趋势启动点,同时利用双均线系统验证趋势强度和方向,两个维度相结合,力求在趋势初期有效入场,降低逆势交易风险。
策略优势
- 三连阳/阴形态是一个强势的看涨/跌信号,代表多/空力量不断增强,为趋势延续提供动能。
- 双均线系统能够有效验证趋势方向和强度,短期均线上穿/下穿长期均线,意味着趋势开始转强/转弱。
- 两个维度相互印证,共同构成较为可靠的开仓信号,有助于提高策略胜率和盈亏比。
- 图表标注直观明了,便于跟踪策略执行情况和趋势演变。
策略风险
- 市场噪音和震荡可能导致频繁的虚假信号,造成策略表现不稳定。
- 趋势突然反转或加速,可能导致策略入场时机不够理想,承担额外风险敞口。
- 缺乏明确的止盈止损和仓位管理规则,策略回撤和最大亏损可能超出预期。
优化方向
- 对三连阳/阴形态的定义进行微调,如考虑连续K线的幅度、长度、颜色等附加条件,提高信号准确性。
- 引入更多均线周期参数,如5日、10日、20日等,构建多重均线系统,丰富趋势判断维度。
- 在开仓信号基础上,设置合理的止盈止损位和仓位管理规则,如固定比例止盈止损、百分比止盈止损、跟踪止损等,控制单次交易风险敞口。
- 考虑加入交易量指标,如量价背离、放量突破等,进一步验证趋势转折点,提高开仓信号可靠性。
策略总结
该策略通过经典的三连阳/阴形态和双均线系统相结合,力求捕捉趋势起始点,博取趋势之初的潜在价差收益。其优势在于信号明确,逻辑简单,易于实现和优化;同时也存在频繁交易、信号不稳定、风险控制不足等潜在风险和改进空间。后续可从信号过滤、仓位管理、止盈止损等方面入手,不断丰富和强化该策略的综合表现,为量化交易实践提供更多参考。
||
Strategy Overview
This strategy is based on the pattern of three consecutive bullish/bearish candles and a dual moving average system. By judging the change in body size of three consecutive candles and the crossover signals of the moving average system, it generates buy or sell signals at the close of the third candle to capture potential trend turning points and price reversal opportunities.
Strategy Principle
- Calculate the body size of three consecutive candles and determine if they show an increasing trend.
- If the bodies of three consecutive candles increase in size and the third candle closes bullish, a buy signal is generated; if the bodies of three consecutive candles increase in size and the third candle closes bearish, a sell signal is generated.
- Introduce two moving averages of 50-day and 200-day periods, representing medium-short term and long-term trends respectively.
- Plot buy/sell signals and the two moving averages on the chart to visually demonstrate the strategy logic and trend status.
- Execute corresponding entry operations based on the buy/sell signals.
The core of this strategy lies in capturing the starting point of a trend through the three consecutive bullish/bearish candle pattern, while using the dual moving average system to verify trend strength and direction. The combination of these two dimensions aims to effectively enter positions at the beginning of a trend and reduce the risk of counter-trend trading.
Strategy Advantages
- The three consecutive bullish/bearish candle pattern is a strong bullish/bearish signal, representing the continuous strengthening of long/short forces and providing momentum for trend continuation.
- The dual moving average system can effectively verify the direction and strength of the trend. When the short-term moving average crosses above/below the long-term moving average, it indicates that the trend is starting to strengthen/weaken.
- The two dimensions corroborate each other, forming a relatively reliable entry signal that helps improve the strategy's win rate and profit/loss ratio.
- The chart annotations are intuitive and clear, making it easy to track the strategy's execution and trend evolution.
Strategy Risks
- Market noise and fluctuations may lead to frequent false signals, resulting in unstable strategy performance.
- Sudden trend reversals or accelerations may cause the strategy's entry timing to be less than ideal, exposing it to additional risk.
- Lack of explicit take-profit, stop-loss, and position management rules may cause the strategy's drawdown and maximum loss to exceed expectations.
Optimization Directions
- Fine-tune the definition of the three consecutive bullish/bearish candle pattern, such as considering additional conditions like the amplitude, length, and color of consecutive candles, to improve signal accuracy.
- Introduce more moving average period parameters, such as 5-day, 10-day, 20-day, etc., to construct a multi-moving average system and enrich the dimensions of trend judgment.
- Based on the entry signals, set reasonable take-profit and stop-loss levels and position management rules, such as fixed ratio take-profit/stop-loss, percentage take-profit/stop-loss, trailing stop-loss, etc., to control the risk exposure of a single trade.
- Consider adding volume indicators, such as volume-price divergence, volume breakouts, etc., to further validate trend turning points and improve the reliability of entry signals.
Strategy Summary
By combining the classic three consecutive bullish/bearish candle pattern with a dual moving average system, this strategy aims to capture the starting point of a trend and profit from potential price spreads at the beginning of the trend. Its advantages lie in clear signals, simple logic, and ease of implementation and optimization; at the same time, it also has potential risks and room for improvement, such as frequent trading, unstable signals, and insufficient risk control. In the future, we can start from aspects like signal filtering, position management, take-profit/stop-loss, etc., to continuously enrich and strengthen the overall performance of this strategy and provide more references for quantitative trading practice.
[/trans]
Source (PineScript)
/*backtest
start: 2023-03-22 00:00:00
end: 2024-03-27 00:00:00
period: 1d
basePeriod: 1h
exchanges: [{"eid":"Futures_Binance","currency":"BTC_USDT"}]
*/

//@version=4
strategy("Consecutive Candles with MAs", shorttitle="CCMAs", overlay=true)

// Üç ardışık mumun büyüklüklerinin arttığını kontrol eden fonksiyon
isThreeConsecutiveCandlesIncreasing() =>
    firstCandleBody = abs(close[2] - open[2])
    secondCandleBody = abs(close[1] - open[1])
    thirdCandleBody = abs(close - open)
    firstCandleBody < secondCandleBody and secondCandleBody < thirdCandleBody

// Üçüncü mum kapandığında al veya sat koşulu
longCondition = isThreeConsecutiveCandlesIncreasing() and close > open
shortCondition = isThreeConsecutiveCandlesIncreasing() and close < open

// 50 ve 200 periyotluk hareketli ortalamalar
ma50 = sma(close, 50)
ma200 = sma(close, 200)

// Al veya sat sinyallerini grafiğe ekleme
plotshape(series=longCondition, title="Al Sinyali", location=location.belowbar, color=color.green, style=shape.triangleup, text="AL")
plotshape(series=shortCondition, title="Sat Sinyali", location=location.abovebar, color=color.red, style=shape.triangledown, text="SAT")

// Hareketli ortalamaların grafiğe eklenmesi
plot(ma50, title="50 Periyotluk Hareketli Ortalama", color=color.blue)
plot(ma200, title="200 Periyotluk Hareketli Ortalama", color=color.red)

// Al veya sat komutlarını çalıştırma
if (longCondition)
    strategy.entry("Al", strategy.long)
if (shortCondition)
    strategy.entry("Sat", strategy.short)
Detail
https://www.fmz.com/strategy/446433
Last Modified
2024-03-28 16:22:18