
11 KiB
Name
基于一目均衡表的5分钟快速突破策略Ichimoku-Scalping-Strategy-for-5-Minute-Timeframe
Author
ChaoZhang
Strategy Description
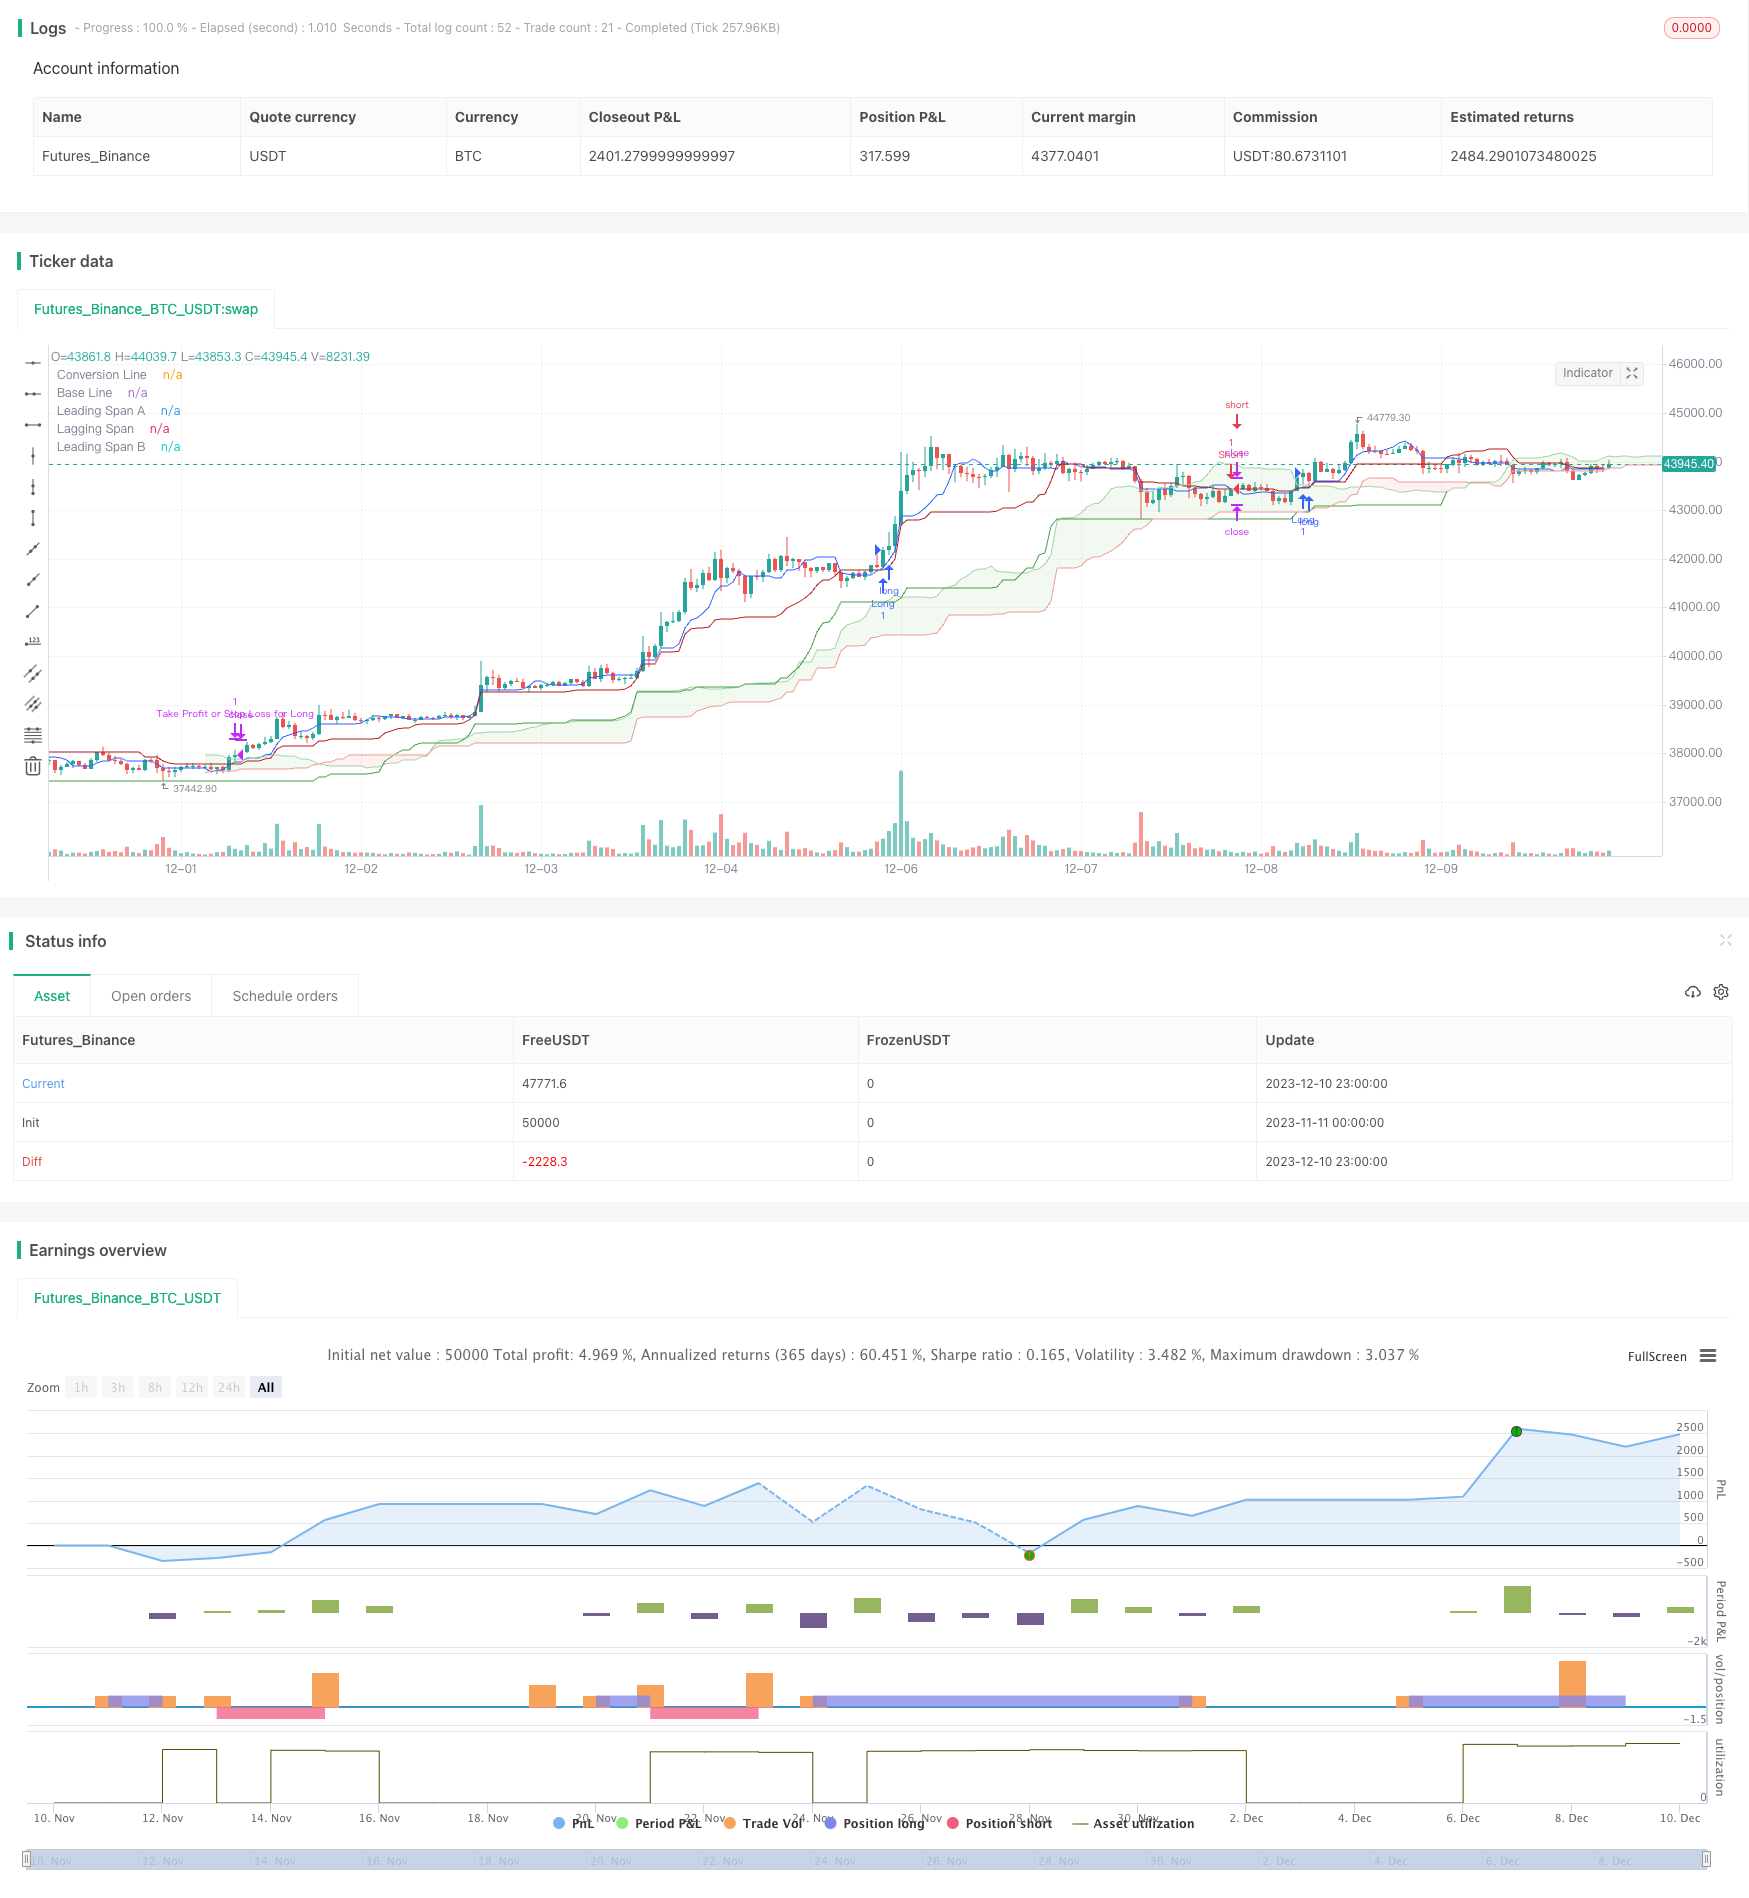 [trans]
概述
该策略是一种适用于5分钟时间框架的基于Ichimoku一目均衡表的快速突破scalping策略。策略充分利用Ichimoku的转换线、基准线以及前沿线A/B等元素来捕捉市场的短期动量。与传统Ichimoku策略不同,该策略进行了参数优化,使其更适合高频交易。
策略的主要思想是在转换线上穿或下穿基准线时进行做多或做空,并且价格要突破云图的两条前沿线,这样可以更准确地判断趋势方向。同时,策略定义了止损位和止盈位来控制风险。
策略原理
该策略主要基于Ichimoku的转换线和基准线构建做多做空信号。转换线反应价格的短期动量变化,基准线反应中期趋势。
具体来说,当转换线上穿基准线时产生做多信号,此时要求价格高于云图的两条前沿线A和B,这样可以确保突破上行。相反,转换线下穿基准线时产生做空信号,要求价格低于云图的两条前沿线,确保突破下行。
另外,策略定义了两个参数percentStop和percentTP,分别表示止损比例和止盈比例。这两个数值可以根据交易者的风险偏好进行设置。止损和止盈价格会基于开仓平均价格计算得出。
当做多或做空信号被触发后,相应的止损单和止盈单也会下发。如果价格触及止盈或止损水平,则对应的头寸会平仓。
优势分析
相比传统的Ichimoku策略,该策略进行了如下优化:
- 转换线周期缩短至9,可以更快捕捉价格变化。
- 基准线周期保持在26,代表中期趋势。
- 前沿线B周期延长至52,可以判断长期趋势方向。
- 置换修正量设定为26,使一目均衡表可以提前26个周期进行预测。
这些参数调整使得策略更适合5分钟这种高频交易时段,可以快速判断局部极值点附近的反转机会。同时结合云图判断长短期趋势增加了效率。
另外该策略直接内置了止损止盈逻辑,不需要交易者自己追加,可以方便管理风险,适合初学者。
风险分析
该策略主要面临如下风险:
- 高频scalping策略对交易成本比较敏感,建议选择低手续费的券商。
- 反转类策略对市场震荡比较脆弱,在震荡行情中可能出现止损被触发的情况。
- 策略没有考虑基本面因素,在重大事件发生时可能失效。
- 策略优化的周期参数可能在不同品种下效果差异大,需要针对品种分别测试。
为控制风险可以考虑如下方法:
- 调高止损比例,确保单笔损失控制在可承受范围。
- 在高波动时段避免交易,选择相对稳定的时段操作。
- 结合基本面分析,避免在重大事件前后使用该策略。
- 对不同交易品种分别测试参数,寻找最佳周期组合。
优化方向
该策略还有如下的优化空间:
- 结合波动率指标以及成交量指标增强入场时机的判断。
- 增加自适应止损机制。如移动止损,突破止损等方式。
- 利用机器学习训练参数,使其更好适应不同品种和市场环境。
- 结合基本面信号,避开重大事件的策略影响。
这些优化可以使策略在更多的市场环境下保持稳定的表现。
总结
该Ichimoku scalping策略通过调整传统参数使之更适合高频操作。结合转换线,基准线以及云图的判断可以快速抓住短期趋势。内置的止盈止损机制也便于风险控制。
虽然该策略有一定的优势,但也存在反转策略的典型风险。后续可以从波动率,机器学习,事件驱动等多角度进行优化,使策略更加稳健适应复杂环境。
||
Overview
This strategy is an Ichimoku breakout scalping system optimized for 5-minute timeframe. It takes advantage of Ichimoku elements like conversion line, base line and leading spans to capture short-term momentum. Unlike traditional Ichimoku strategies, this system features customized parameters tailored for high-frequency trading.
The rationale behind the strategy is to go long or short when conversion line crosses base line, with additional condition on price crossing the Ichimoku cloud boundaries to confirm trend directionality. Stop loss and take profit levels are also defined to control risks.
Strategy Logic
The strategy mainly uses conversion line crossover base line to construct long and short signals. Conversion line reflects price's short-term momentum while base line shows mid-term trend.
Specifically, when conversion line crosses over base line, it triggers long signal, provided that price is above both leading span A and B of the Ichimoku cloud. This confirms upwards breakout. Conversely, when conversion line crosses below base line, it produces short signal, given price is below the cloud's leading spans to ensure downside breakout.
Additionally, two input parameters percentStop and percentTP represent stop loss percentage and take profit percentage respectively. Traders can tweak these numbers based on their risk appetite. Stop loss and take profit prices are calculated from average entry price of the positions.
Once long or short signal is triggered, corresponding stop loss and take profit orders will also be placed. Existing positions will be closed if price touches either threshold.
Advantage Analysis
Compared to traditional Ichimoku strategies, this system made the following enhancements:
- Conversion line period shortened to 9 for faster price change detection.
- Base line period kept at 26 to represent mid-term trend.
- Leading span B period extended to 52 to gauge long-term trend direction.
- Displacement set at 26, shifting the Ichimoku cloud 26 periods ahead for forecasting.
These adjustments make the strategy more suitable for 5-minute high-frequency trading, being able to quickly identify mean-reversion opportunities around local extremum. Cloud visualization also improves efficiency by showing long-term versus short-term trend.
In addition, the stop loss and take profit logic is built-in for convenience, making it beginner friendly.
Risk Analysis
The main risks of this strategy includes:
- Scalping strategies are sensitive to trading costs. Brokers with low commissions are recommended.
- Mean reversion systems are vulnerable to whipsaws in ranging markets, causing stop loss triggers.
- Fundamentals are not considered and the strategy may fail around major events.
- Optimized periods could perform very differently across products, requiring separate optimization.
Following methods can help control risks:
- Raise stop loss percentage to limit single trade loss exposure.
- Avoid trading sessions with high volatility, focus on relatively stable periods.
- Combine fundamentals analysis and avoid deploying strategy around significant events.
- Test parameters separately for each product to find optimal combinations.
Enhancement Opportunities
Potential areas of improvement for the strategy:
- Incorporate volatility metrics and volume to augment entry signals.
- Introduce adaptive stop loss mechanisms like trailing stop loss or breakout stop loss.
- Utilize machine learning techniques to train parameters for better cross-market applicability.
- Combine fundamental signals to avoid distortions around major announcements.
These additions will likely to enhance the strategy's stability across more market conditions.
Conclusion
The Ichimoku scalping strategy adapts traditional settings for high-frequency applicability. Conversion line crossover base line coupled with Ichimoku cloud visualization allows quick identification of short-term trends. The built-in stop loss / take profit controls further facilitates risk management.
While the strategy has its merits, typical limitations of mean reversion systems remain. Further improvements on aspects like volatility, machine learning and events can potentially make the strategy more robust for complex environments.
[/trans]
Strategy Arguments
| Argument | Default | Description |
|---|---|---|
| v_input_1 | true | Show Ichimoku Cloud |
| v_input_2 | true | Show TP/SL |
| v_input_3 | 9 | Conversion Line Periods |
| v_input_4 | 26 | Base Line Periods |
| v_input_5 | 52 | Span B Periods |
| v_input_6 | 26 | Displacement |
| v_input_7 | 0.5 | Stop Loss (%) |
| v_input_8 | true | Take Profit (%) |
Source (PineScript)
/*backtest
start: 2023-11-11 00:00:00
end: 2023-12-11 00:00:00
period: 1h
basePeriod: 15m
exchanges: [{"eid":"Futures_Binance","currency":"BTC_USDT"}]
*/

//@version=5
strategy(title="Scalping Ichimoku Strategy", shorttitle="Scalp Ichimoku", overlay=true)

showBB = input(true, "Show Ichimoku Cloud")
showTrade = input(true, 'Show TP/SL')
conversionPeriods = input(9, "Conversion Line Periods")
basePeriods = input(26, "Base Line Periods")
spanBPeriods = input(52, "Span B Periods")
displacement = input(26, "Displacement")

conversionLine = (ta.highest(high, conversionPeriods) + ta.lowest(low, conversionPeriods)) / 2
baseLine = (ta.highest(high, basePeriods) + ta.lowest(low, basePeriods)) / 2
leadLine1 = (conversionLine + baseLine) / 2
leadLine2 = (ta.highest(high, spanBPeriods) + ta.lowest(low, spanBPeriods)) / 2

plot(showBB ? conversionLine : na, "Conversion Line", color=#2962FF)
plot(showBB ? baseLine : na, "Base Line", color=#B71C1C)
plot(showBB ? ta.lowest(low, 52) : na, "Lagging Span", color=#43A047, offset=-displacement)
p1 = plot(showBB ? leadLine1 : na, "Leading Span A", color=#A5D6A7, offset=displacement)
p2 = plot(showBB ? leadLine2 : na, "Leading Span B", color=#EF9A9A, offset=displacement)
fill(p1, p2, color=leadLine1 > leadLine2 ? color.new(color.green, 90) : color.new(color.red, 90))

// Define the shorter Stop Loss and Take Profit percentages for scalping
percentStop = input(0.5, "Stop Loss (%)")
percentTP = input(1.0, "Take Profit (%)")

// Define the entry conditions
longCondition = ta.crossover(conversionLine, baseLine) and close > leadLine1 and close > leadLine2
shortCondition = ta.crossunder(conversionLine, baseLine) and close < leadLine1 and close < leadLine2

if (longCondition)
    strategy.entry("Long", strategy.long)
    strategy.exit("Take Profit or Stop Loss for Long", "Long", stop=strategy.position_avg_price * (1 - percentStop / 100), limit=strategy.position_avg_price * (1 + percentTP / 100))

if (shortCondition)
    strategy.entry("Short", strategy.short)
    strategy.exit("Take Profit or Stop Loss for Short", "Short", stop=strategy.position_avg_price * (1 + percentStop / 100), limit=strategy.position_avg_price * (1 - percentTP / 100))
Detail
https://www.fmz.com/strategy/435169
Last Modified
2023-12-12 18:12:02