
8.3 KiB
Name
坚实踏实的SMA均线持仓策略Solid-and-Steady-SMA-Position-Holding-Strategy
Author
ChaoZhang
Strategy Description
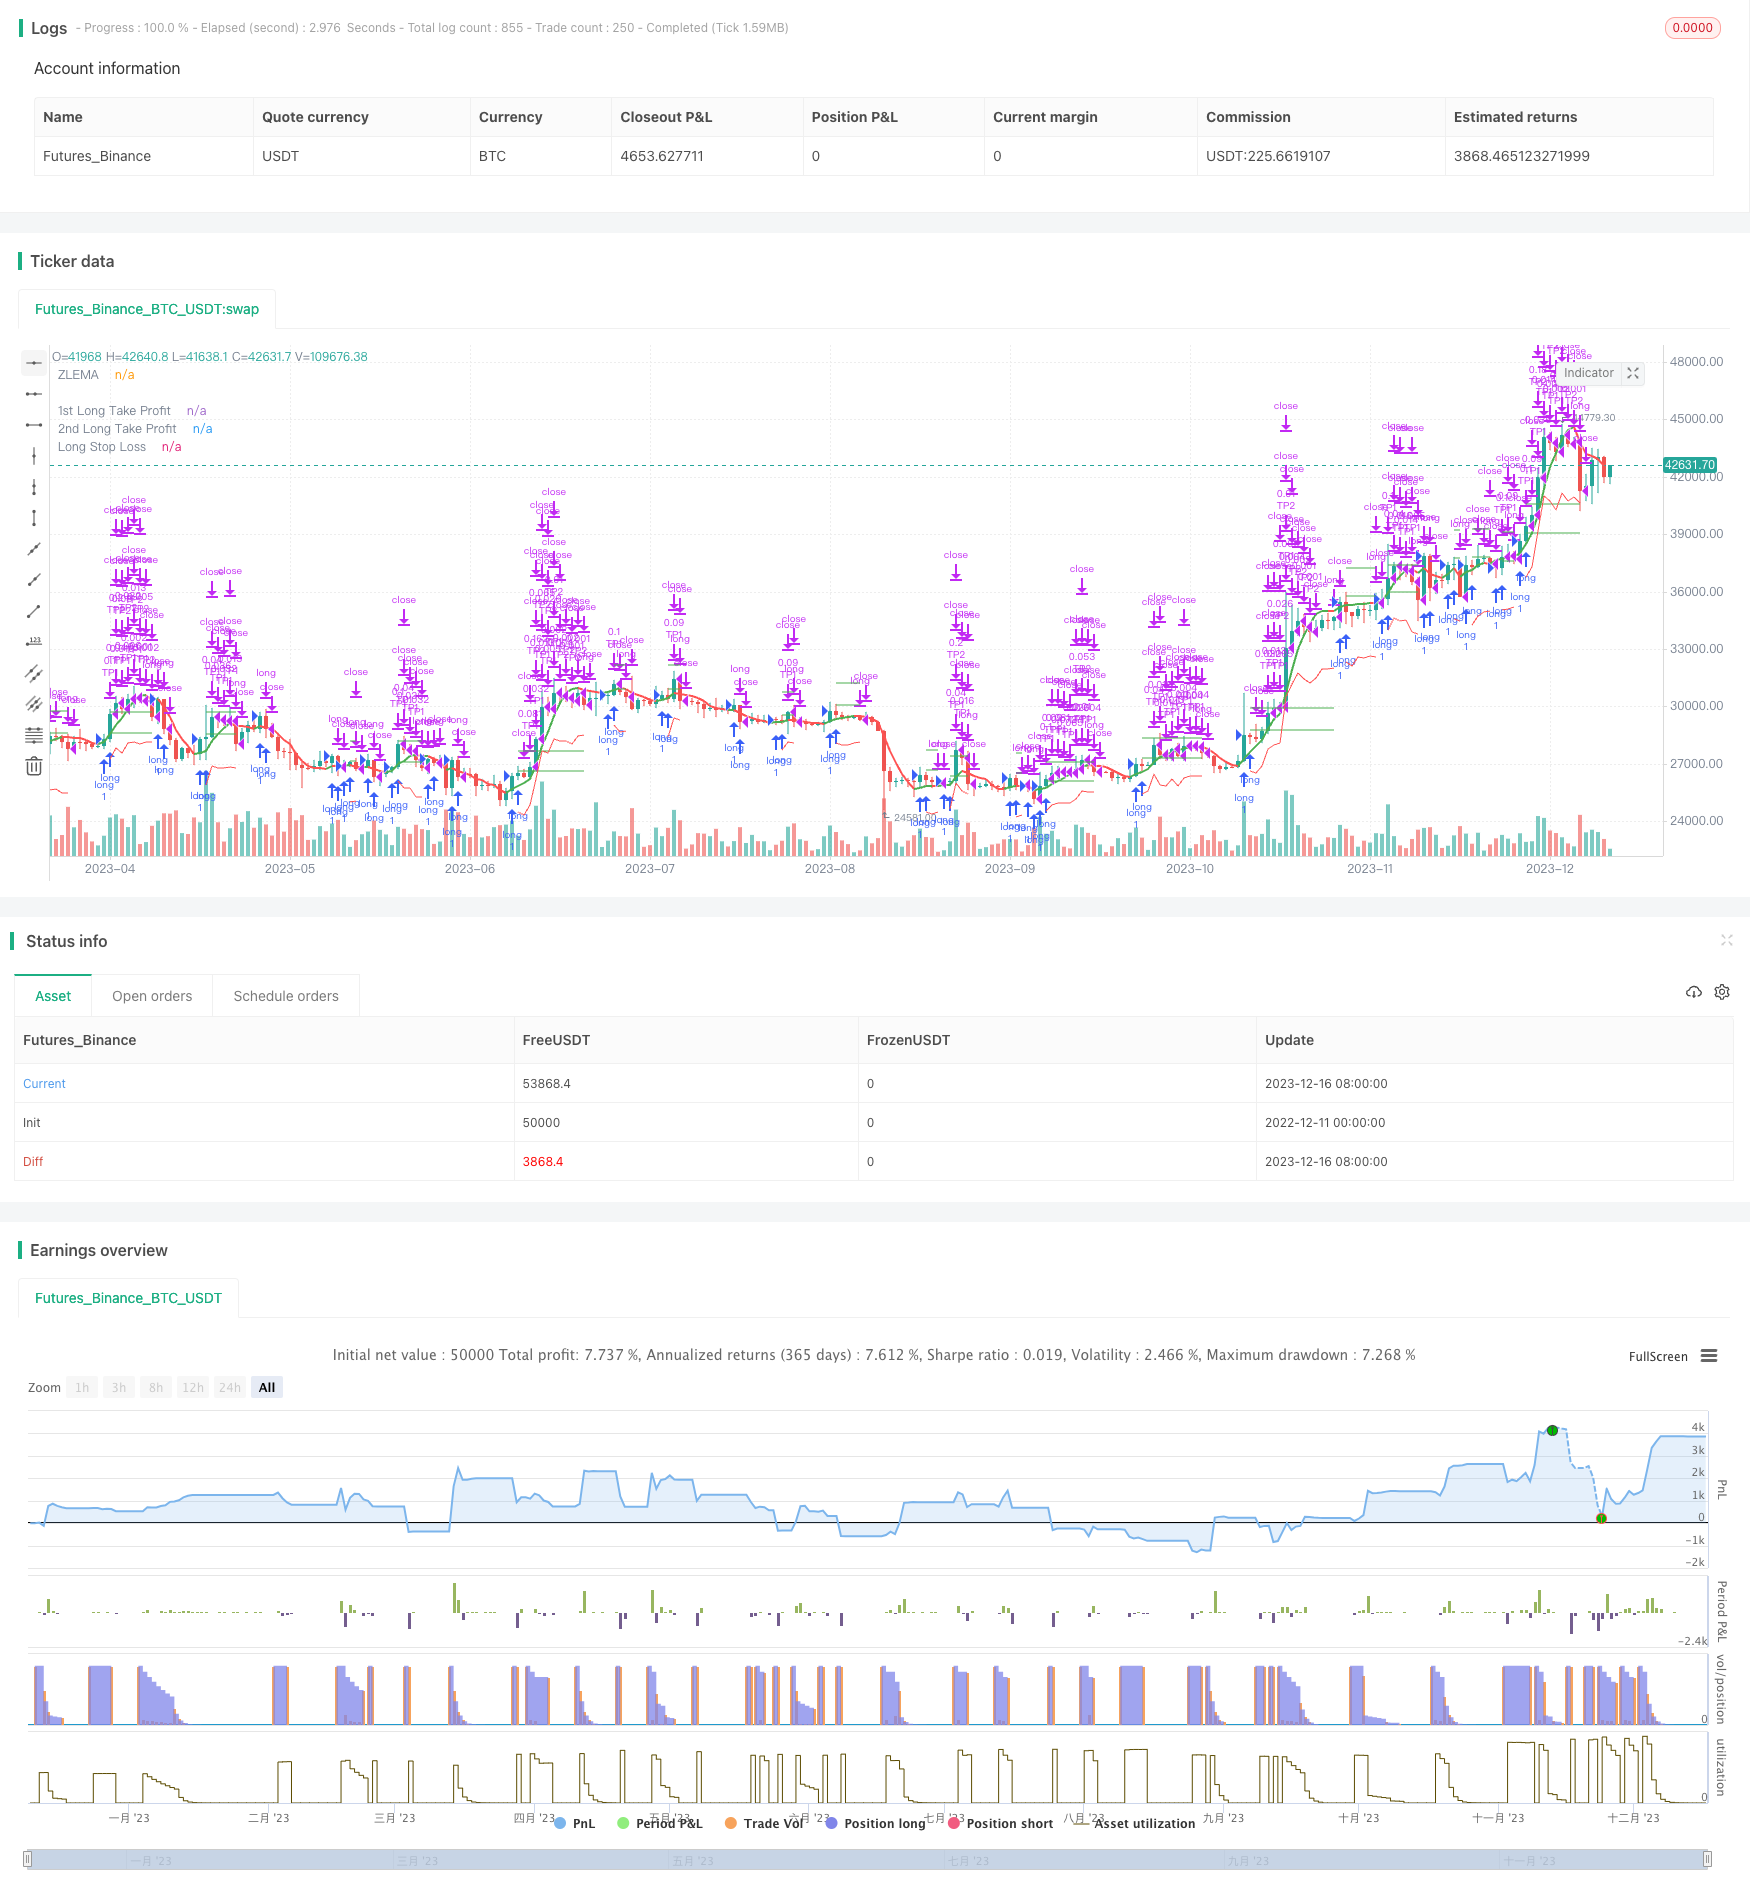 [trans]
概述
该策略是一个基于SMA均线的简单持仓策略。当短期SMA线上穿长期SMA线的时候,做多开仓;当短期SMA线下穿长期SMA线的时候,平仓。
策略原理
该策略使用两个SMA均线,一个短期的20日线,一个长期的50日线。短期线能更快捕捉价格变化趋势,长期线过滤掉短期噪音。当短期快速上行超过长期均线的时候,说明行情可能开始长期上涨,这时做多开仓。当短期下跌到长期均线下方,说明上涨趋势可能结束,这时平仓。
总的来说,该策略利用了SMA均线的曲线特征,在两个时间维度上判断价格运动趋势,采用较为稳定的持仓方式获利。
优势分析
该策略具有以下优势:
- 操作简单,容易理解,门槛低
- 利用SMA均线的优势,相对稳定
- 持仓时间长,不容易受到短期市场噪音的影响
- 可配置的参数较少,容易优化找到最佳参数组合
风险分析
该策略也存在以下风险:
- 当行情长期震荡时,止损可能较多
- SMA均线具有滞后性,不能及时捕捉价格变化
- 无法有效利用短期冲高回落行情获利
- 无法控制单笔亏损大小
优化方向
该策略还可以从以下几个方面进行优化:
- 加入MACD指标判断底部反弹的时机,以求在震荡行情中减少亏损
- 测试不同参数的SMA均线组合,寻找最优参数
- 加入境内指标判断趋势背离,提高开仓准确性
- 增加止盈止损策略,控制单笔盈亏
总结
总的来说,该SMA均线持仓策略稳定、简单,容易操作,适合初学者实盘。随着量化交易的不断发展,该策略可以引入更多指标和技术手段进行优化,从而获得更好的效果。
||
Overview
This strategy is a simple position holding strategy based on SMA lines. It goes long when the short term SMA line crosses over the long term SMA line, and closes position when the short term SMA line crosses below the long term SMA line.
Strategy Principle
The strategy uses two SMA lines, one short term 20-day line and one long term 50-day line. The short term line can catch price trend changes faster, while the long term line filters out short term noise. When the short term line rises quickly above the long term line, it indicates the trend may have started a long term upturn, so we go long here. When the short term line drops below the long term line, it suggests the uptrend may have ended, so we close position here.
In summary, this strategy utilizes the curve features of SMA lines to determine price movement trends on two time dimensions, and makes stable profits with relatively steady position holding.
Advantage Analysis
The advantages of this strategy include:
- Simple to operate, easy to understand, low barrier to use
- Relatively stable by leveraging the strengths of SMA lines
- Long holding periods, less impacted by short term market noise
- Few configurable parameters, easy to find optimal parameter combinations
Risk Analysis
The risks of this strategy include:
- More stop losses possible when prolonged range-bound markets
- SMA lines have lagging effect, cannot catch immediate price changes
- Unable to capitalize on short term spike pullback patterns
- Unable to control single trade loss size
Optimization Directions
This strategy can be further optimized in the following aspects:
- Add MACD indicator to identify bottom rebound timing for less losses during range-bound markets
- Test different SMA line parameter combinations to find optimal
- Incorporate domestic indicators for spotting trend divergence, improving entry accuracy
- Add profit taking and stop loss mechanisms to control per trade profit/loss
Summary
In summary, this SMA position holding strategy is stable, simple and easy to operate, suitable for beginner live trading. As algo trading keeps evolving, this strategy can incorporate more indicators and techniques for better performance.
[/trans]
Strategy Arguments
| Argument | Default | Description |
|---|---|---|
| v_input_1 | 14 | Length |
| v_input_2 | true | Highlight Movements ? |
| v_input_3_close | 0 | Source: close |
| v_input_float_1 | true | Long Take Profit 1 % |
| v_input_int_1 | 10 | Long Take Profit 1 Qty |
| v_input_float_2 | 5 | Long Take Profit 2% |
| v_input_int_2 | 50 | Long Take Profit 2 Qty |
| v_input_float_3 | 2.2 | SL Mutiplier |
| v_input_int_3 | 17 | ATR period |
| v_input_4 | 2022 | Backtest Start Year |
| v_input_5 | true | Backtest Start Month |
| v_input_6 | true | Backtest Start Day |
| v_input_7 | 9999 | Backtest Stop Year |
| v_input_8 | 12 | Backtest Stop Month |
| v_input_9 | 31 | Backtest Stop Day |
Source (PineScript)
/*backtest
start: 2022-12-11 00:00:00
end: 2023-12-17 00:00:00
period: 1d
basePeriod: 1h
exchanges: [{"eid":"Futures_Binance","currency":"BTC_USDT"}]
*/

//@version=5
strategy('Zlema Strateg Long 5m', overlay=true )

// FUNCTIONS

Atr(p) =>
    atr = 0.
    Tr = math.max(high - low, math.max(math.abs(high - close[1]), math.abs(low - close[1])))
    atr := nz(atr[1] + (Tr - atr[1]) / p, Tr)
    atr

// ZLEMA
length = input(title='Length', defval=14)
highlightMovements = input(title='Highlight Movements ?', defval=true)
src = input(title='Source', defval=close)

lag = math.floor((length - 1) / 2)

zlema = ta.ema(src + src - src[lag], length)

zlemaColor = highlightMovements ? zlema > zlema[1] ? color.green : color.red : #6d1e7f
plot(zlema, title='ZLEMA', linewidth=2, color=zlemaColor, transp=0)


// TAKE PROFIT AND STOP LOSS
long_tp1_inp = input.float(1, title='Long Take Profit 1 %', step=0.1) / 100
long_tp1_qty = input.int(10, title='Long Take Profit 1 Qty', step=1)

long_tp2_inp = input.float(5, title='Long Take Profit 2%', step=0.1) / 100
long_tp2_qty = input.int(50, title='Long Take Profit 2 Qty', step=1)

long_take_level_1 = strategy.position_avg_price * (1 + long_tp1_inp)
long_take_level_2 = strategy.position_avg_price * (1 + long_tp2_inp)


// Stop Loss
multiplier = input.float(2.2, 'SL Mutiplier', minval=1, step=0.1)
ATR_period = input.int(17, 'ATR period', minval=1, step=1)

// Strategy
entry_long = zlema > zlema[1]
entry_price_long = ta.valuewhen(entry_long, close, 0)
SL_floating_long = entry_price_long - multiplier * Atr(ATR_period)
exit_long = zlema < zlema[1]

///// BACKTEST PERIOD ///////
testStartYear = input(2022, 'Backtest Start Year')
testStartMonth = input(1, 'Backtest Start Month')
testStartDay = input(1, 'Backtest Start Day')
testPeriodStart = timestamp(testStartYear, testStartMonth, testStartDay, 0, 0)

testStopYear = input(9999, 'Backtest Stop Year')
testStopMonth = input(12, 'Backtest Stop Month')
testStopDay = input(31, 'Backtest Stop Day')
testPeriodStop = timestamp(testStopYear, testStopMonth, testStopDay, 0, 0)

testPeriod() =>
    time >= testPeriodStart and time <= testPeriodStop ? true : false

if testPeriod()
    strategy.entry('long', strategy.long, comment='Long', when=entry_long)
    strategy.exit('TP1', 'long', qty_percent=long_tp1_qty, limit=long_take_level_1)  //, trail_points=entry_price_long * long_trailing / syminfo.mintick, trail_offset=entry_price_long * long_trailing / syminfo.mintick)
    strategy.exit('TP2', qty_percent=long_tp2_qty, limit=long_take_level_2)  //, trail_points=entry_price_long * long_trailing / syminfo.mintick, trail_offset=entry_price_long * long_trailing / syminfo.mintick)
    strategy.close('long', when=exit_long, comment='exit long')


// LONG POSITION
plot(strategy.position_size > 0 ? long_take_level_1 : na, style=plot.style_linebr, color=color.new(color.green, 0), linewidth=1, title='1st Long Take Profit')
plot(strategy.position_size > 0 ? long_take_level_2 : na, style=plot.style_linebr, color=color.new(color.green, 0), linewidth=1, title='2nd Long Take Profit')
plot(strategy.position_size > 0 ? SL_floating_long : na, style=plot.style_linebr, color=color.new(color.red, 0), linewidth=1, title='Long Stop Loss')


if testPeriod()
    strategy.entry('long', strategy.long, comment='Long', when=entry_long)


// LONG POSITIONplot(strategy.position_size > 0 ? SL_floating_long : na, style=plot.style_linebr, color=color.new(color.red, 0), linewidth=1, title='Long Stop Loss')
Detail
https://www.fmz.com/strategy/435773
Last Modified
2023-12-18 17:44:16