
6.9 KiB
Name
均线黄金交叉1止盈策略1-Profit-Moving-Average-Cross-Strategy
Author
ChaoZhang
Strategy Description
 [trans]
概述
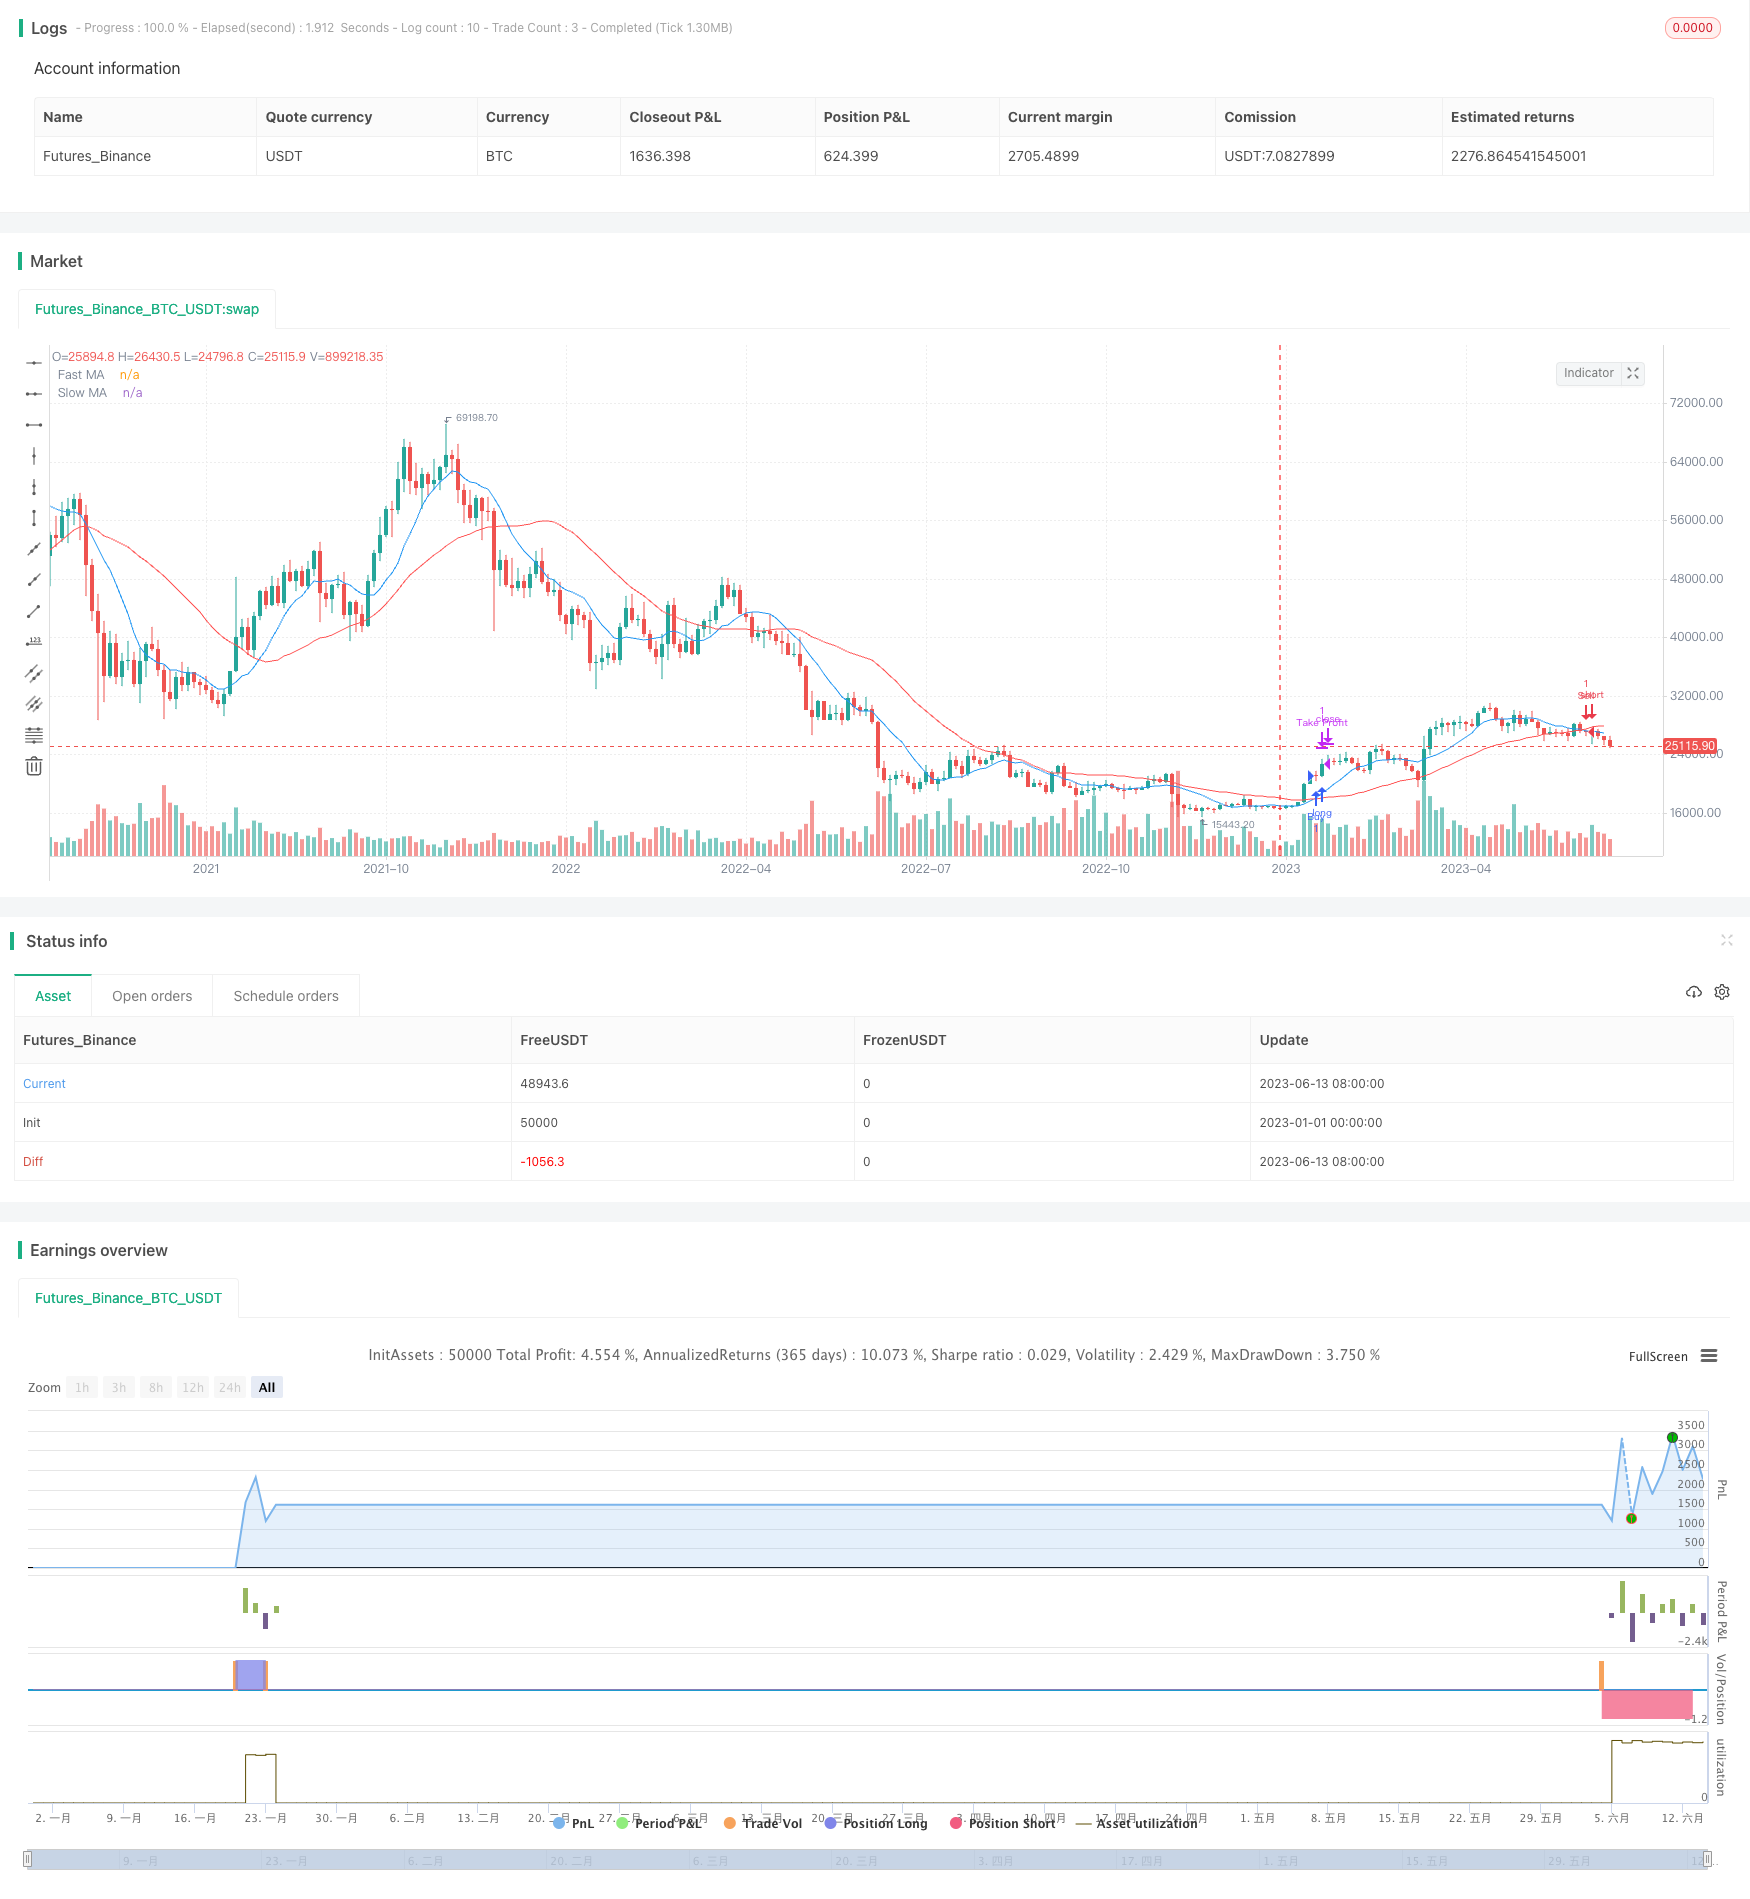
本策略通过计算快速移动平均线(Fast MA)和慢速移动平均线(Slow MA)的黄金交叉来产生买入信号。当快速移动平均线向上跨越慢速移动平均线时,就会触发买入信号。
同时,策略会在收益达到1%时止盈。这可以帮助锁定小额但稳定的利润。
该策略适合趋势比较明显的股市环境。它能抓住中短线的上升趋势,实现稳定收益。
策略原理
该策略主要基于移动平均线的黄金交叉原理。移动平均线能反映出股价的中短期趋势。当短期移动平均线上穿较长期的移动平均线时,代表股价在短期内的上涨动能强于长期趋势。这是一个较强的买入信号。
策略中的快速移动平均线长度为10天,慢速移动平均线长度为30天。这样能捕捉到一定幅度的中期趋势。当出现快速线上穿慢速线的情况时,就会触发买入信号。
此外,策略还设置了1%的止盈点。也就是说,如果持有头寸收益达到1%,就会止盈了结,锁定收益。这可以帮助避免已经开始反转的趋势带来损失。
优势分析
该策略具有以下优势:
- 使用移动平均线指标,简单易懂,容易实施。
- 快慢均线组合可以有效识别中期趋势。
- 1%的止盈点设置了固定收益目标,有利于风险控制。
这使得该策略整体来说较为稳健,在趋势明显的市场中,能够获得稳定的利润。
风险分析
该策略也存在一些风险:
- 当市场没有明显趋势时,容易产生错误信号和频繁止损。
- 不能有效处理复杂的非趋势性市场。
- 没有止损设置,容易遭遇巨大亏损。
这些风险可以通过以下方法加以控制:
- 增加其他指标的组合,如布林线,KDJ等,提高信号的准确性。
- 动态调整移动平均线的参数,适应市场变化。
- 加入合理的止损点,控制单笔亏损。
优化方向
该策略可以从以下方面进行优化:
- 测试更多的快速线和慢速线的参数组合,寻找最佳配比。
- 加入止损点。比如在买入后评估亏损达到3%时止损。
- 结合其他技术指标,如MACD,KDJ等,形成多因子模型,提高信号准确性。
- 使用自动参数优化方法寻找最优参数组合。
总结
该策略整体来说是一个典型的移动均线策略。通过快慢均线组合识别中期趋势,配合1%止盈点锁定稳定利润。优点是简单易行,能抓住一定幅度的股市上涨趋势。缺点是对复杂行情的适应性较差。如果结合更多技术指标和止损机制的优化,该策略可以获得更稳健的绩效。
||
Overview
This strategy generates buy signals when a fast moving average (Fast MA) crosses above a slow moving average (Slow MA).
It also takes profit when the returns reach 1% to lock in small but consistent profits.
The strategy works well in trending markets with clear trends. It can capture medium-term up trends and achieve steady profits.
Strategy Logic
The strategy is based on the golden cross of moving averages. Moving averages reflect the medium-term trend of stock prices. When the short-term MA crosses above the longer-term MA, it signals that the short-term upward momentum is stronger than the long-term trend. This is a strong buy signal.
The fast MA in this strategy has a length of 10 days and the slow MA is 30 days. This can capture reasonable trend movements. A long signal is triggered when the fast MA crosses above the slow MA.
The strategy also sets a 1% take profit point. Positions will be closed when the returns hit 1% to lock in profits. This helps avoid losses from trend reversals.
Strength Analysis
The strengths of this strategy are:
- Simple to understand and implement with moving average indicators.
- Fast and slow MA combo effective at identifying medium-term trends.
- 1% profit target controls risks and locks in consistent gains.
Overall the strategy is quite robust and can achieve steady profits in trending markets.
Risk Analysis
There are also some risks to consider:
- More whipsaws and stop loss triggers in range-bound markets without clear trends.
- Ineffective in complex non-trending markets.
- No stop loss so vulnerable to huge sudden losses in volatile markets.
To address these risks:
- Add other indicators like Bollinger Bands, KDJ for better signal accuracy.
- Dynamically adjust MA parameters to adapt to changing market conditions.
- Add reasonable stop loss points to control downside on losing trades.
Optimization Opportunities
Some ways to optimize this strategy:
- Test more fast and slow MA parameter combinations to find optimal settings.
- Add stop loss. For example, cut loss when trade drops 3%.
- Combine with other indicators like MACD, KDJ to form multifactor models and improve signal accuracy.
- Utilize auto-optimization methods to find the best parameter combinations.
Conclusion
The strategy is a typical moving average crossover system. It identifies medium-term trends using fast and slow MA, taking 1% profit along the way. Strengths include simplicity and the ability to ride uptrends for steady gains. Weakness is poorer adaptation to complex, volatile markets. By optimizing with more indicators and stop loss mechanisms, the strategy can achieve more robust performance.
[/trans]
Strategy Arguments
| Argument | Default | Description |
|---|---|---|
| v_input_1 | 10 | Fast MA Length |
| v_input_2 | 30 | Slow MA Length |
| v_input_3 | true | Profit Percentage |
Source (PineScript)
/*backtest
start: 2023-01-01 00:00:00
end: 2023-06-15 00:00:00
period: 3d
basePeriod: 1d
exchanges: [{"eid":"Futures_Binance","currency":"BTC_USDT"}]
*/

// This source code is subject to the terms of the Mozilla Public License 2.0 at https://mozilla.org/MPL/2.0/
// © pleasantHead5366

//@version=4
strategy("1% Profit Strategy", overlay=true)

// Input parameters
fastLength = input(10, title="Fast MA Length")
slowLength = input(30, title="Slow MA Length")
profitPercentage = input(1, title="Profit Percentage")

// Calculate moving averages
fastMA = sma(close, fastLength)
slowMA = sma(close, slowLength)

// Plot moving averages on the chart
plot(fastMA, color=color.blue, title="Fast MA")
plot(slowMA, color=color.red, title="Slow MA")

// Trading logic
longCondition = crossover(fastMA, slowMA)
if (longCondition)
    strategy.entry("Buy", strategy.long)

// Close long position when profit reaches 1%
if (strategy.position_size > 0)
    strategy.exit("Take Profit", from_entry="Buy", profit=profitPercentage / 100)

// Plot Buy and Sell signals on the chart
shortCondition = crossunder(fastMA, slowMA)
if (shortCondition)
    strategy.entry("Sell", strategy.short)
Detail
https://www.fmz.com/strategy/434445
Last Modified
2023-12-06 13:53:36