
9.3 KiB
Name
均线金叉死叉策略Cross-Moving-Average-Strategy
Author
ChaoZhang
Strategy Description
 [trans]
概述
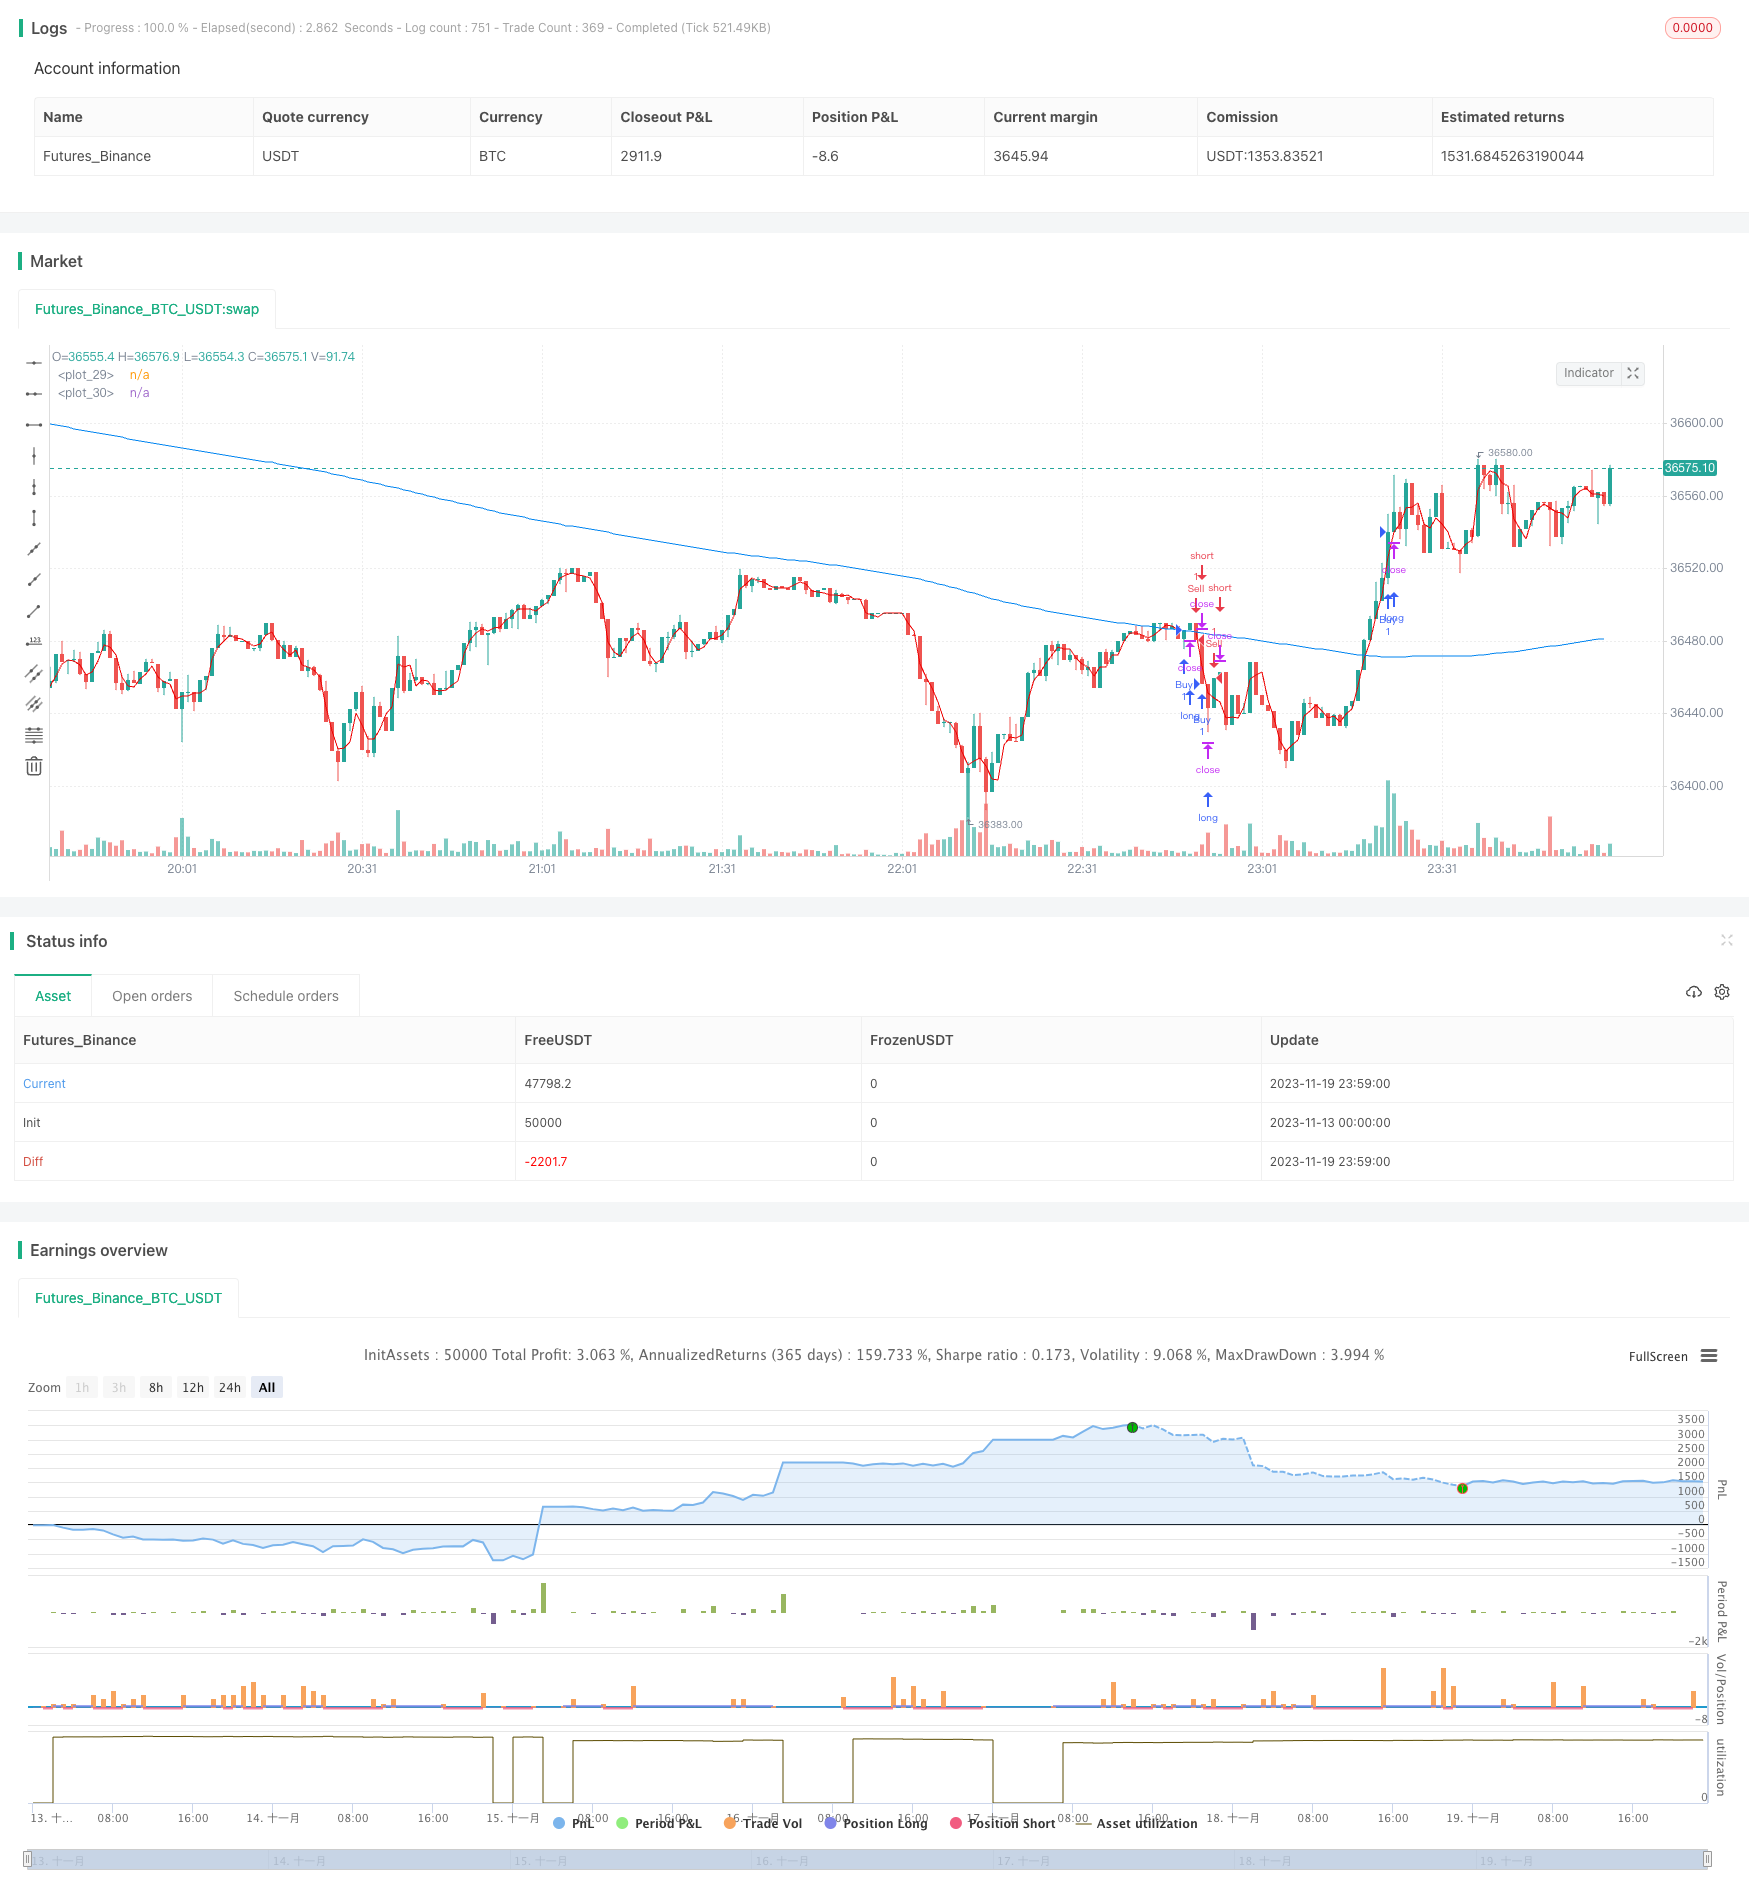
该策略通过计算快速移动平均线和慢速移动平均线的金叉死叉,来判断入场和出场时机。当快速线从下方上穿慢速线时,做多;当快速线从上方下穿慢速线时,做空。
策略原理
该策略主要基于移动平均线的金叉死叉原理。计算一条长度为3的快速移动平均线,以及一条长度为266的慢速移动平均线。当快速线从下方上穿慢速线时产生买入信号;当快速线从上方下穿慢速线时产生卖出信号。收到信号后第三根K线发出入场委托。
这个策略判断趋势的基础在于,价格上涨时,短期移动平均线更快速地上移;价格下跌时,短期移动平均线更快速地下移。因此,短期快线和长期慢线之间会产生穿越。
优势分析
该策略最大的优势在于,通过计算不同长度周期的移动平均线,并利用它们之间的金叉死叉关系来判断趋势转折点。相比单一的移动平均线等指标,能更准确地捕捉价格转折。
首先,快速移动平均线能更敏感地捕捉价格变化,慢速移动平均线则起到滤波噪音的作用,能有效识别趋势方向。两条均线配合使用,避免产生错误信号。
其次,该策略采用了滞后入场方式,即信号产生后第三根K线入场。这可以进一步避免由于均线震荡而产生的错误交易。
再者,参数选取合理简单,仅仅依靠两条移动平均线即可完成判断,无需计算繁复的指标,降低了过度优化的可能性。
风险分析
尽管该策略无明显缺陷和风险,但实盘使用时仍需要注意几点:
首先,仅仅依靠移均这一趋势判断指标,可能错过其他指标判断出的入场机会。可以考虑适当增加备选指标,综合判断。
其次,在强势趋势中,价格可能会长期运行在快线之上或之下。这时就会出现长期不产生信号的情况。需要调整参数,让快线更贴近价格。
再次,指标参数并非百分之百可靠,不同品种和周期下最优参数也会有所不同。需要根据实盘反馈不断测试和优化。
最后,对交易手数、止损点和止盈点也需要做好精确评估,避免亏损过大或未及时止盈。
优化方向
该策略还有几个主要的优化方向:
第一,可以考虑在金叉死叉的同时,增加其他辅助指标的判断逻辑。例如RSI指标显示超买超卖时,进一步确认交易信号。
第二,参数优化至关重要。可以综合考虑周期、交易品种等因素,通过历史回测和模拟实盘的方法,不断测试和调整参数,使策略更加适应市场环境。
第三,优化入场方式。除了简单的第三K线入场,可以研究滞后’N’根K线入场、价差进场、突破新高新低进场等方式,具体情况根据品种和周期微调。
最后,完善止损止盈方式同样重要。可以结合波动率ATR指标,实时调整止盈止损幅度。另外,移动止损、分批止盈等方式也值得考虑。这些都将大幅提高策略盈利率。
总结
该策略运用移动平均线金叉死叉判断价格未来方向的经典原理,通过合理参数设定产生交易信号,并采用滞后入场以及止损止盈方法控制风险,是一个简单实用的量化交易策略。在优化指标参数、完善指标体系、调整入场出场逻辑等多个方面都具有进一步改进的潜力。
||
Overview
This strategy judges entry and exit points by calculating the golden cross and death cross between fast and slow moving average lines. It goes long when the fast line crosses above the slow line, and goes short when the fast line crosses below the slow line.
Principles
The strategy is mainly based on the golden cross and death cross principles of moving averages. It calculates a fast moving average line with a length of 3 and a slow moving average line with a length of 266. A buy signal is generated when the fast line crosses above the slow line, and a sell signal is generated when the fast line crosses below the slow line. It enters the market on the third candlestick after the signal is received.
The basis for this strategy to judge the trend is that when prices rise, the short-term moving average line moves up faster; when prices fall, the short-term moving average line moves down faster. Thus crossovers between the short-term fast line and the long-term slow line will occur.
Advantage Analysis
The biggest advantage of this strategy is that it uses the golden cross and death cross relationship between moving averages of different cycle lengths to determine trend reversal points. Compared with a single moving average line and other indicators, it can more accurately capture price turns.
Firstly, the fast moving average line can more sensitively capture price changes, while the slow moving average line plays the role of filtering out noise and can effectively identify the trend direction. The two lines work together to avoid generating false signals.
Secondly, the strategy adopts a lagged entry method, i.e. entering the market on the third candlestick after the signal is generated. This can further avoid wrong trades caused by moving average oscillations.
Moreover, the parameter selection is reasonable and simple. It only relies on two moving average lines to complete the judgment, without calculating complex indicators, thus reducing the possibility of over-optimization.
Risk Analysis
Although the strategy has no obvious flaws and risks, several points still need to be noted when used for live trading:
Firstly, relying solely on the moving average as the trend judging indicator may miss trading opportunities identified by other indicators. It is advisable to appropriately include alternative indicators for combined judgment.
Secondly, in a strong trend, prices may run for a long time above or below the fast line. This will result in long periods without signal generation. Parameters need to be adjusted to make the fast line closer to prices.
Also, indicator parameters are not 100% reliable. The optimal parameters may vary across different products and cycle periods. Continual testing and optimization based on live trading feedback are necessities.
Lastly, accurate assessment on trading size, stop loss and take profit levels is also important to avoid excessive losses or failure to take profits timely.
Optimization Directions
There are several major optimization directions for this strategy:
Firstly, consider adding judgment logics from other auxiliary indicators together with golden crosses and death crosses. For example, further confirm trading signals when RSI indicator shows overbought or oversold conditions.
Secondly, parameter optimization is crucial. Comprehensive considerations can be given to cycle, product variety and other factors. Keep testing and adjusting parameters through historical backtests and demo trading to make the strategy more adaptive to market conditions.
Thirdly, optimize entry methods. Apart from simple third candlestick entry, study lagging entry after ‘N’ candlesticks, price spread entry, breakout entry, etc. Details should be fine tuned according to different products and cycle periods.
Lastly, improving stop loss and take profit methods is equally important. Indicators like ATR can be used to dynamically adjust levels of stop loss and take profit. Moreover, trailing stop loss, partial profit taking and other techniques are also worth studying. These will greatly improve the strategy’s profitability.
Conclusion
The strategy utilizes the classic principle of using moving average golden crosses and death crosses to determine future price direction. By reasonably setting parameters to generate trading signals and adopting lagging entry and stop loss/take profit methods to control risks, it is a simple, practical quantitative trading strategy. There remains much potential for further improvement in areas like indicator parameter optimization, indicator system enhancement, entry/exit logic adjustment, etc.
[/trans]
Source (PineScript)
/*backtest
start: 2023-11-13 00:00:00
end: 2023-11-20 00:00:00
period: 1m
basePeriod: 1m
exchanges: [{"eid":"Futures_Binance","currency":"BTC_USDT"}]
*/

//@version=4
strategy("Cruzamento de Médias Móveis", overlay=true)

// Definir os parâmetros da estratégia
length_fast = 3
length_slow = 266
price = close
take_profit = 10000.0
stop_loss = 2000.0

// Calcular as médias móveis
fast_ma = vwma(price, length_fast)
slow_ma = sma(price, length_slow)

// Definir as condições de entrada
buy_signal = crossover(fast_ma, slow_ma)
sell_signal = crossunder(fast_ma, slow_ma)

// Enviar ordens de negociação com base nas condições de entrada
if (buy_signal[3]) // Verifica se o sinal de compra ocorreu 3 velas atrás
    strategy.entry("Buy", strategy.long)
    strategy.exit("Sell", "Buy", profit=take_profit, loss=stop_loss)

if (sell_signal[3]) // Verifica se o sinal de venda ocorreu 3 velas atrás
    strategy.entry("Sell", strategy.short)
    strategy.exit("Cover", "Sell", profit=take_profit, loss=stop_loss)

// Plotar as médias móveis no gráfico
plot(fast_ma, color=color.rgb(238, 0, 0))
plot(slow_ma, color=color.rgb(0, 132, 240))
Detail
https://www.fmz.com/strategy/432773
Last Modified
2023-11-21 13:33:20