
7.7 KiB
Name
均线穿越RSI金叉死叉交易策略SMA-Crossing-RSI-Golden-Cross-Death-Cross-Trading-Strategy
Author
ChaoZhang
Strategy Description
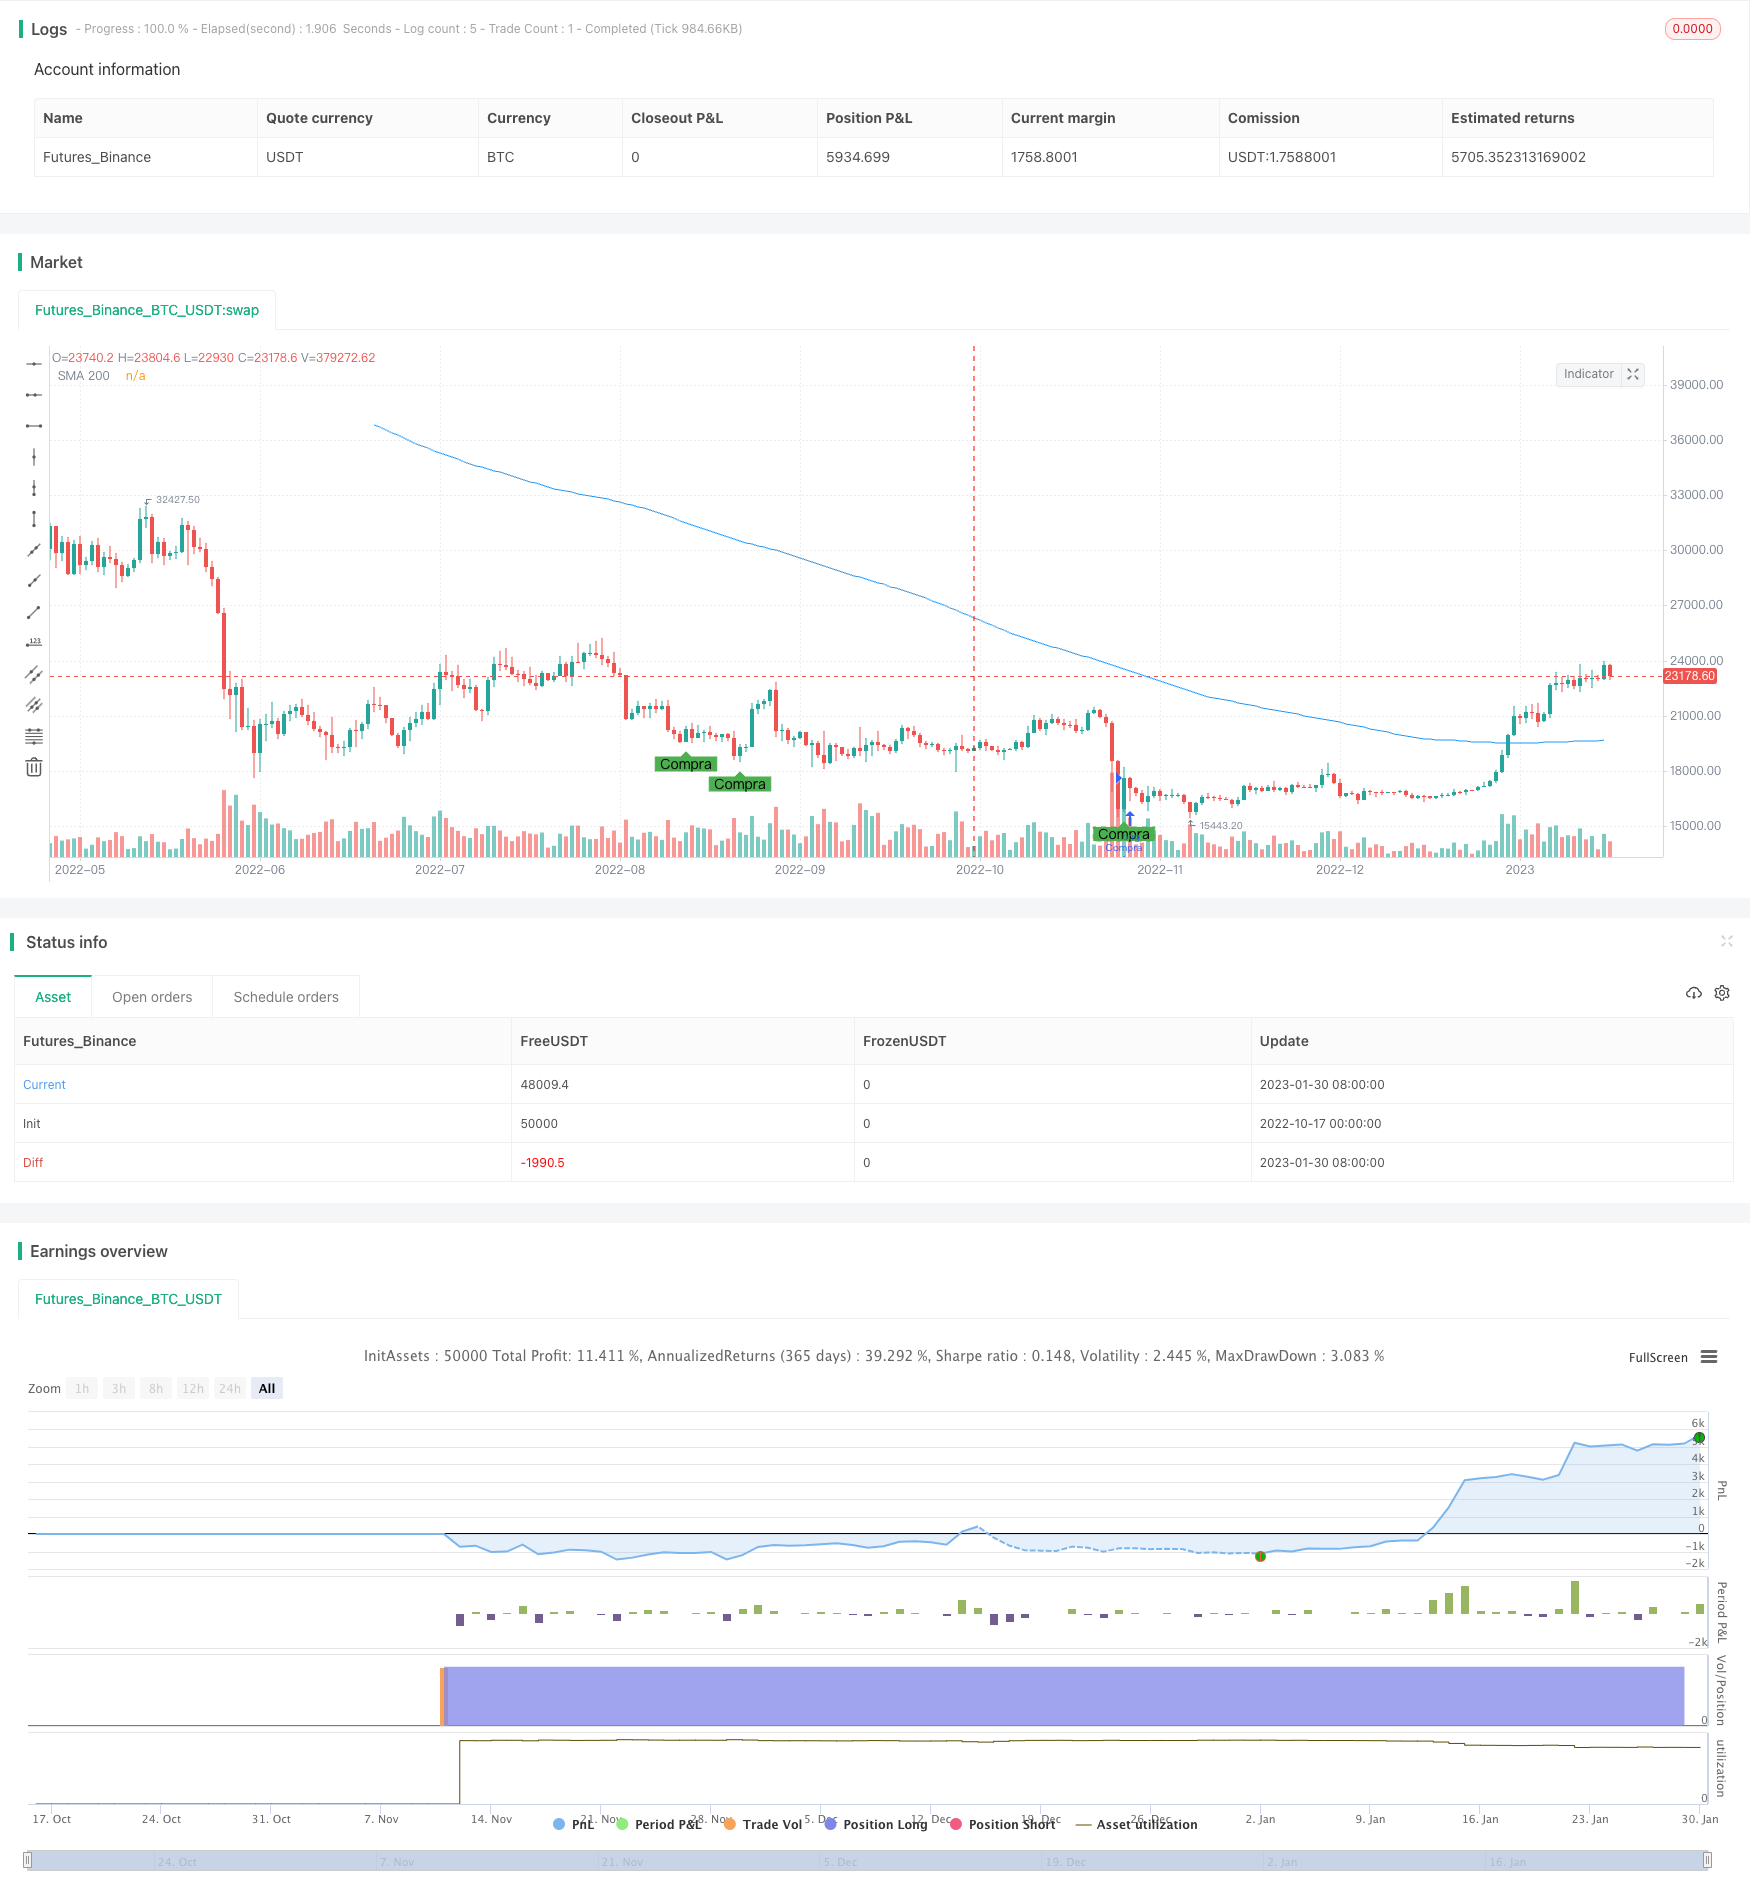
[trans]
概述
该策略结合了移动平均线和相对强弱指标RSI,通过均线的方向和RSI的高低位置形成交易信号,属于典型的趋势跟踪策略。它旨在通过RSI指标识别价值低估和价值高估的时机,与均线方向结合,在趋势开始阶段构建头寸。
策略原理
该策略主要基于两个指标:
-
简单移动平均线SMA:计算一定周期内的收盘价平均值,判断价格趋势方向。
-
相对强弱指数RSI:通过比较一段时间内的平均收盘涨幅和平均收盘跌幅,来判断目前股价是否被高估或低估。RSI高于70为超买区,低于30为超卖区。
策略逻辑:
-
当收盘价低于SMA均线,并且RSI指标从超卖区域下破时,产生买入信号。
-
当收盘价高于SMA均线,并且RSI指标从超卖区域上破时,产生卖出信号。
该策略结合均线判断大趋势方向,与RSI判断超买超卖区域,在趋势开始阶段构建头寸。RSI高低位置可有效识别短期内的价值高低,与均线方向组合使用,可产生较低风险的交易信号。
优势分析
该策略具有以下优势:
-
结合趋势和价值判断,降低错误交易概率,信号较为可靠。
-
RSI指标参数优化后,可有效识别超买超卖范围。
-
SMA参数优化后,可准确判断大趋势方向。
-
交易策略规则简单清晰,容易理解实现,适合新手学习。
-
可在不同品种和周期上应用,适用面广。
-
可通过调整SMA和RSI参数,优化策略表现。
风险分析
该策略也存在以下风险:
-
SMA均线生成滞后,可能错过趋势开始的最佳机会。可以适当缩短均线周期或使用EMA。
-
RSI超买超卖区域可能设置不当,导致信号不准。可以测试优化RSI参数。
-
背离信号可能预示趋势反转,需要警惕。
-
震荡行情中会产生错误信号和止损,可考虑降低仓位。
-
仅基于SMA和RSI,其他因素未考虑,可引入更多指标优化。
优化方向
该策略可从以下几个方面进行优化:
-
测试不同SMA周期参数,选择产生更准确信号的周期。
-
测试RSI超买超卖区域参数设置,确定最佳参数。
-
增加其他指标判断,如MACD、布林带等,提高信号准确率。
-
增加止损策略,控制单笔损失。
-
评估增加仓位管理策略,如固定份额等,控制整体风险。
-
评估在不同品种和周期的效果,寻找最佳适用场景。
-
增加对背离信号的判断逻辑,以识别趋势反转。
总结
该策略整体来说是一个典型的趋势跟踪策略,结合趋势判断和超买超卖判定,可以获取较低风险的交易信号。通过参数优化和规则完善,可以进一步增强策略稳定性和可靠性。但是任何策略都无法完美,需要投资者结合自己的风险偏好和资金实力进行评估。总的来说,该策略适合有一定交易经验的投资者作为趋势交易的辅助工具。
||
Overview
This strategy combines moving average and relative strength index RSI to generate trading signals based on the direction of MA and the level of RSI. It belongs to a typical trend following strategy. It aims to identify undervalued and overvalued opportunities through RSI and combine with MA direction to establish positions at the beginning of trends.
Strategy Logic
The strategy is mainly based on two indicators:
-
Simple Moving Average SMA: Calculates the average closing price over a certain period to determine the price trend.
-
Relative Strength Index RSI: Compares the average gain and average loss over a period to determine if the current price is overbought or oversold. RSI above 70 is overbought zone and below 30 is oversold zone.
Strategy rules:
-
When close is below SMA and RSI crosses below overbought zone, a buy signal is generated.
-
When close is above SMA and RSI crosses above oversold zone, a sell signal is generated.
The strategy combines MA to determine the major trend and RSI to identify overbought and oversold levels, establishing positions at the beginning of trends. RSI high-low levels effectively identify short-term overvaluation and undervaluation. Combining with MA direction generates relatively low-risk trading signals.
Advantage Analysis
The strategy has the following advantages:
-
Combining trend and value analysis reduces incorrect trades and makes signals more reliable.
-
Optimized RSI parameters can effectively identify overbought and oversold levels.
-
Optimized SMA parameters accurately determine the major trend.
-
Simple and clear trading rules, easy to understand and implement, suitable for beginners.
-
Can be applied to different products and timeframes, wide applicability.
-
Can optimize strategy performance by adjusting SMA and RSI parameters.
Risk Analysis
The strategy also has the following risks:
-
SMA may lag and miss the best timing at the beginning of trends. Can consider shorter SMA period or use EMA.
-
RSI overbought and oversold levels may be improperly set, leading to inaccurate signals. Can test and optimize RSI parameters.
-
Divergence may signal trend reversal, need to be alert.
-
Whipsaws may generate wrong signals and stop loss in ranging markets. Can consider lowering position size.
-
Based solely on SMA and RSI, other factors not considered. Can introduce more indicators.
Optimization Directions
The strategy can be optimized in the following aspects:
-
Test different SMA periods to find the one that generates more accurate signals.
-
Test RSI overbought/oversold parameter settings to determine optimal values.
-
Add other indicators like MACD, Bollinger Bands to improve signal accuracy.
-
Add stop loss to control loss per trade.
-
Evaluate position sizing strategies like fixed percentage to manage overall risk.
-
Assess performance across different products and timeframes to find optimal scenarios.
-
Add logic for divergence to identify trend reversal.
Conclusion
Overall this is a typical trend following strategy. Combining trend and overbought/oversold analysis provides relatively low risk trading signals. Further improvements through parameter optimization and rule refinement can enhance stability and reliability. However no strategy is perfect and needs evaluation based on risk preference and capital. Generally this strategy suits experienced investors as an auxiliary tool for trend trading.
[/trans]
Source (PineScript)
/*backtest
start: 2022-10-17 00:00:00
end: 2023-01-31 00:00:00
period: 1d
basePeriod: 1h
exchanges: [{"eid":"Futures_Binance","currency":"BTC_USDT"}]
*/

//@version=4
strategy("Meu Robo com MA e RSI (Regras Específicas)", overlay=true)

// Configuração da Média Móvel
lengthMA = 200
sma200 = sma(close, lengthMA)

// Configuração do RSI
lengthRSI = 14
rsiValue = rsi(close, lengthRSI)
overBought = 70
overSold = 30

// Condições para compra
longCondition = close < sma200 and crossover(rsiValue, overSold)
if (longCondition)
    strategy.entry("Compra", strategy.long)

// Condições para venda
shortCondition = close > sma200 and crossunder(rsiValue, overBought)
if (shortCondition)
    strategy.close("Compra")

// Plot das Médias Móveis e sinais
plot(sma200, title="SMA 200", color=color.blue)
plotshape(series=longCondition, title="Sinal de Compra", location=location.belowbar, color=color.green, style=shape.labelup, text="Compra")
plotshape(series=shortCondition, title="Sinal de Venda", location=location.abovebar, color=color.red, style=shape.labeldown, text="Venda")
Detail
https://www.fmz.com/strategy/430039
Last Modified
2023-10-24 14:33:51