
8.6 KiB
Name
均线交叉趋势捕捉与K线突破智能择时策略-Moving-Average-Crossover-and-Candlestick-Pattern-Smart-Timing-Strategy
Author
ChaoZhang
Strategy Description
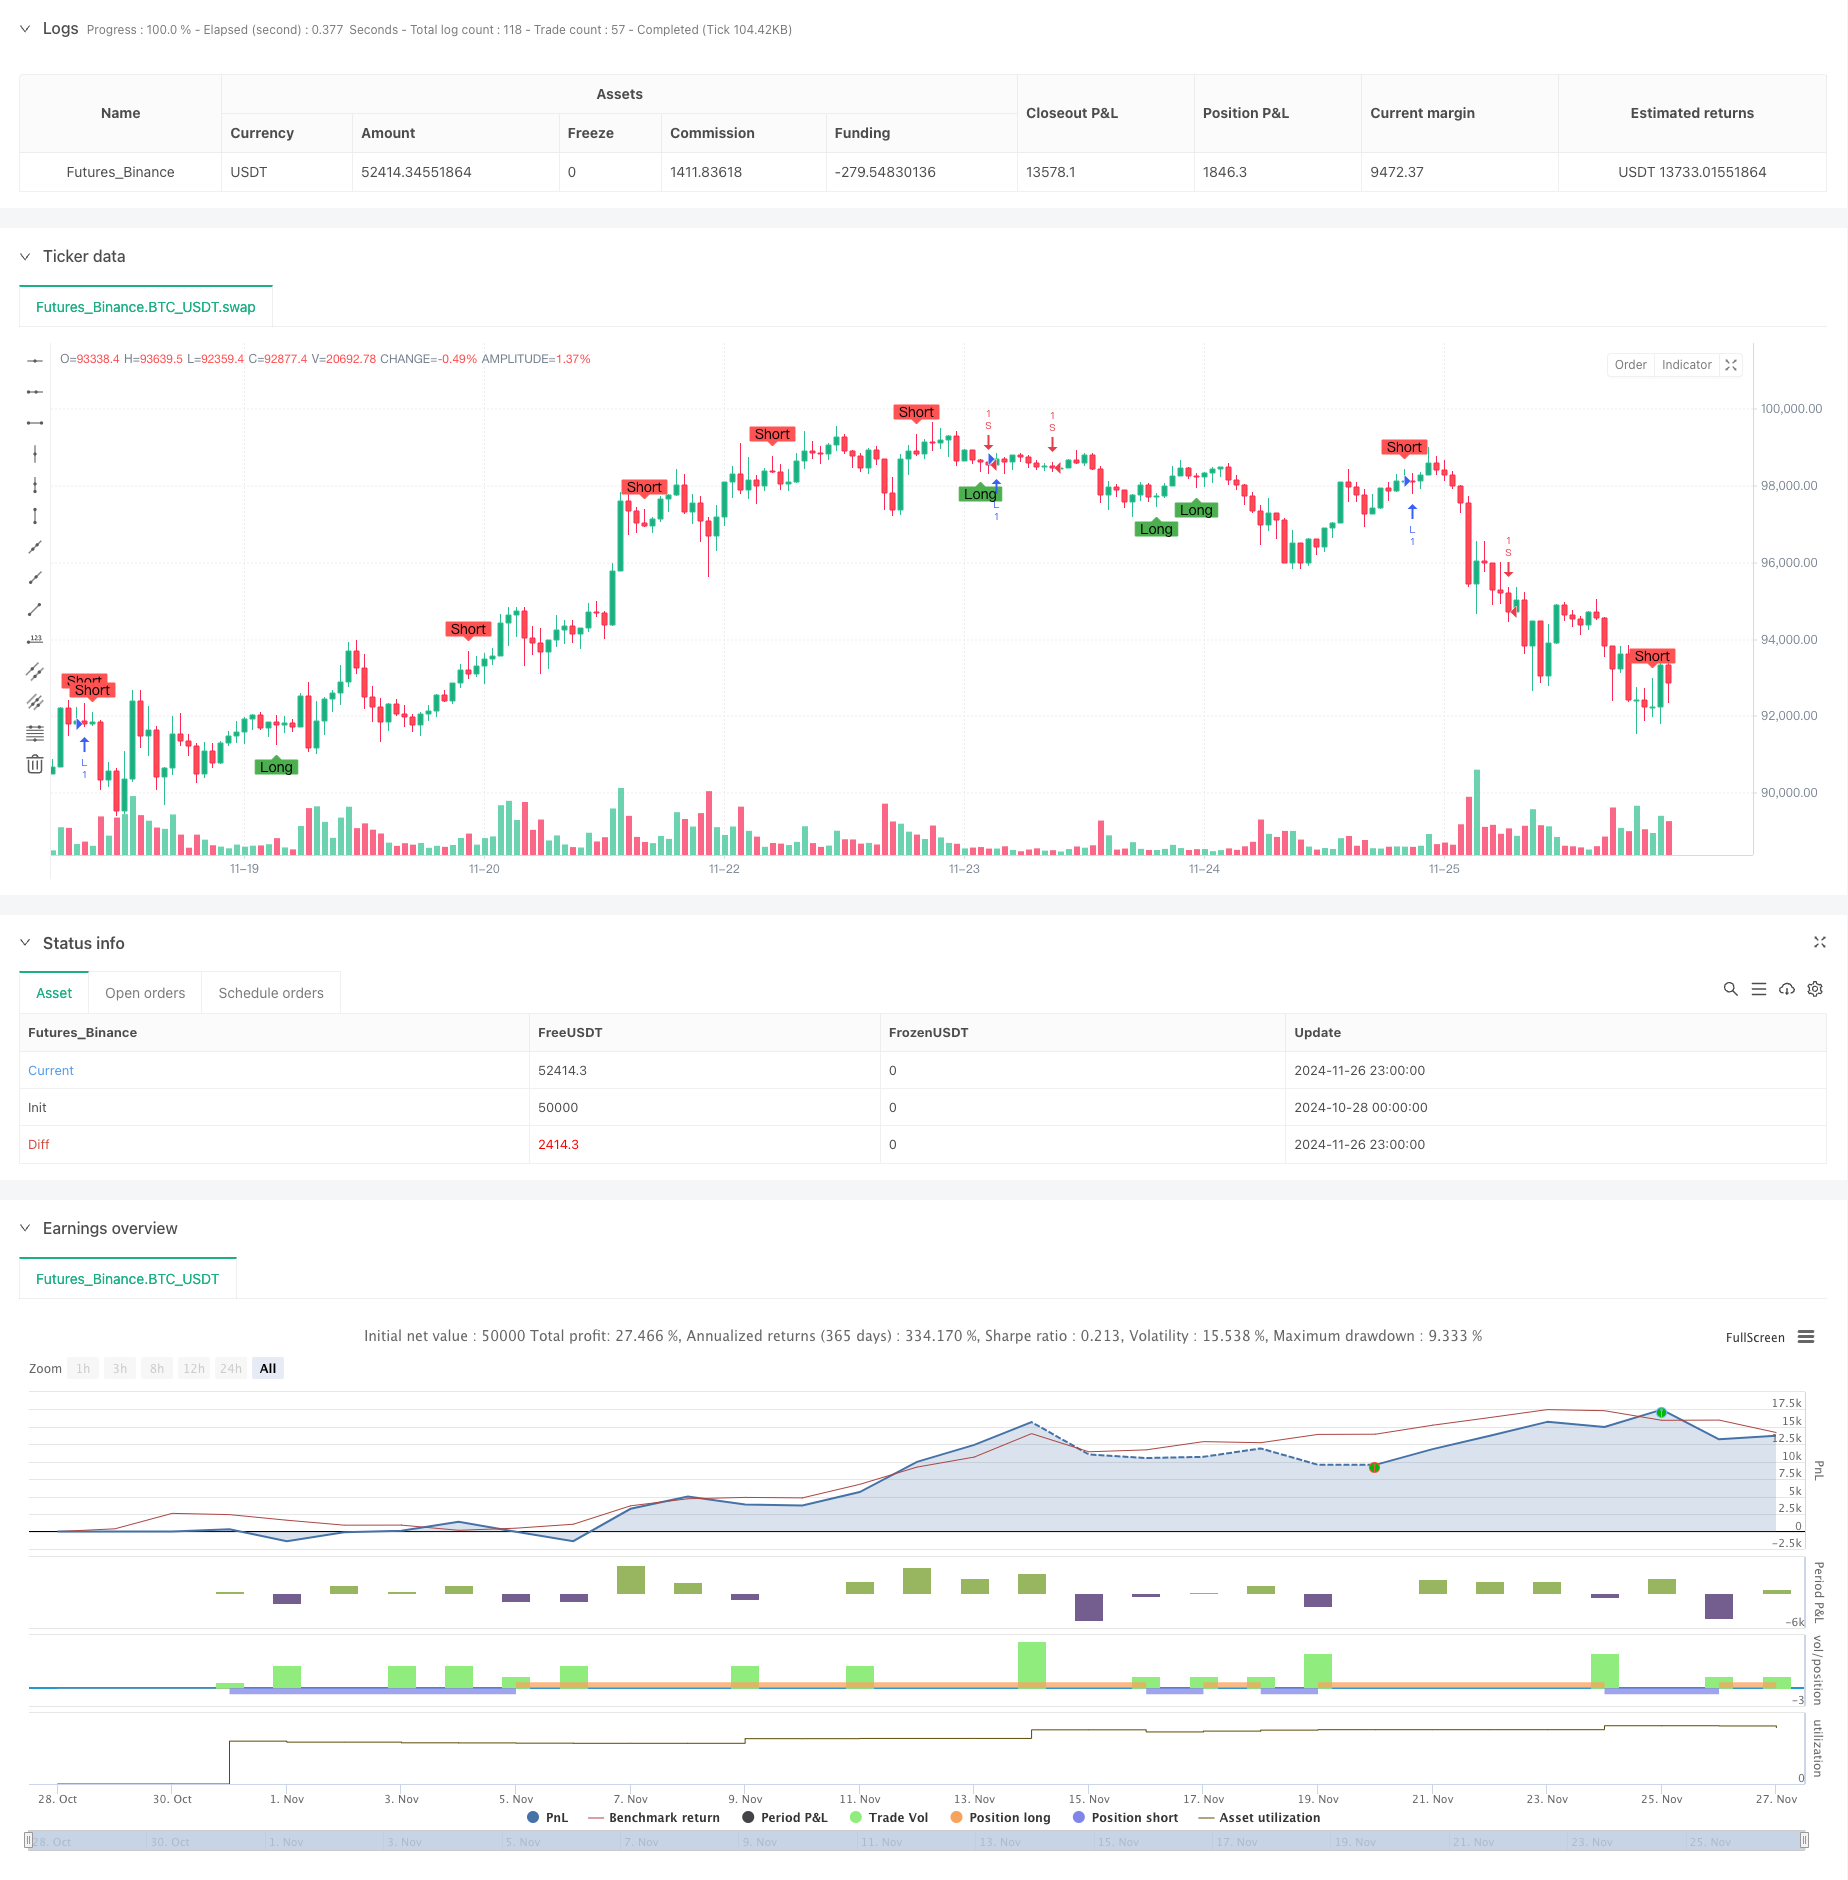
[trans]
概述
该策略是一个结合了技术分析中经典的均线交叉和K线形态识别的智能交易系统。策略通过分析K线的上下影线与实体的关系,结合双均线交叉信号,实现对市场趋势转折点的精准捕捉。系统不仅关注价格走势,还通过计算平均波幅来动态调整交易参数,提高策略的适应性。
策略原理
策略的核心逻辑分为两个主要部分:
-
K线形态识别模块通过计算上下影线与实体的比例关系来识别潜在的反转信号。系统设定了可调节的影线倍数参数(wickMultiplier)和实体百分比参数(bodyPercentage)用于优化信号质量。当K线出现符合条件的长上影线或长下影线时,系统会发出相应的做多或做空信号。
-
双均线交叉系统采用了14周期和28周期的简单移动平均线(SMA)作为趋势指示器。当短期均线向上穿越长期均线时,系统产生做多信号;当短期均线向下穿越长期均线时,系统产生做空信号。
策略优势
- 信号筛选严格: 通过设置影线倍数和实体百分比阈值,有效过滤掉低质量信号
- 参数可调性强: 提供了灵活的参数调节接口,便于根据不同市场环境优化策略表现
- 趋势跟踪与反转信号结合: 既能捕捉趋势行情,又不错过重要的反转机会
- 风险控制完善: 通过计算50周期的平均波幅来动态调整交易参数,提高策略的稳定性
策略风险
- 参数敏感性: 不同的参数设置可能导致策略表现差异较大,需要经过充分的参数优化
- 市场环境依赖: 在震荡市场中可能产生过多假信号,增加交易成本
- 滑点影响: 在流动性较差的市场中,可能面临较大的滑点风险
- 信号延迟: 均线系统存在一定的滞后性,可能错过最佳入场时机
策略优化方向
- 引入成交量指标: 通过分析成交量变化来确认反转信号的有效性
- 优化参数动态调整机制: 根据市场波动率自动调整影线倍数和实体百分比参数
- 增加趋势强度过滤: 结合RSI或ADX等指标来过滤弱势市场中的信号
- 完善止损机制: 基于ATR指标设计动态止损位置,提高风险控制的精确度
总结
该策略通过结合K线形态识别和均线交叉系统,构建了一个相对完整的交易决策框架。策略的优势在于其严格的信号筛选机制和灵活的参数调节能力,但同时也需要注意参数优化和市场环境适应性的问题。通过持续优化和完善,该策略有望在不同市场环境下都能保持稳定的表现。 ||
Overview
This strategy is an intelligent trading system that combines classical technical analysis tools including moving average crossovers and candlestick pattern recognition. The strategy identifies potential market turning points by analyzing the relationship between candlestick shadows and bodies, while incorporating dual moving average crossover signals. The system not only focuses on price trends but also calculates average ranges to dynamically adjust trading parameters for improved adaptability.
Strategy Principles
The core logic consists of two main components:
-
The candlestick pattern recognition module identifies potential reversal signals by calculating the ratio between shadows and bodies. The system includes adjustable parameters for shadow multiplier (wickMultiplier) and body percentage (bodyPercentage) to optimize signal quality. When a candlestick displays qualifying long upper or lower shadows, the system generates corresponding long or short signals.
-
The dual moving average crossover system utilizes 14-period and 28-period Simple Moving Averages (SMA) as trend indicators. Long signals are generated when the short-term MA crosses above the long-term MA, while short signals occur when the short-term MA crosses below the long-term MA.
Strategy Advantages
- Strict Signal Filtering: Effectively filters out low-quality signals through shadow multiplier and body percentage thresholds
- Strong Parameter Adaptability: Provides flexible parameter adjustment interfaces for optimizing strategy performance across different market conditions
- Combines Trend Following and Reversal Signals: Captures both trending markets and important reversal opportunities
- Comprehensive Risk Control: Utilizes 50-period average range calculations to dynamically adjust trading parameters for enhanced stability
Strategy Risks
- Parameter Sensitivity: Different parameter settings may lead to significant performance variations, requiring thorough optimization
- Market Environment Dependency: May generate excessive false signals in ranging markets, increasing trading costs
- Slippage Impact: Potential for significant slippage in markets with poor liquidity
- Signal Delay: Moving average systems have inherent lag, possibly missing optimal entry points
Strategy Optimization Directions
- Incorporate Volume Indicators: Analyze volume changes to confirm reversal signal validity
- Enhance Dynamic Parameter Adjustment: Automatically adjust shadow multiplier and body percentage parameters based on market volatility
- Add Trend Strength Filtering: Integrate RSI or ADX indicators to filter signals in weak market conditions
- Improve Stop-Loss Mechanism: Design dynamic stop-loss positions based on ATR indicator for more precise risk control
Summary
This strategy constructs a relatively complete trading decision framework by combining candlestick pattern recognition with moving average crossover systems. Its strengths lie in strict signal filtering mechanisms and flexible parameter adjustment capabilities, while attention must be paid to parameter optimization and market environment adaptability. Through continuous optimization and refinement, the strategy shows potential for maintaining stable performance across various market conditions.[/trans]
Source (PineScript)
/*backtest
start: 2024-10-28 00:00:00
end: 2024-11-27 00:00:00
period: 1h
basePeriod: 1h
exchanges: [{"eid":"Futures_Binance","currency":"BTC_USDT"}]
*/

//@version=5 indicator("Wick Reversal Setup", overlay=true)

// Input parameters
wickMultiplier = input.float(3.5, title="Wick Multiplier", minval=0.5, maxval=20)
bodyPercentage = input.float(0.25, title="Body Percentage", minval=0.1, maxval=1.0)

// Calculate the average range over 50 periods
avgRange = ta.sma(high - low, 50)

// Define the lengths of wicks and bodies
bodyLength = math.abs(close - open)
upperWickLength = high - math.max(close, open)
lowerWickLength = math.min(close, open) - low
totalRange = high - low

// Long signal conditions
longSignal = (close > open and upperWickLength >= bodyLength * wickMultiplier and upperWickLength <= totalRange * bodyPercentage) or
             (close < open and lowerWickLength >= bodyLength * wickMultiplier and upperWickLength <= totalRange * bodyPercentage) or
             (close == open and close != high and upperWickLength >= bodyLength * wickMultiplier and upperWickLength <= totalRange * bodyPercentage) or
             (open == high and close == high and totalRange >= avgRange)

// Short signal conditions
shortSignal = (close < open and (high - open) >= bodyLength * wickMultiplier and lowerWickLength <= totalRange * bodyPercentage) or
              (close > open and (high - close) >= bodyLength * wickMultiplier and lowerWickLength <= totalRange * bodyPercentage) or
              (close == open and close != low and lowerWickLength >= bodyLength * wickMultiplier and lowerWickLength <= totalRange * bodyPercentage) or
              (open == low and close == low and totalRange >= avgRange)

// Plot signals
plotshape(series=longSignal, location=location.belowbar, color=color.green, style=shape.labelup, text="Long")
plotshape(series=shortSignal, location=location.abovebar, color=color.red, style=shape.labeldown, text="Short")
// This Pine Script™ code is subject to the terms of the Mozilla Public License 2.0 at https://mozilla.org/MPL/2.0/
// © Sahaj_Beriwal

//@version=5
strategy("My strategy", overlay=true, margin_long=100, margin_short=100)

longCondition = ta.crossover(ta.sma(close, 14), ta.sma(close, 28))
if (longCondition)
    strategy.entry("L", strategy.long)

shortCondition = ta.crossunder(ta.sma(close, 14), ta.sma(close, 28))
if (shortCondition)
    strategy.entry("S", strategy.short)
Detail
https://www.fmz.com/strategy/473269
Last Modified
2024-11-28 17:18:29