
8.2 KiB
Name
均线交叉移动止盈止损策略-Moving-Average-Crossover-with-Trailing-Stop-Loss-Strategy
Author
ChaoZhang
Strategy Description
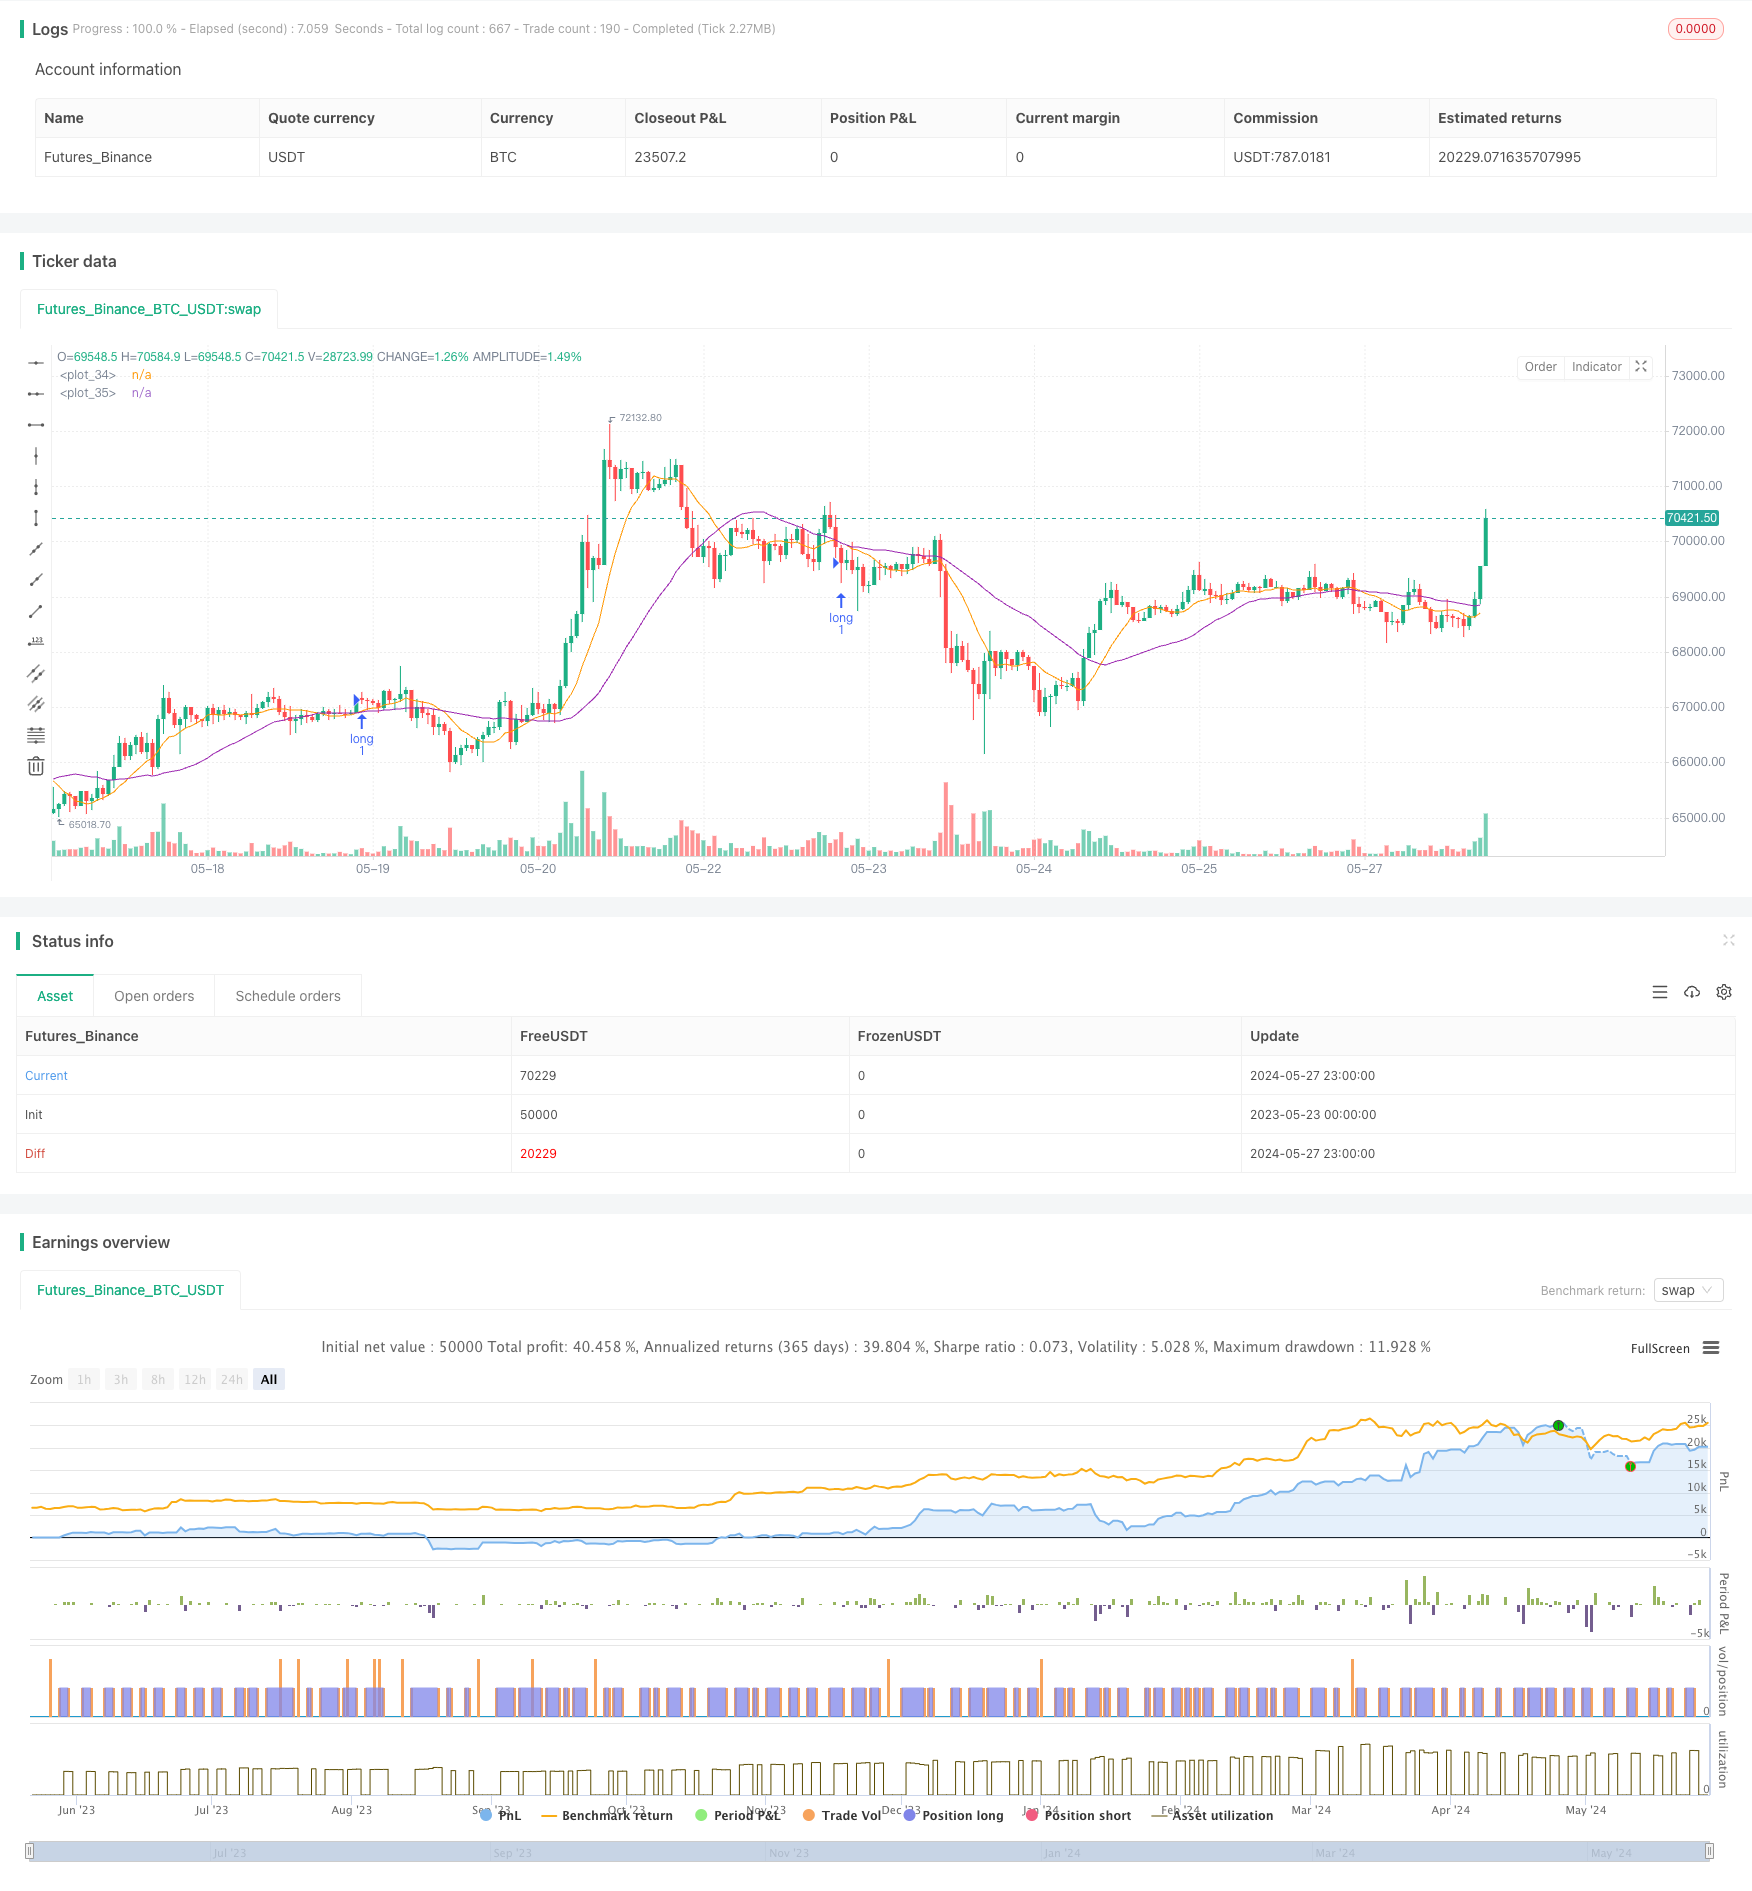
[trans]
概述
该策略使用两条不同周期的简单移动平均线(SMA)来捕捉价格趋势,并利用相对强弱指数(RSI)和平均真实波幅(ATR)指标来优化交易信号和风险管理。当短期SMA上穿长期SMA时产生买入信号,反之产生卖出信号。同时,该策略采用移动止盈止损方法,根据价格走势动态调整止盈和止损位置,以更好地保护利润和控制风险。
策略原理
- 计算两条不同周期的SMA,默认周期为10和30。
- 当短期SMA上穿长期SMA时,产生买入信号;当短期SMA下穿长期SMA时,产生卖出信号。
- 在买入时,根据当前收盘价设置止损位和止盈位,默认止损位为收盘价下方2个单位,止盈位为收盘价上方6个单位。
- 持仓过程中,根据价格走势动态调整止盈位,以更好地保护利润。
- 使用14周期的RSI指标和ATR指标辅助判断市场趋势和波动性,优化交易信号。
策略优势
- 简单易懂:该策略基于经典的均线交叉原理,逻辑清晰,易于理解和实现。
- 趋势跟踪:通过两条不同周期的SMA,有效捕捉市场的中长期趋势,适应不同的市场环境。
- 动态止盈止损:采用移动止盈止损方法,根据价格走势实时调整止盈和止损位置,既能保护利润,又能控制风险。
- 多指标协同:结合RSI和ATR指标,更全面地评估市场趋势和波动性,提高交易信号的可靠性。
策略风险
- 参数优化风险:SMA周期、止盈止损位置等参数需要根据不同市场和品种进行优化,不当的参数设置可能导致策略表现欠佳。
- 震荡市风险:在震荡市场环境下,频繁的交易信号可能导致过度交易和资金快速损耗。
- 趋势转折风险:当市场趋势发生转折时,该策略可能出现连续亏损的情况。
策略优化方向
- 动态参数优化:根据市场变化,实时调整SMA周期、止盈止损位置等关键参数,提高策略的适应性。
- 信号过滤:引入其他技术指标或市场情绪指标,对交易信号进行二次确认,减少误判和过度交易。
- 仓位管理:根据市场波动性和账户风险承受能力,动态调整仓位大小,控制单笔交易风险。
- 多品种协同:将该策略应用于多个相关品种,通过品种间的相关性对冲,降低整体组合风险。
总结
均线交叉移动止盈止损策略是一个基于经典技术分析原理的量化交易策略,通过两条不同周期的SMA捕捉市场趋势,并采用移动止盈止损方法动态控制风险。同时,该策略还结合了RSI和ATR指标,以更全面地评估市场状态。尽管该策略逻辑清晰,易于实现,但在实际应用中仍需注意参数优化、震荡市风险和趋势转折风险等问题。未来可以从动态参数优化、信号过滤、仓位管理和多品种协同等方面对策略进行优化,以提高其稳定性和盈利能力。
||
Overview
This strategy uses two Simple Moving Averages (SMAs) with different periods to capture price trends and incorporates the Relative Strength Index (RSI) and Average True Range (ATR) indicators to optimize trade signals and risk management. A buy signal is generated when the short-term SMA crosses above the long-term SMA, and a sell signal is generated when the opposite occurs. The strategy employs a trailing stop loss method, dynamically adjusting the take profit and stop loss levels based on price movements to better protect profits and control risks.
Strategy Principle
- Calculate two SMAs with different periods, defaulting to 10 and 30.
- Generate a buy signal when the short-term SMA crosses above the long-term SMA, and a sell signal when the short-term SMA crosses below the long-term SMA.
- Upon buying, set the stop loss and take profit levels based on the current closing price, defaulting to 2 units below and 6 units above the closing price, respectively.
- Dynamically adjust the take profit level during the holding period to better protect profits based on price movements.
- Use the 14-period RSI and ATR indicators to assist in assessing market trends and volatility, optimizing trade signals.
Strategy Advantages
- Simplicity: The strategy is based on the classic moving average crossover principle, with clear logic and easy to understand and implement.
- Trend following: By using two SMAs with different periods, the strategy effectively captures medium to long-term market trends and adapts to various market environments.
- Dynamic stop loss and take profit: The trailing stop loss method dynamically adjusts the take profit and stop loss levels based on price movements, protecting profits while controlling risks.
- Multi-indicator synergy: Combining RSI and ATR indicators provides a more comprehensive assessment of market trends and volatility, improving the reliability of trade signals.
Strategy Risks
- Parameter optimization risk: SMA periods, take profit and stop loss levels, and other parameters need to be optimized for different markets and instruments. Improper parameter settings may lead to poor strategy performance.
- Choppy market risk: In choppy market conditions, frequent trade signals may result in overtrading and rapid capital depletion.
- Trend reversal risk: When market trends reverse, the strategy may experience consecutive losses.
Strategy Optimization Directions
- Dynamic parameter optimization: Dynamically adjust key parameters such as SMA periods and take profit/stop loss levels based on market changes to improve the strategy's adaptability.
- Signal filtering: Introduce additional technical indicators or market sentiment indicators for secondary confirmation of trade signals, reducing misjudgments and overtrading.
- Position sizing: Dynamically adjust position sizes based on market volatility and account risk tolerance to control single trade risk.
- Multi-instrument synergy: Apply the strategy to multiple related instruments and use inter-instrument correlations for hedging to reduce overall portfolio risk.
Summary
The Moving Average Crossover with Trailing Stop Loss Strategy is a quantitative trading strategy based on classic technical analysis principles. It captures market trends using two SMAs with different periods and dynamically controls risk using a trailing stop loss method. The strategy also incorporates RSI and ATR indicators for a more comprehensive assessment of market conditions. Although the strategy has clear logic and is easy to implement, it is essential to consider issues such as parameter optimization, choppy market risk, and trend reversal risk in practical applications. Future optimizations can focus on dynamic parameter optimization, signal filtering, position sizing, and multi-instrument synergy to improve the strategy's stability and profitability. [/trans]
Source (PineScript)
/*backtest
start: 2023-05-23 00:00:00
end: 2024-05-28 00:00:00
period: 1h
basePeriod: 15m
exchanges: [{"eid":"Futures_Binance","currency":"BTC_USDT"}]
*/

//@version=5
// suitable for : AMZN - 30 minutes, MSFT - 30 minutes, NVDA -15 minutes

strategy("AAPL-SIMPLE_SMA", overlay=true)

// Create Indicator's

// Create Indicator's
shortSMA = ta.sma(close, 10)
longSMA = ta.sma(close, 30)
rsi = ta.rsi(close, 14)
atr = ta.atr(14)
qty = 1

// Specify crossover conditions
longCondition = ta.crossover(shortSMA, longSMA)
shortCondition = ta.crossunder(shortSMA, longSMA)

// // Execute trade if condition is True
if (longCondition)
    stopLoss = close -2
    // stopLoss=1
    takeProfit = close +6

    action = "buy"
    strategy.entry("long", strategy.long, qty=qty)
    // strategy.exit("exit", "long", stop=stopLoss, limit=takeProfit)
    strategy.exit("exit", "long",  limit=takeProfit)
    alert('{"TICKER":"'+syminfo.ticker+'","ACTION":"'+action+'","PRICE":"'+str.tostring(close)+'","STOPLOSS":"'+str.tostring(stopLoss)+'","TAKEPROFIT":"'+str.tostring(takeProfit)+'","QTY":"'+str.tostring(qty)+'"}')


plot(shortSMA)
plot(longSMA, color=color.purple)
Detail
https://www.fmz.com/strategy/452821
Last Modified
2024-05-29 17:02:19