
6.8 KiB
Name
均线交叉牛市支撑带策略-EMA-SMA-Crossover-Bull-Market-Support-Band-Strategy
Author
ChaoZhang
Strategy Description
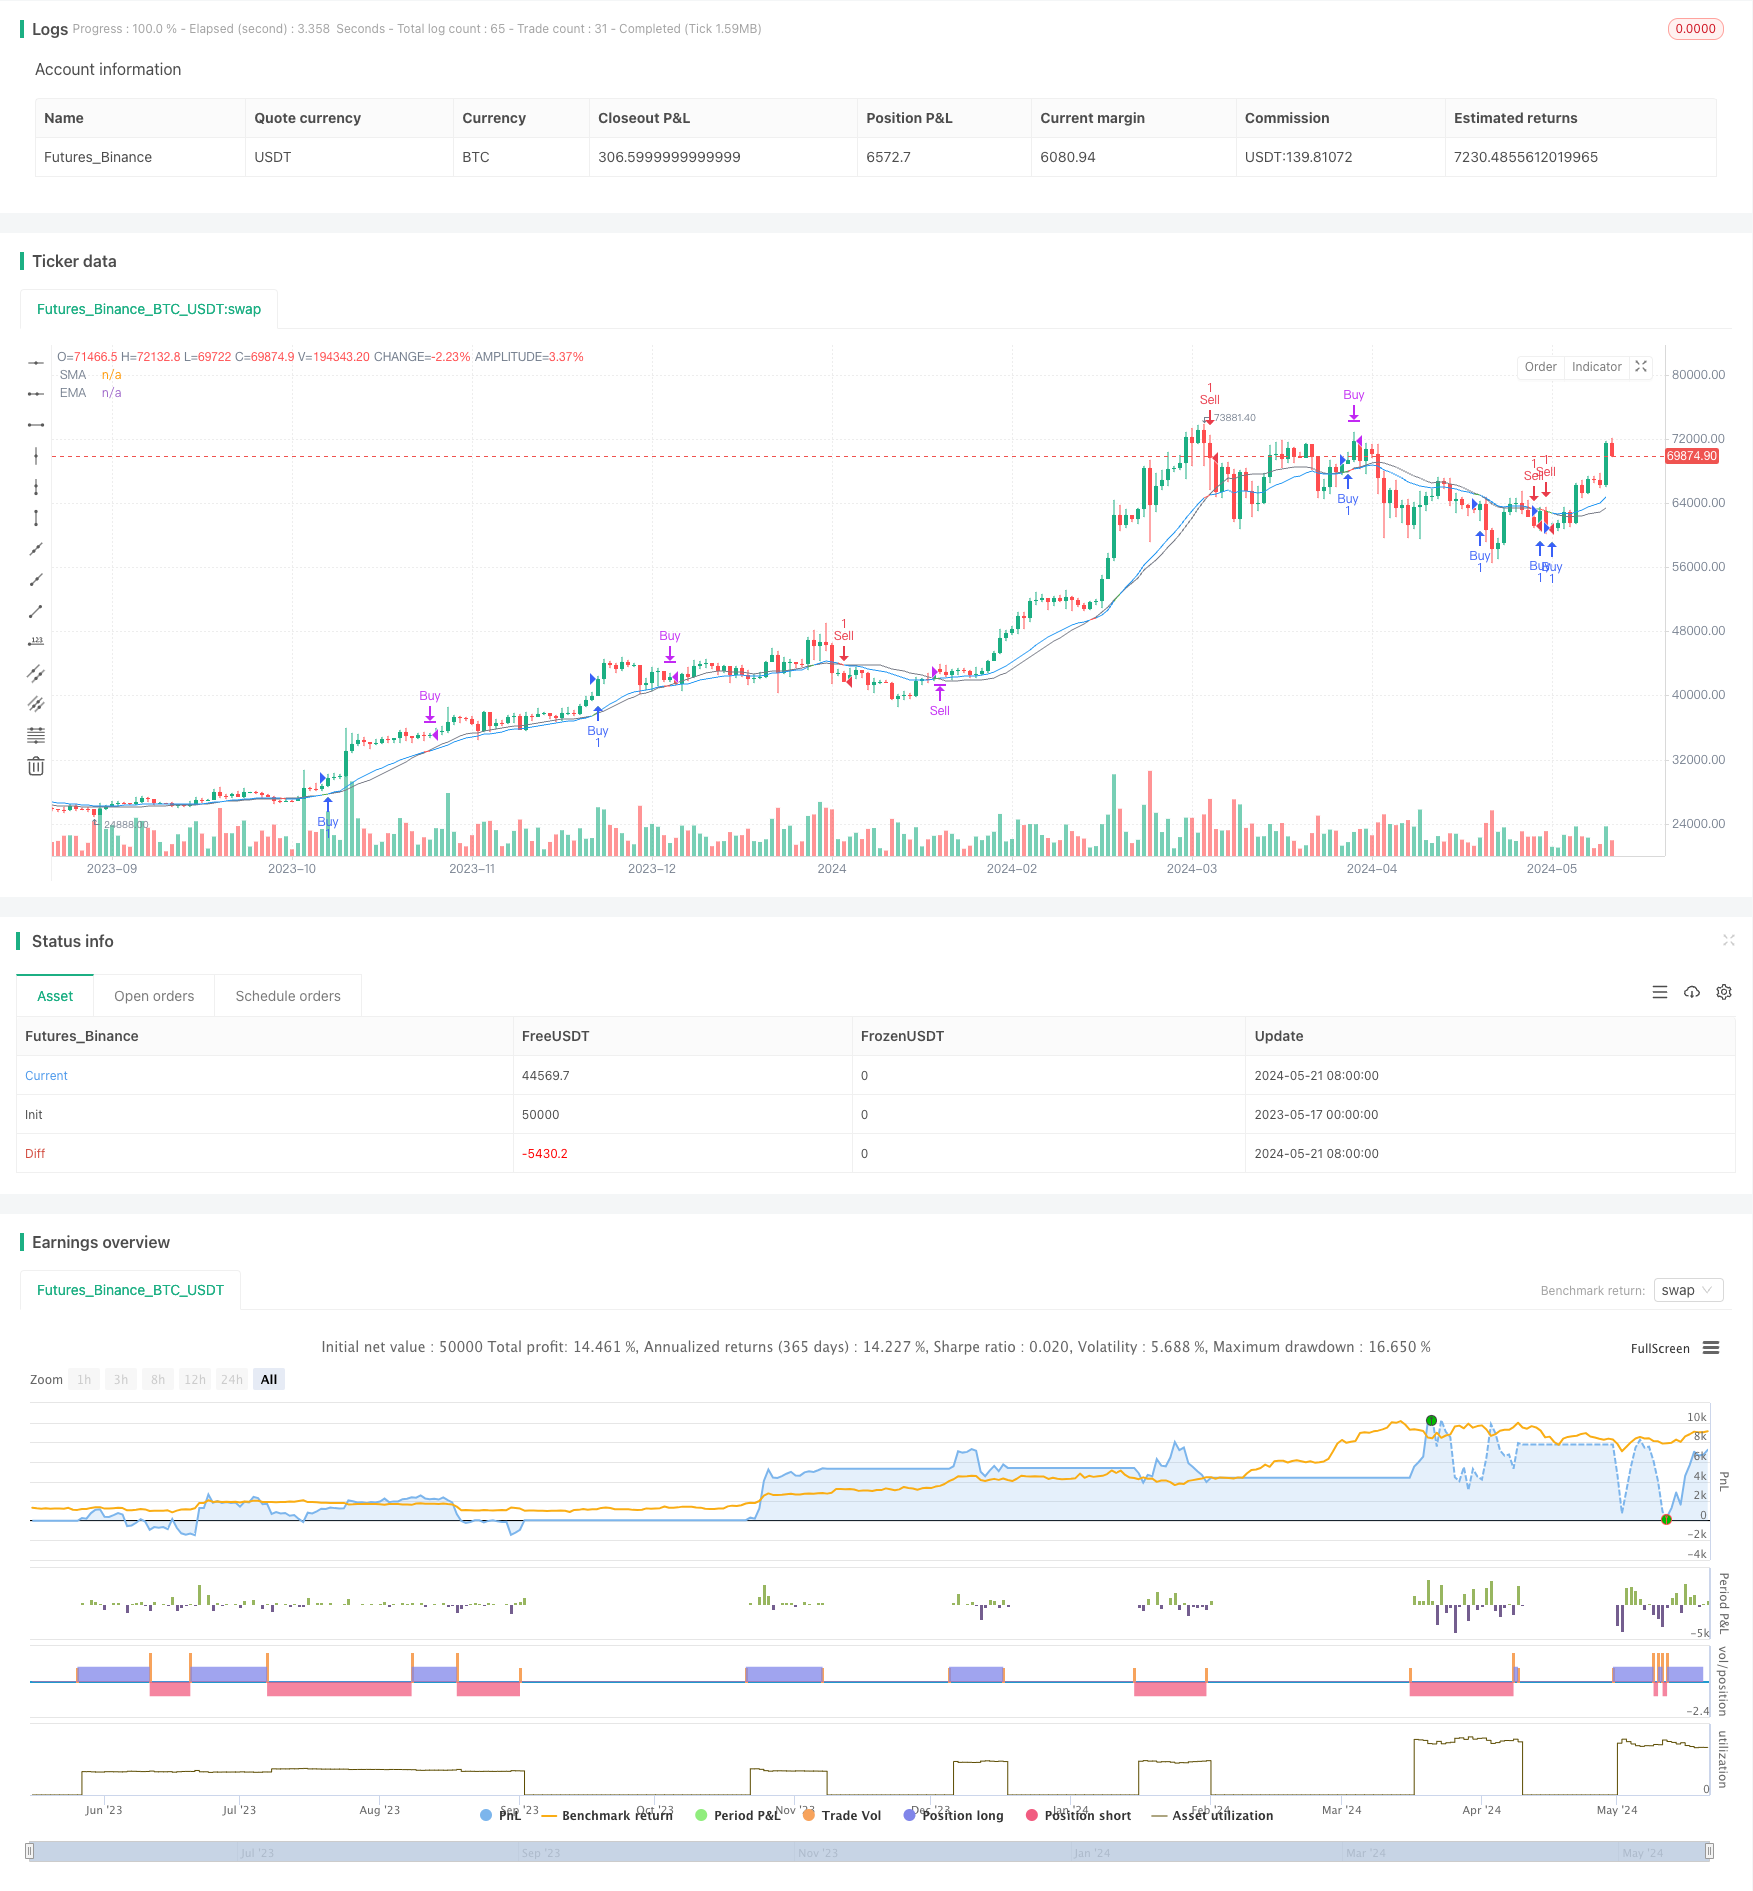 [trans]
概述
该策略是一个基于EMA和SMA两条移动平均线的交叉策略。当较慢的EMA从下向上穿过较快的SMA时,产生买入信号;当较慢的EMA从上向下穿过较快的SMA时,产生卖出信号。该策略旨在捕捉牛市中的上涨趋势,同时提供一定的支撑。
策略原理
该策略使用两条移动平均线:20周期的SMA和21周期的EMA。当EMA从下向上穿过SMA时,表明市场可能正在转向上涨趋势,因此产生买入信号。反之,当EMA从上向下穿过SMA时,表明市场可能正在转向下跌趋势,因此产生卖出信号。为了确认信号,该策略还要求当前收盘价高于前一个收盘价(买入信号)或低于前一个收盘价(卖出信号)。
优势分析
- 简单易懂:该策略基于两条常用的移动平均线,原理简单,易于理解和实现。
- 趋势跟踪:通过移动平均线的交叉,该策略能够较好地捕捉市场的趋势变化,特别是在牛市中的上涨趋势。
- 支撑作用:较慢的EMA可以作为一定的支撑位,在价格回撤时提供支撑。
风险分析
- 假信号:在市场波动较大或震荡行情中,该策略可能产生较多的假信号,导致频繁交易和高昂的交易成本。
- 滞后性:移动平均线具有一定的滞后性,可能导致错过最佳的入场和出场时机。
- 趋势识别:该策略对于趋势的识别能力有限,在市场转折点或趋势不明确时,可能表现不佳。
优化方向
- 结合其他指标:可以考虑结合其他技术指标,如RSI、MACD等,以提高信号的可靠性和准确性。
- 优化参数:可以通过优化移动平均线的周期参数,以适应不同的市场状况和交易品种。
- 加入止损和止盈:为了控制风险和保护利润,可以在策略中加入合适的止损和止盈机制。
总结
均线交叉牛市支撑带策略是一个简单易懂的趋势跟踪策略,特别适用于牛市行情。然而,该策略也存在一定的局限性,如假信号、滞后性和趋势识别能力有限等。通过结合其他指标、优化参数和加入止损止盈等方法,可以进一步提高该策略的表现和稳健性。
||
Overview
This strategy is a crossover strategy based on two moving averages, EMA and SMA. When the slower EMA crosses above the faster SMA, it generates a buy signal; when the slower EMA crosses below the faster SMA, it generates a sell signal. The strategy aims to capture upward trends in bull markets while providing some support.
Strategy Principle
The strategy uses two moving averages: a 20-period SMA and a 21-period EMA. When the EMA crosses above the SMA, it indicates that the market may be turning into an upward trend, thus generating a buy signal. Conversely, when the EMA crosses below the SMA, it indicates that the market may be turning into a downward trend, thus generating a sell signal. To confirm the signals, the strategy also requires the current closing price to be higher than the previous closing price (for buy signals) or lower than the previous closing price (for sell signals).
Advantage Analysis
- Simple and easy to understand: The strategy is based on two commonly used moving averages, with a simple principle that is easy to understand and implement.
- Trend tracking: By using the crossover of moving averages, the strategy can capture trend changes in the market relatively well, especially upward trends in bull markets.
- Support function: The slower EMA can act as a certain level of support, providing support when prices retrace.
Risk Analysis
- False signals: In highly volatile or choppy markets, the strategy may generate many false signals, leading to frequent trades and high trading costs.
- Lag: Moving averages have a certain lag, which may cause missing the best entry and exit points.
- Trend recognition: The strategy has limited ability to identify trends, and may perform poorly at market turning points or when trends are unclear.
Optimization Directions
- Combine with other indicators: Consider combining with other technical indicators, such as RSI, MACD, etc., to improve the reliability and accuracy of signals.
- Optimize parameters: Optimize the period parameters of the moving averages to adapt to different market conditions and trading instruments.
- Add stop-loss and take-profit: To control risks and protect profits, add appropriate stop-loss and take-profit mechanisms to the strategy.
Summary
The EMA-SMA Crossover Bull Market Support Band Strategy is a simple and easy-to-understand trend-following strategy that is particularly suitable for bull markets. However, the strategy also has certain limitations, such as false signals, lag, and limited trend recognition ability. By combining with other indicators, optimizing parameters, and adding stop-loss and take-profit, the performance and robustness of the strategy can be further improved. [/trans]
Source (PineScript)
/*backtest
start: 2023-05-17 00:00:00
end: 2024-05-22 00:00:00
period: 1d
basePeriod: 1h
exchanges: [{"eid":"Futures_Binance","currency":"BTC_USDT"}]
*/

// This source code is subject to the terms of the Mozilla Public License 2.0 at https://mozilla.org/MPL/2.0/
// © rodrinverte

//@version=5
strategy("EMA-SMA Crossover Strategy", overlay=true, initial_capital = 1000)

// Definir la longitud de las medias móviles
fast = ta.sma(close, 20)
slow = ta.ema(close, 21)

// Definir condiciones de compra y venta
buySignal = ta.crossover(slow, fast)
sellSignal = ta.crossunder(slow, fast)

// Configurar colores de las líneas y relleno
emaColor = buySignal ? color.green : sellSignal ? color.red : color.blue
smaColor = color.gray
fillColor = slow < fast ? color.new(color.green, 90) : color.new(color.red, 90)

// Esperar un periodo para confirmar la señal de compra o venta
buyConfirmation = close > close[1] and buySignal
sellConfirmation = close < close[1] and sellSignal

// Dibujar las medias móviles
plot(slow, title="EMA", color=emaColor)
plot(fast, title="SMA", color=smaColor)

// Configurar las señales de compra y venta
plotshape(buyConfirmation, style=shape.triangleup, location=location.belowbar, color=color.green, size=size.small)
plotshape(sellConfirmation, style=shape.triangledown, location=location.abovebar, color=color.red, size=size.small)

// Estrategia de compra y venta
if (buyConfirmation)
    strategy.entry("Buy", strategy.long)

if (sellConfirmation)
    strategy.entry("Sell", strategy.short)

// Cerrar posición opuesta al cruce original
if (sellSignal)
    strategy.close("Buy")

if (buySignal)
    strategy.close("Sell")
Detail
https://www.fmz.com/strategy/452280
Last Modified
2024-05-23 18:11:07