
8.4 KiB
Name
均值回归型布林带RSI策略结合ATR动态止损优化系统-Mean-Reversion-Strategy-with-Bollinger-Bands-RSI-and-ATR-Based-Dynamic-Stop-Loss-System
Author
ChaoZhang
Strategy Description
[trans]
概述
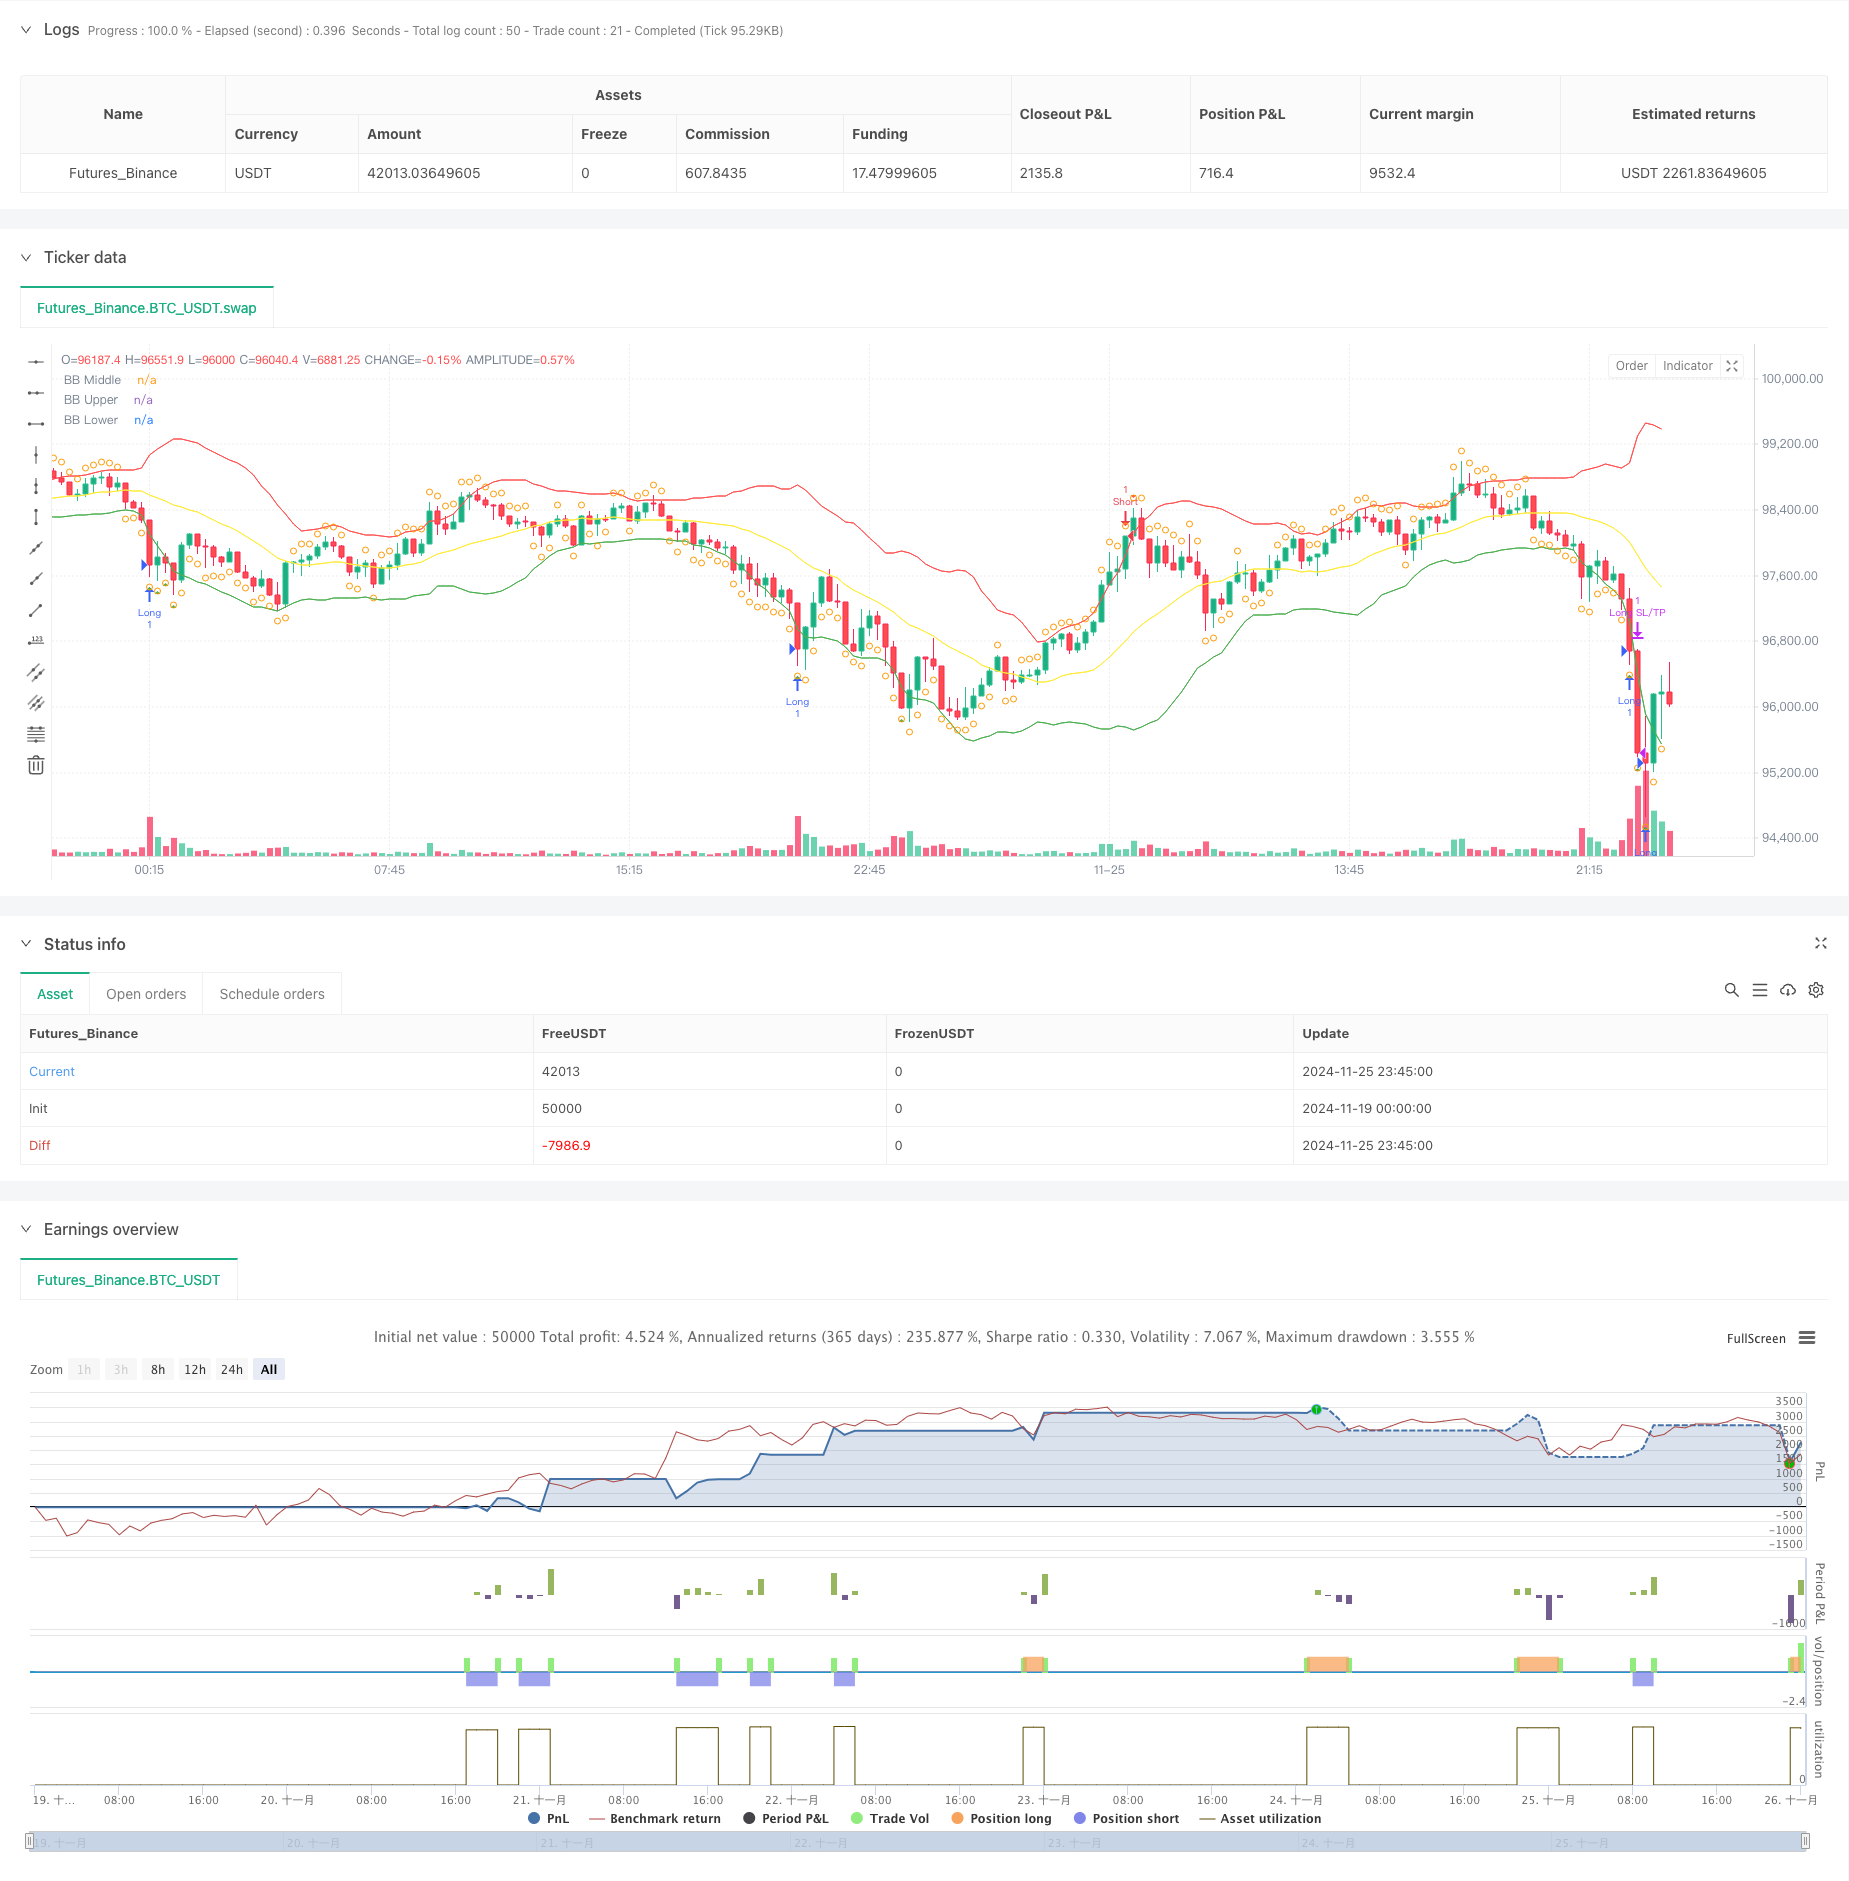
本策略是一个基于均值回归理论的量化交易系统,结合了布林带、RSI指标以及ATR动态止损机制。策略通过识别价格偏离均值的极端情况进行交易,当价格触及布林带下轨且RSI处于超卖区域时做多,当价格触及布林带上轨且RSI处于超买区域时做空,通过ATR动态设置止损止盈位置,实现风险收益的有效管理。
策略原理
策略采用20周期布林带作为主要趋势判断指标,标准差倍数设为2.0,用于确定价格波动的上下边界。同时引入14周期RSI作为辅助指标,RSI低于30视为超卖,高于70视为超买。当价格跌破布林带下轨且RSI低于30时,表明市场可能超卖,系统发出做多信号;当价格突破布林带上轨且RSI高于70时,表明市场可能超买,系统发出做空信号。策略使用布林带中轨作为获利了结点,并结合RSI反向突破进行仓位管理。此外,策略还引入了基于14周期ATR的动态止损止盈机制,止损设为2倍ATR,止盈设为3倍ATR,以实现更精确的风险控制。
策略优势
- 结合多指标交叉验证:通过布林带和RSI的协同配合,有效过滤虚假信号,提高交易准确率。
- 动态止损机制:采用ATR动态调整止损止盈位置,使风险管理更适应市场波动。
- 完整的交易闭环:包含明确的入场、出场条件和风险管理机制,逻辑完整清晰。
- 适应性强:策略参数可根据不同市场特征进行优化调整。
策略风险
- 趋势市场风险:均值回归策略在强趋势市场中可能频繁止损。
- 参数敏感性:布林带周期、RSI阈值等参数的设置对策略表现影响较大。
- 平仓时机把握:中轨平仓可能导致提前退出有利行情。
- 止损幅度:固定倍数的ATR止损在波动剧烈时可能过大。
策略优化方向
- 增加趋势过滤器:考虑添加更长周期的移动平均线,在强趋势市场中避免逆势交易。
- 引入成交量指标:将成交量作为交易信号的确认指标,提高交易质量。
- 优化止盈机制:可考虑采用trailing stop或分批止盈方式,提高盈利能力。
- 动态调整参数:基于市场波动率自适应调整布林带和RSI的参数设置。
总结
该策略通过布林带和RSI的组合应用,构建了一个完整的均值回归交易系统。ATR动态止损的引入有效控制了风险,使策略具有良好的风险收益特性。虽然存在一定的优化空间,但整体设计理念清晰,实用性较强。建议交易者在实盘应用时,根据具体市场特征调整参数,并持续监控策略表现。
||
Overview
This strategy is a quantitative trading system based on mean reversion theory, combining Bollinger Bands, RSI indicators, and ATR-based dynamic stop-loss mechanism. The strategy trades by identifying extreme price deviations from the mean, going long when price touches the lower Bollinger Band and RSI is in oversold territory, and going short when price touches the upper Bollinger Band and RSI is in overbought territory, while using ATR to dynamically set stop-loss and take-profit levels for effective risk-reward management.
Strategy Principles
The strategy employs 20-period Bollinger Bands as the primary trend indicator, with a standard deviation multiplier of 2.0 to determine price movement boundaries. A 14-period RSI is incorporated as a supplementary indicator, with readings below 30 considered oversold and above 70 considered overbought. Long positions are initiated when price breaks below the lower band and RSI is below 30, indicating potential oversold conditions, while short positions are taken when price breaks above the upper band and RSI is above 70, indicating potential overbought conditions. The middle band serves as the profit-taking level, combined with RSI reversal signals for position management. Additionally, a 14-period ATR-based dynamic stop-loss mechanism is implemented, with stops set at 2x ATR and profit targets at 3x ATR for precise risk control.
Strategy Advantages
- Multi-indicator cross-validation: The combination of Bollinger Bands and RSI effectively filters false signals and improves trading accuracy.
- Dynamic stop-loss mechanism: ATR-based adjustment of stop-loss and take-profit levels adapts to market volatility.
- Complete trading loop: Includes clear entry, exit conditions, and risk management mechanisms with coherent logic.
- High adaptability: Strategy parameters can be optimized for different market characteristics.
Strategy Risks
- Trend market risk: Mean reversion strategies may experience frequent stops in strong trend markets.
- Parameter sensitivity: Settings for Bollinger Bands period and RSI thresholds significantly impact strategy performance.
- Exit timing: Middle band exits may result in premature position closure during favorable conditions.
- Stop-loss magnitude: Fixed ATR multiplier stops may be excessive during high volatility periods.
Optimization Directions
- Add trend filters: Consider incorporating longer-period moving averages to avoid counter-trend trades in strong trends.
- Integrate volume indicators: Use volume as a trade signal confirmation indicator to improve trade quality.
- Optimize profit-taking: Consider implementing trailing stops or scaled exit methods to enhance profitability.
- Dynamic parameter adjustment: Implement adaptive adjustment of Bollinger Bands and RSI parameters based on market volatility.
Summary
The strategy constructs a comprehensive mean reversion trading system through the combined application of Bollinger Bands and RSI. The introduction of ATR-based dynamic stops effectively controls risk, providing favorable risk-reward characteristics. While there is room for optimization, the overall design concept is clear and practical. Traders are advised to adjust parameters according to specific market characteristics and continuously monitor strategy performance when implementing in live trading.[/trans]
Source (PineScript)
/*backtest
start: 2024-11-19 00:00:00
end: 2024-11-26 00:00:00
period: 15m
basePeriod: 15m
exchanges: [{"eid":"Futures_Binance","currency":"BTC_USDT"}]
*/

//@version=5
strategy("SOL/USDT Mean Reversion Strategy", overlay=true)

// Input parameters
length = input(20, "Bollinger Band Length")
std_dev = input(2.0, "Standard Deviation")
rsi_length = input(14, "RSI Length")
rsi_oversold = input(30, "RSI Oversold")
rsi_overbought = input(70, "RSI Overbought")

// Calculate indicators
[middle, upper, lower] = ta.bb(close, length, std_dev)
rsi = ta.rsi(close, rsi_length)

// Entry conditions
long_entry = close < lower and rsi < rsi_oversold
short_entry = close > upper and rsi > rsi_overbought

// Exit conditions
long_exit = close > middle or rsi > rsi_overbought
short_exit = close < middle or rsi < rsi_oversold

// Strategy execution
if (long_entry)
    strategy.entry("Long", strategy.long)

if (short_entry)
    strategy.entry("Short", strategy.short)

if (long_exit)
    strategy.close("Long")

if (short_exit)
    strategy.close("Short")

// Stop loss and take profit
atr = ta.atr(14)
strategy.exit("Long SL/TP", "Long", stop=strategy.position_avg_price - 2*atr, limit=strategy.position_avg_price + 3*atr)
strategy.exit("Short SL/TP", "Short", stop=strategy.position_avg_price + 2*atr, limit=strategy.position_avg_price - 3*atr)

// Plot indicators
plot(middle, color=color.yellow, title="BB Middle")
plot(upper, color=color.red, title="BB Upper")
plot(lower, color=color.green, title="BB Lower")

// Plot entry and exit points
plotshape(long_entry, title="Long Entry", location=location.belowbar, color=color.green, style=shape.triangleup, size=size.small)
plotshape(short_entry, title="Short Entry", location=location.abovebar, color=color.red, style=shape.triangledown, size=size.small)
plotshape(long_exit, title="Long Exit", location=location.abovebar, color=color.orange, style=shape.circle, size=size.small)
plotshape(short_exit, title="Short Exit", location=location.belowbar, color=color.orange, style=shape.circle, size=size.small)
Detail
https://www.fmz.com/strategy/473125
Last Modified
2024-11-27 14:28:17