
12 KiB
Name
双重超跌翻转突破系统A-Powerful-System-Combining-Reversal-and-Trend-Following-Strategies
Author
ChaoZhang
Strategy Description
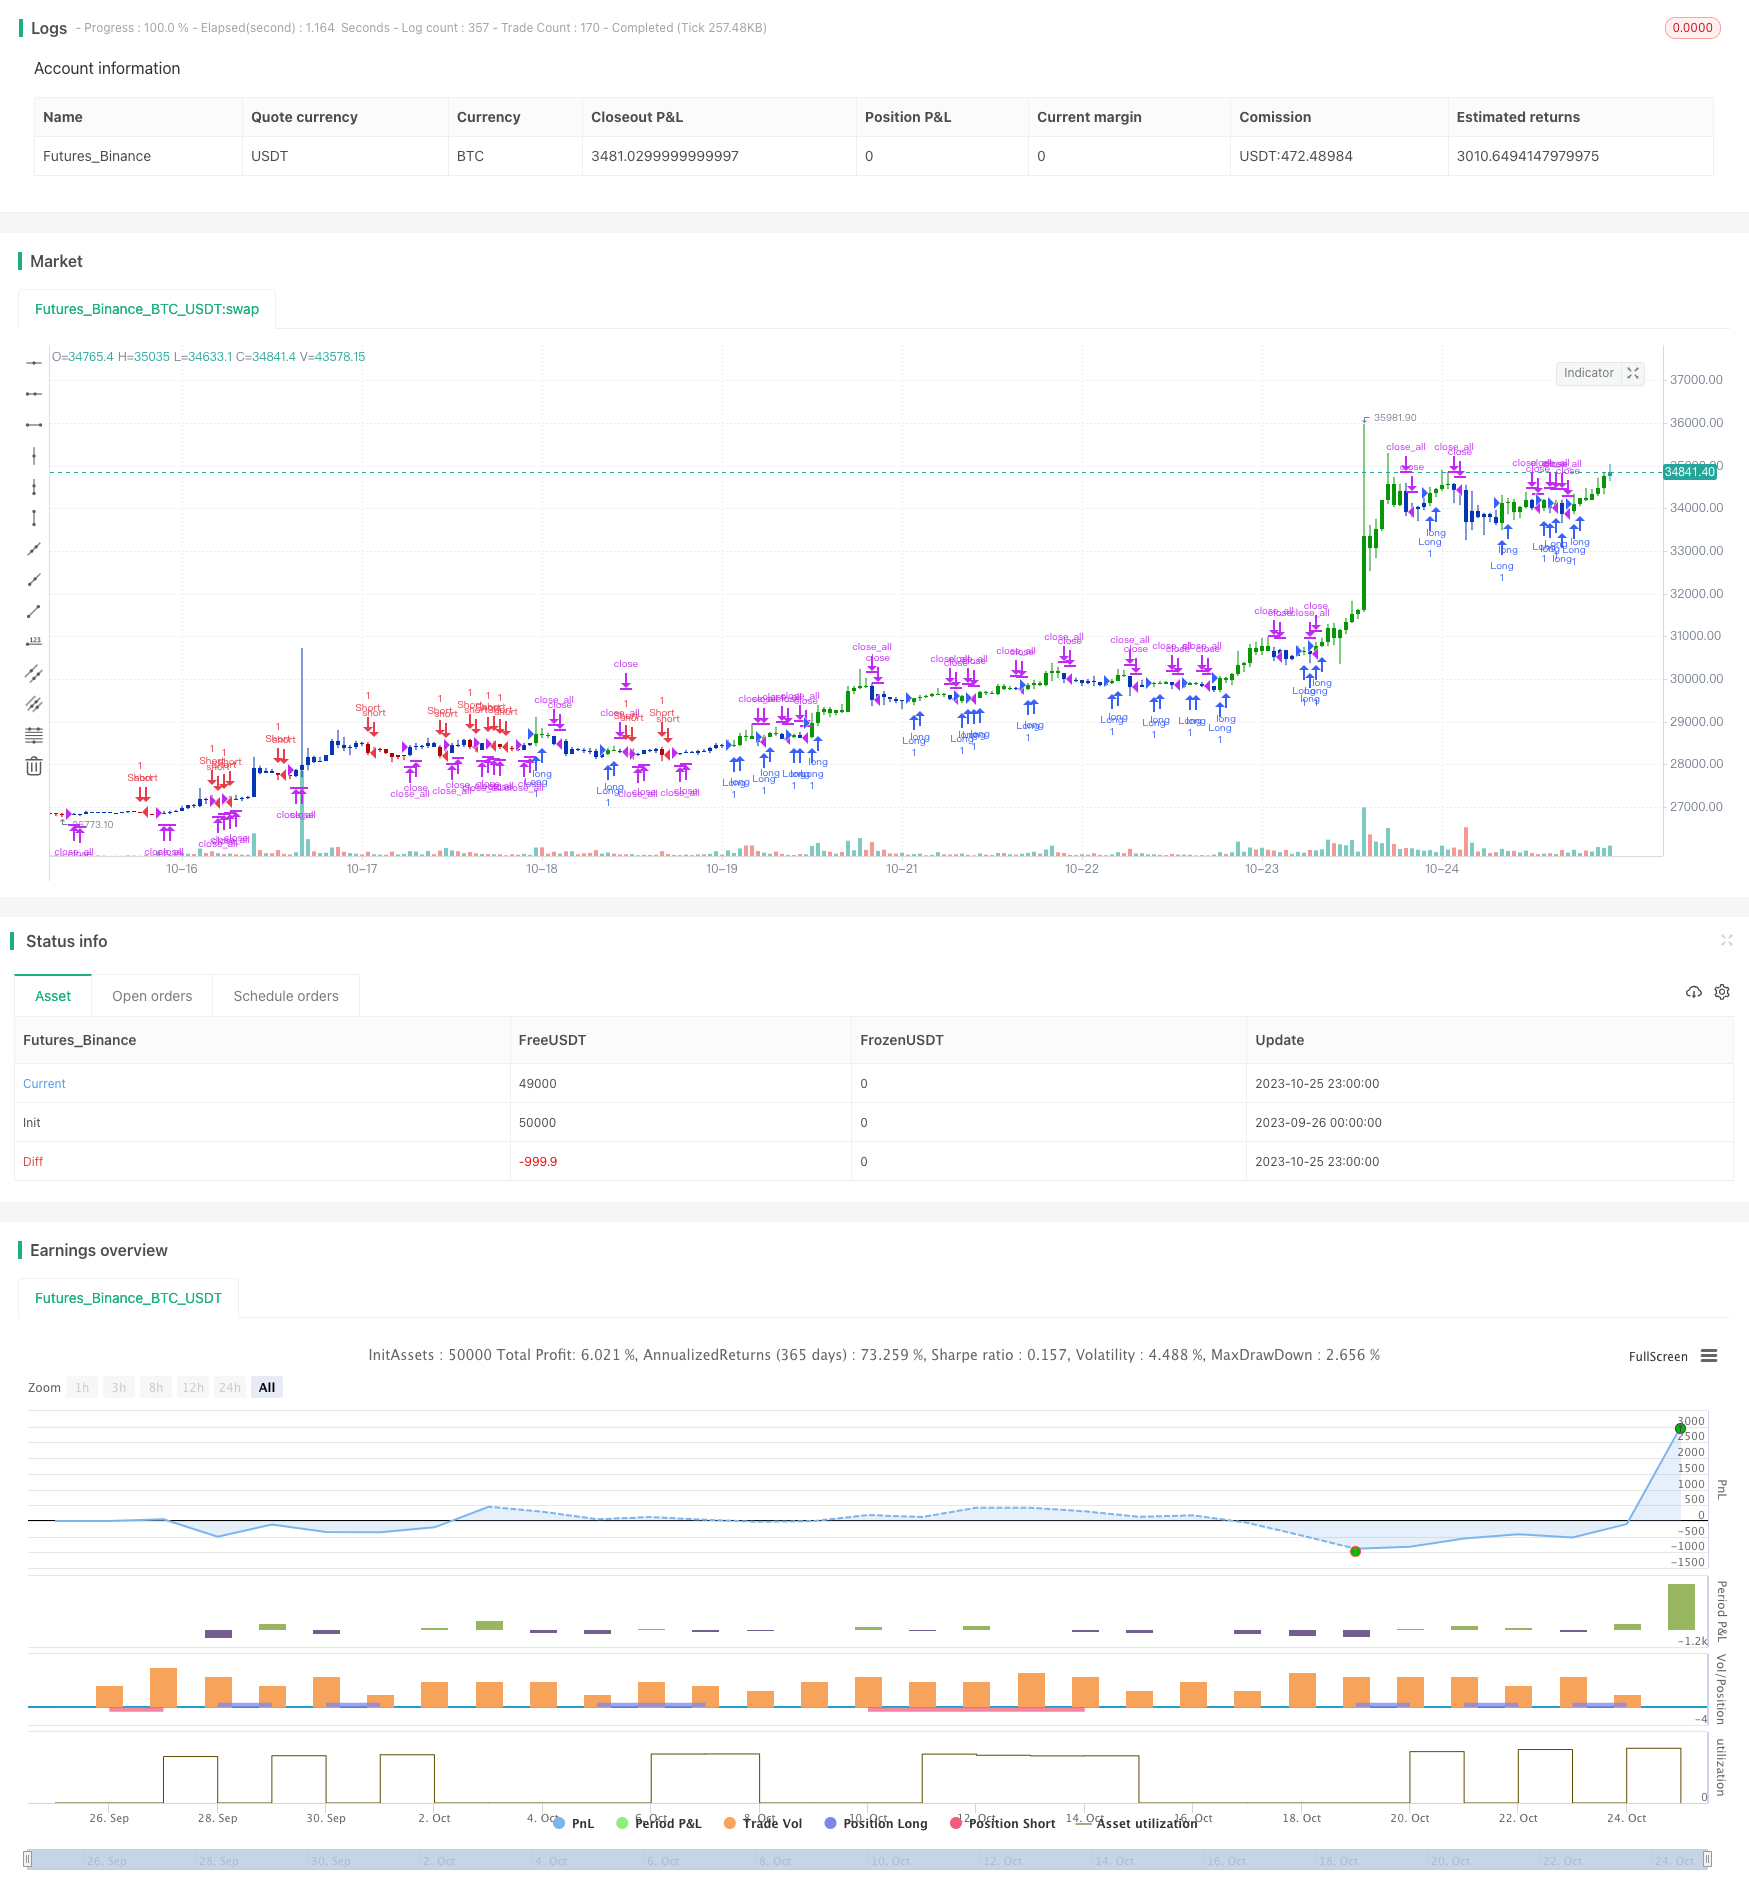 [trans]
概述
双重超跌翻转突破系统是一种结合趋势跟踪和反转交易的量化策略。该策略通过计算股价较之前N天收盘价是否出现连续超跌信号,进而产生买入信号;同时结合计算特定参数的T3移动平均线,产生卖出信号,实现获利保护。
策略原理
该策略由两部分组成:
- 123反转系统
根据书中描述,该反转系统观察过去N天的收盘价变化,如果今天的收盘价较前一日收高,且前一日较前两日收盘价收低,即视为连续两日超跌信号,该系统产生买入信号。此外,该系统还会结合STOCH指标,如果今日的STOCH快线低于慢线,则进一步确认买入信号有效性。
- T3移动平均线
T3移动平均线是根据一定计算公式,结合价格的指数移动平均线计算而来。其通过一定的参数,调节移动平均线对价格变化的灵敏度。当价格上穿T3移动平均线时,产生卖出信号。
该策略将上述两部分信号综合,当同时满足123反转的买入信号和T3移动平均线的卖出信号时,对应的产生真实的交易信号。
优势分析
- 反转交易策略,适合择底买入,跟踪超跌反弹行情
- 移动平均线策略,有利于锁定盈利,规避风险
- 双重信号结合,可以提高信号有效性,减少假信号
- 兼具趋势跟踪和反转交易的优点
- 参数可调整,可以灵活适应不同行情
风险分析
- 反转信号可能出现误判,产生亏损交易
- 参数设置不当可能导致交易频繁,增加交易成本和滑点成本
- 移动平均线产生的卖出信号可能过早锁定盈利
- 行情剧烈变动时,止损风险依然存在
- 需要优化参数设定,以针对不同品种选择最佳参数
针对风险,可采取如下措施:
- 适当调整反转交易的参数,确保信号有效性
- 调整移动平均线的参数,适当延长持仓时间
- 增加止损策略,降低单笔损失
- 优化参数选择,针对不同品种分别选择参数
优化方向
该策略可以从以下几个方面进行优化:
-
增加过滤条件,确保交易信号有效性
可以在原策略的基础上,增加其他技术指标作为过滤条件,如增加成交量的突破条件等,从而避免因噪音导致的错误交易。
-
调整参数设置,适应市场环境
可以通过多种参数组合进行回测,选择参数对应收益率最高的组合,以优化策略效果。也可以设定动态参数,根据市场情况实时调整。
-
结合机器学习技术,实现策略的自适应优化
例如,可以收集大量历史数据,利用机器学习训练模型,来预测最佳的买入卖出时机。并实时优化策略的参数。
-
根据不同品种特点,设定独立的参数
不同品种特性不同,适合的参数也会有所差异。可以根据不同品种数据进行单独回测,设定独立的参数。
总结
双重超跌翻转突破系统综合了趋势跟踪和反转交易的优点。它能在超跌阶段买入较低价格,并利用趋势获利后及时止盈。该策略反转信号与趋势信号的有效组合,可以有效获取反转机会的同时锁定盈利。虽然仍存在一定风险,但可通过参数优化、增加过滤条件等方式进行改进,以适应不同市场环境。该策略为量化交易提供了有效的思路,值得进一步优化应用。
||
Overview
The Double Dip Reversal Breakout System combines elements of reversal and trend-following strategies in quantitative trading. It generates buy signals by detecting consecutive down days compared to previous closing prices, and sell signals when the price crosses above the T3 moving average line, allowing for profitable trades while managing risks.
How It Works
The system consists of two components:
- The 123 Reversal
It observes the closing price changes over past N days. If today's close is higher than yesterday's, and yesterday is lower than the day before, it signals two consecutive down days and triggers a buy signal. It also uses the STOCH indicator - when today's STOCH fast line is lower than the slow line, it further confirms the validity of the buy signal.
- The T3 Moving Average
The T3 line is calculated based on exponential moving averages using a special formula. By adjusting parameters, it controls the moving average's sensitivity to price changes. A sell signal is generated when the price crosses above the T3 line.
The system combines the two signals above, generating actual trading signals only when the 123 Reversal buy signal and T3 Sell signal occur together.
Advantage Analysis
- Effective for bottom-fishing reversal trades and riding counter-trend bounces
- The moving average helps lock in profits and manage risks
- The dual-signal mechanism improves signal validity and reduces false signals
- Combines the strengths of both trend-following and reversal strategies
- Adjustable parameters allow flexibility for different market conditions
Risk Analysis
- Reversal signals may be false, leading to losing trades
- Improper parameter tuning may cause over-trading, increasing costs
- Sell signals from moving average may prematurely exit profitable trends
- Risks like stop-loss hunting remain during volatile markets
- Parameters need to be optimized for different instruments
To address the risks, the following can be done:
- Adjust reversal parameters to improve signal validity
- Tune moving average parameters to extend holding period
- Add stop-loss to limit losses
- Optimize parameters separately for different instruments
Enhancement Opportunities
The strategy can be improved in several aspects:
-
Add filters to ensure signal validity
Additional indicators like volume breakouts can be added as filters to avoid false trades.
-
Adjust parameters for changing markets
Backtest various parameter combinations and select the set giving highest returns. Dynamic parameter tuning can also be used.
-
Incorporate machine learning for adaptive optimization
Collect large historical datasets, train ML models to forecast optimal entry/exit points, and dynamically optimize parameters.
-
Optimize parameters separately for different instruments
Instruments have different characteristics, so their optimal parameters also differ. Backtest and tune parameters independently for each.
Conclusion
The Double Dip Reversal Breakout System synergistically combines trend-following and reversal trading. It allows buying at lows after dips and securing profits from trends using moving average. The effective combination of reversal and trend signals capitalizes on reversal opportunities while locking in profits. Despite some risks, the strategy can be improved via parameter optimization, adding filters etc. to suit different market conditions. It provides effective insights for quantitative trading and merits further enhancement.
[/trans]
Strategy Arguments
| Argument | Default | Description |
|---|---|---|
| v_input_1 | true | ---- 123 Reversal ---- |
| v_input_2 | 14 | Length |
| v_input_3 | true | KSmoothing |
| v_input_4 | 3 | DLength |
| v_input_5 | 50 | Level |
| v_input_6 | true | ---- T3 Averages ---- |
| v_input_7 | 5 | LengthT3 |
| v_input_8 | 0.7 | b |
| v_input_9 | false | Trade reverse |
Source (PineScript)
/*backtest
start: 2023-09-26 00:00:00
end: 2023-10-26 00:00:00
period: 1h
basePeriod: 15m
exchanges: [{"eid":"Futures_Binance","currency":"BTC_USDT"}]
*/

//@version=4
////////////////////////////////////////////////////////////
//  Copyright by HPotter v1.0 16/09/2021
// This is combo strategies for get a cumulative signal.
//
// First strategy
// This System was created from the Book "How I Tripled My Money In The
// Futures Market" by Ulf Jensen, Page 183. This is reverse type of strategies.
// The strategy buys at market, if close price is higher than the previous close
// during 2 days and the meaning of 9-days Stochastic Slow Oscillator is lower than 50.
// The strategy sells at market, if close price is lower than the previous close price
// during 2 days and the meaning of 9-days Stochastic Fast Oscillator is higher than 50.
//
// Second strategy
// This indicator plots the moving average described in the January, 1998 issue
// of S&C, p.57, "Smoothing Techniques for More Accurate Signals", by Tim Tillson.
// This indicator plots T3 moving average presented in Figure 4 in the article.
// T3 indicator is a moving average which is calculated according to formula:
//     T3(n) = GD(GD(GD(n))),
// where GD - generalized DEMA (Double EMA) and calculating according to this:
//     GD(n,v) = EMA(n) * (1+v)-EMA(EMA(n)) * v,
// where "v" is volume factor, which determines how hot the moving average’s response
// to linear trends will be. The author advises to use v=0.7.
// When v = 0, GD = EMA, and when v = 1, GD = DEMA. In between, GD is a less aggressive
// version of DEMA. By using a value for v less than1, trader cure the multiple DEMA
// overshoot problem but at the cost of accepting some additional phase delay.
// In filter theory terminology, T3 is a six-pole nonlinear Kalman filter. Kalman
// filters are ones that use the error — in this case, (time series - EMA(n)) —
// to correct themselves. In the realm of technical analysis, these are called adaptive
// moving averages; they track the time series more aggres-sively when it is making large
// moves. Tim Tillson is a software project manager at Hewlett-Packard, with degrees in
// mathematics and computer science. He has privately traded options and equities for 15 years.
//
// WARNING:
// - For purpose educate only
// - This script to change bars colors.
////////////////////////////////////////////////////////////
Reversal123(Length, KSmoothing, DLength, Level) =>
    vFast = sma(stoch(close, high, low, Length), KSmoothing)
    vSlow = sma(vFast, DLength)
    pos = 0.0
    pos := iff(close[2] < close[1] and close > close[1] and vFast < vSlow and vFast > Level, 1,
	         iff(close[2] > close[1] and close < close[1] and vFast > vSlow and vFast < Level, -1, nz(pos[1], 0)))
	pos


T3A(Length, b) =>
    pos = 0.0
    xPrice = close
    xe1 = ema(xPrice, Length)
    xe2 = ema(xe1, Length)
    xe3 = ema(xe2, Length)
    xe4 = ema(xe3, Length)
    xe5 = ema(xe4, Length)
    xe6 = ema(xe5, Length)
    c1 = -b*b*b
    c2 = 3*b*b+3*b*b*b
    c3 = -6*b*b-3*b-3*b*b*b
    c4 = 1+3*b+b*b*b+3*b*b
    nT3Average = c1 * xe6 + c2 * xe5 + c3 * xe4 + c4 * xe3
    pos:= iff(nT3Average > close, -1,
           iff(nT3Average < close, 1, nz(pos[1], 0)))
    pos

strategy(title="Combo Backtest 123 Reversal & T3 Averages", shorttitle="Combo", overlay = true)
line1 = input(true, "---- 123 Reversal ----")
Length = input(14, minval=1)
KSmoothing = input(1, minval=1)
DLength = input(3, minval=1)
Level = input(50, minval=1)
//-------------------------
line2 = input(true, "---- T3 Averages ----")
LengthT3 = input(5, minval=1)
b = input(0.7, minval=0.01,step=0.01)
reverse = input(false, title="Trade reverse")
posReversal123 = Reversal123(Length, KSmoothing, DLength, Level)
posT3A = T3A(LengthT3, b)
pos = iff(posReversal123 == 1 and posT3A == 1 , 1,
	   iff(posReversal123 == -1 and posT3A == -1, -1, 0))
possig = iff(reverse and pos == 1, -1,
          iff(reverse and pos == -1 , 1, pos))
if (possig == 1 )
    strategy.entry("Long", strategy.long)
if (possig == -1 )
    strategy.entry("Short", strategy.short)
if (possig == 0)
    strategy.close_all()
barcolor(possig == -1 ? #b50404: possig == 1 ? #079605 : #0536b3 )
Detail
https://www.fmz.com/strategy/430372
Last Modified
2023-10-27 16:22:08